SUMMARY
Based on survey data from 193 banks in 20 countries we provide the first bank-level analysis of the relationship between bank ownership, bank funding and foreign currency (FX) lending across emerging Europe. Our results contra-dict the widespread view that foreign banks have been driving FX lending to retail clients as a result of easier access to foreign wholesale funding. Our cross-sectional analysis shows that foreign banks do lend more in FX to corporate clients but not to households. Moreover, we find no evidence that wholesale funding had a strong causal effect on FX lending for either foreign or domestic banks. Panel estimations show that the foreign acquisition of a domes-tic bank does lead to faster growth in FX lending to households. However, this is driven by faster growth in household lending in general not by a shift towards FX lending.
— Martin Brown and Ralph De Haas
Foreign
banks
in
emerging
Europe
Economic Policy January 2012 Printed in Great Britain Ó CEPR, CES, MSH, 2012.
Foreign banks and foreign
currency lending in emerging
Europe
Martin Brown and Ralph De Haas
University of St Gallen; European Bank for Reconstruction and Development
1. INTRODUCTION
Unhedged foreign currency (FX) borrowing is seen as a major threat to financial sta-bility in emerging Europe. More than 80% of all private sector loans in Belarus, Lat-via and Serbia are currently denominated in (or linked to) a foreign currency and the share of FX loans also exceeds that of domestic currency loans in various other countries including Bulgaria, Hungary and Romania (European Bank for Recon-struction and Development (EBRD), 2010. FX borrowing throughout the region is dominated by retail loans – household mortgages, consumer credit and small busi-ness loans – to clients which typically have their income and assets in local currency. It is therefore not surprising that national authorities have taken measures to
dis-This paper was presented at the 53rd Panel Meeting of Economic Policy in Budapest. We would like to thank Asel Isakova and Veronika Zavacka for helpful statistical assistance and La´szlo´ Halpern, Olena Havrylchyk, Maria Soledad Martinez Pe-ria, Alexander Popov, Marta Serra Garcia, Karolin Kirschenmann, Ce´dric Tille, Aaron Tornell, Paul Wachtel, Frank West-ermann, Jeromin Zettelmeyer, three anonymous referees, and participants at the EBRD Research Seminar, the XIX International Tor Vergata Conference on Money, Banking and Finance, the EBRD-Reinventing Bretton Woods Committee Conference on Developing Local Currency Finance, and the 53rd Economic Policy Panel Meeting for useful comments. The views expressed are those of the authors and do not necessarily reflect those of the EBRD.
The Managing Editor in charge of this paper was Philip Lane.
Economic Policy January 2012. pp. 57–98 Printed in Great Britain Ó CEPR, CES, MSH, 2012.
courage such loans. Supervisors in Hungary, Latvia and Poland have pushed banks to disclose the exchange rate risks of FX loans to clients and to tighten the eligibility criteria for such loans. In countries like Croatia, Kazakhstan and Romania stronger provisioning requirements were imposed on FX compared to local currency loans. Ukraine even completely banned FX lending to households in late 2008.
The call for policies to curb FX lending in Eastern Europe has intensified lately. In June 2010 the European Central Bank (ECB) stated that national efforts to rein in FX lending have had little impact and called for better coordination, including
among home-country regulators of banks with subsidiaries in Eastern Europe.1 In
this line of thinking FX lending is largely supply-driven, with FX funding of banks, often from their parent banks, at the heart of the problem. Surprisingly, the wide-spread view that FX lending in Eastern Europe is driven by foreign bank subsidiaries with access to ample FX funding has not yet been substantiated by empirical ana-lysis. Comparisons of cross-country data document higher shares of FX lending in countries where banks have larger cross-border liabilities (Bakker and Gulde, 2010; Basso et al., 2010). However, whether such liabilities are causing or being caused by FX loans is hard to establish from aggregate data. Recent loan-level evidence for Bulgaria suggests that FX lending seems to be at least partly driven by customer deposits in FX, while wholesale funding in FX is a result rather than a cause of FX lending (Brown et al., 2010). It is unclear, however, whether this applies to a broad set of banks across the transition region.
The impact of foreign bank ownership on euroization and financial stability is a pertinent policy question. After the fall of the Berlin wall governments and develop-ment institutions actively supported the process of banking integration between Western and Eastern Europe. This support was based on the presumed positive impact of foreign bank entry on the efficiency and stability of local banking systems. The empirical evidence that emerged over the next two decades suggests that for-eign banks indeed contributed to more efficient (Fries and Taci, 2005) and stable (De Haas and Van Lelyveld, 2006) banking sectors. However, the recent financial crisis has hit emerging Europe hard and questions have been raised about foreign banks’ role in creating the economic imbalances, including large unhedged FX exposures, which made the region vulnerable. Regulation may help to counterbal-ance distortions – such as banks and borrowers that disregard the negative external-ities of FX loans in terms of increasing the risk of a systemic crisis (see Rancie`re et al., 2010). Our paper contributes to this debate by using bank-level data to analyse to what extent FX lending in Eastern Europe is related to the presence of foreign banks and their funding.
Our main data source is the EBRD Banking Environment and Performance Survey (BEPS) conducted in 2005 and covering 95 foreign-owned and 98
1
domestic-owned banks in 20 transition countries. The BEPS elicits detailed informa-tion on the loan and deposit structure of each bank in 2001 and 2004, its risk man-agement, as well as its assessment of local creditor rights and banking regulation. We match the BEPS data with financial statement data provided by Bureau van Dijk’s BankScope database and with country-level indicators of the interest rate dif-ferential on foreign versus local currency funds, exchange rate volatility, inflation history, and the position of the country on the path towards EU accession.
While we do not cover the immediate run-up to and aftermath of the recent financial crisis, the observation period covered by our data is particularly interest-ing to study FX lendinterest-ing dynamics. Durinterest-ing this period foreign currency lendinterest-ing to corporate clients was already widespread in Eastern Europe. For the banks in our sample the mean share of the corporate loan portfolio denominated in FX was 41% in 2001 and 44% in 2004. During this three-year period we do, how-ever, observe a significant increase in FX lending by banks in some countries (such as Belarus and Estonia) while in other countries (Kazakhstan, Russia) banks reduced FX lending. Furthermore, FX lending to households increased substan-tially across Eastern Europe during our observation period. Considering the banks in our sample, we find that the share of FX loans in their household loan portfolio increased from 28% in 2001 to 38% in 2004. Our data allow us to investigate to what extent these developments in FX lending to corporate and household clients are related to changes in the ownership and funding structure of banks.
Our results contradict the view that foreign banks have been driving FX lending to unsuspecting retail clients throughout Eastern Europe as a result of easier access to cross-border funding. First, our cross-sectional results suggest that while foreign banks do lend more in FX to corporate clients, they do not do so to households. Second, while the foreign acquisition of a bank does lead to faster growth in FX lending to retail clients, this is driven by faster growth in household lending per se and not by a redirecting of credit from domestic to foreign currency. Third, we find no evidence that wholesale funding had a strong causal effect on FX lending for any type of bank over the 2001–2004 period. The correlation between wholesale funding and FX lending at the bank level is weak. If anything, wholesale funding seems to be a result rather than a determinant of FX lending.
All in all, our findings tell us that foreign banks did not indiscriminately ‘push’ FX loans through their subsidiary network in the transition region, but followed a more subtle approach where FX lending is targeted to (corporate) clients that can carry the associated risks and to countries in which FX lending to households is attractive from a macroeconomic perspective. These results provide important insights to policymakers into the drivers of FX lending. In particular, they suggest that credible macroeconomic policies which encourage depositors to save in local currency may be more important than regulatory proposals to limit the wholesale funding of banks.
The rest of the paper is organized as follows. Section 2 relates our study to the existing theoretical and empirical literature on FX lending. Section 3 describes our data and Section 4 presents our results. Section 5 sets out our policy conclusions.
2. LITERATURE AND HYPOTHESES
In this section we review existing theoretical and empirical studies on the currency denomination of bank loans, establish the hypotheses for our empirical analysis, and clarify our contribution to the literature.
2.1. Bank funding
The share of foreign currency assets held by a bank is typically related to the cur-rency structure of its liabilities because banks are limited by prudential regulation in the FX exposure they can take. In a country with underdeveloped derivative markets for foreign currency exchange, banks’ supply of FX loans therefore depends on their own access to foreign currency funding from depositors, financial markets and/or parent banks.
Recent evidence for Eastern Europe provides mixed results on the role of bank funding as a driver of FX lending. Basso et al. (2010) examine aggregate credit dollarization for 24 transition countries for the period 2000–2006. They find that countries in which banks have a higher share of foreign funding display a higher share of FX loans. De Haas and Naaborg (2006) and De Haas and Van Lelyveld (2006, 2010) show that parent bank funding, typically denominated in FX, influ-ences the credit growth of foreign subsidiaries. To the extent that subsidiaries do not swap these funds into local currency, access to parent bank funding may have a positive impact on FX lending.
Luca and Petrova (2008) by contrast find no robust relation between aggregate lending in FX across transition countries and aggregate foreign liabilities of banks. They do, however, find a strong relation between aggregate levels of deposit dollar-ization and FX lending. Similarly, Brown et al. (2010) provide loan-level evidence that FX lending is driven by customer funding of banks in FX, rather than whole-sale funding in FX.
2.2. Banks’ sensitivity to monetary conditions
Banks’ willingness to supply FX loans, and borrowers’ demand for such loans, also depends on monetary conditions. On the demand side, firms and households are more likely to request FX loans when interest differentials are high and real exchange rate volatility is low. Luca and Petrova (2008) examine a model of credit dollarization in which risk-averse banks and firms choose an optimal portfolio of foreign and local currency loans. In line with other portfolio-choice models of
foreign currency debt (Ize and Levy-Yeyati, 2003) they predict that banks offer more foreign currency loans when the volatility of domestic inflation is high and the volatility of the real exchange rate is low. Thus, in countries where the mon-etary authority has not established a credible reputation for pursuing price stability banks may prefer to make FX loans. As memories of bouts of (hyper)inflation are persistent, high inflation may lead to the entrenched use of FX even when econo-mies stabilize (Kokenyne et al., 2010).
Cross-country comparisons of aggregate credit indeed document a strong role for monetary conditions in explaining the use of foreign currency in emerging economies. Most recently, Luca and Petrova (2008) analyse the aggregate share of FX loans for 21 transition countries of Eastern Europe and the former Soviet Union between 1990 and 2003. They find that the aggregate share of FX loans is positively related to interest rate differentials and domestic monetary volatility and negatively related to the volatility of the exchange rate. Work by Arteta (2005) on a broad sample of low-income countries, as well as Barajas and Morales (2003) and Kamil (2009) on Latin America, confirms the hypothesis that higher exchange rate volatility reduces credit dollarization.
Firm-level studies find more mixed results concerning the impact of monetary conditions on the currency composition of firm debt. Keloharju and Niskanen (2001) and Allayanis et al. (2003) find that the use of FX debt by corporate firms is strongly related to interest rate differentials. Brown et al. (2011) by contrast find only a weak impact of interest rate differentials and no impact of exchange rate volatility on the use of FX loans among small firms in transition economies.
2.3. Bank ownership and client structure
A bank’s propensity to lend in FX also reflects the demand it encounters for FX loans from its clients. This means that to the extent that foreign and domestic banks serve different types of clients they may also face a different demand for FX denominated loans. Goswami and Shrikande (2001) show theoretically how firms may use foreign currency debt as a hedging instrument for the exchange rate exposure
of their revenues.2 Cowan (2006) and Brown et al. (2009b) consider firms’ choices
of loan currency in models where the cost of foreign currency debt is lower than the cost of local currency debt. Cowan (2006) shows that firms are more likely to choose foreign currency debt the higher the interest rate differential, the larger their share of income in foreign currency and the lower their distress costs in case of default. The incentive to take foreign currency loans is weaker when the volatility
2
The model assumes uncovered interest rate parity, i.e. differences in nominal interest rates are cancelled out by changes in the exchange rate so that the cost of foreign and local currency borrowing is identical. In such a model interest rate differen-tials do not motivate foreign currency borrowing. However, evidence suggests that this parity does not hold for many curren-cies (Froot and Thaler, 1990; Isard, 2006).
of the exchange rate is higher, as this increases the default risk on unhedged loans. Brown et al. (2009b) show that not only firms with foreign currency income, but also firms with high income in local currency (compared to their debt service bur-den) are more likely to choose foreign currency loans, as their probability to default due to exchange rate movements is lower. They also examine the impact of bank-firm information asymmetries on loan currency choice, showing that when lenders are imperfectly informed about the currency or level of firm revenue, local currency
borrowers may be more likely to choose foreign currency loans.3 While focused on
commercial loans, the models of Cowan (2006) and Brown et al. (2009b) are also relevant for FX lending to households. They predict that households with assets denominated in foreign currency, such as real estate in many countries, as well as households with FX income or high income to debt service levels are more likely to borrow in foreign currency.
A broad set of studies confirm that the use of FX debt is related to borrower char-acteristics, in particular borrower income structure. Large firms have been shown to match loan currencies to those of their sales in the US (Kedia and Mozumdar, 2003), Europe (Keloharju and Niskanen, 2001), Latin America (Martinez and Werner, 2002; Gelos, 2003; and Benavente et al., 2003) and East Asia (Allayannis et al., 2003).
More recent evidence suggests that the use of a foreign rather than a local cur-rency loan by retail clients is also strongly related to borrower characteristics. Brown et al. (2011) examine the currency denomination of the most recent loan received by 3,105 small firms in 24 transition countries. They find strong evidence that the choice of an FX loan is related to FX cash flow. In contrast, they find only weak evidence that FX borrowing is affected by firm-level distress costs or financial opaqueness. Brown et al. (2010) examine requested and granted loan currencies using credit-file data for over 100,000 loans to small firms in Bulgaria. They show that firms with revenue in foreign currency, lower leverage and lower distress costs are more likely to ask for an FX loan, and are more likely to receive such a loan. Beer et al. (2010) examine survey data covering over 2,500 Austrian households and find that those households with higher wealth, higher income and better education are more likely to have foreign currency (CHF) rather than local currency (EUR) mortgages. Fidrmuc et al. (2011) show that the intention of households to take FX loans in Eastern Europe is related to household age, education and savings in FX. Finally, Degryse et al. (2011) provide evidence that suggests that FX lending in Poland is related to bank ownership. Examining a dataset on Polish banks for the period 1996–2006 they find that in particular greenfield foreign banks provide more FX loans than domestic banks.
3
Banks may not be able to verify the income sources of small firms which do not keep detailed and audited financial records (Berger and Udell, 1998). This information asymmetry may be particularly pressing in countries with weak corporate governance (Brown et al., 2009a) and a strong presence of foreign banks which have less knowledge about local firms (Detragiache et al., 2008).
This paper contributes to the empirical literature on foreign currency lending and borrowing by providing bank-level evidence on how FX lending is impacted by banks’ funding structure, sensitivity to the macroeconomic environment, and ownership structure. We use our dataset to test three main hypotheses: (i) Access to FX denominated wholesale and deposit funding has a positive impact on FX lend-ing; (ii) Banks are more likely to lend in FX in countries with unstable macro economic conditions, and (iii) Foreign ownership has an independent positive impact on banks’ proportion and quantity of FX lending, e.g. because foreign banks are more likely to attract clients with a demand for currency hedging.
By testing these hypotheses with bank-level data for a broad set of transition economies, we provide micro-evidence on FX lending to both firms and households and complement cross-country studies of aggregate FX lending such as Luca and Petrova (2008) and Basso et al. (2010), firm-level and household-level studies such as Brown et al. (2011) and Fidrmuc et al. (2011), as well as bank-level studies for indi-vidual countries such as Brown et al. (2010) and Degryse et al. (2011).
3. DATA
3.1. The Banking Environment and Performance Survey (BEPS)
Our main data source is the EBRD Banking Environment and Performance Survey (BEPS) conducted in 2005 across 20 transition countries. The BEPS elicits detailed information on the loan and deposit structure, including the currency denomina-tion, of a large number of banks in 2001 and 2004. Information was also collected on banks’ risk management and their assessment of creditor rights and banking reg-ulation. BEPS further provides detailed information on bank ownership, which allows us to differentiate between three ownership categories: banks with majority domestic ownership, newly created foreign banks (greenfields), and privatized banks with majority foreign ownership (takeovers).
From the 1,976 banks operating in the transition region in 2005 the EBRD approached the 419 banks which were covered by Bureau van Dijk’s BankScope database. These banks represent more than three-quarters of all banking assets in the transition region. Of these banks 220 agreed to participate in the BEPS. There are only small differences between banks that agreed to participate in BEPS and those that declined. De Haas et al. (2010) provide a detailed description of the BEPS and how it provides a representative picture of the underlying banking popu-lation in emerging Europe in terms of bank size and bank ownership. Both in BankScope and in BEPS 7% of the banks are state-owned and while in BankScope 47% of all banks are foreign owned, in BEPS 55% are foreign owned. Finally, while in BankScope 45% of all banks are private domestic banks, 38% of all banks in BEPS belong to this category. There is only a weak relationship between bank size and inclusion in BEPS.
The dataset we use in this paper excludes 27 banks for which information on the currency composition of loans was not available. We thus have a sample of 193 banks from 20 countries, of which 98 are domestic banks (private or state-owned), 44 greenfield foreign banks, and 51 are foreign banks that are the result of a take-over of a former domestic bank. Table 1 shows the geographical distribution of these banks over the transition region. The sample is evenly distributed over the three main sub-regions: Central Europe and the Baltic countries (62 banks), South Eastern Europe (72 banks), and the Commonwealth of Independent States (CIS) (59 banks). In terms of ownership, our sample also reflects that the banking sector in the CIS has seen less foreign direct investment compared to the other parts of the transition region.
From the BEPS we yield four indicators of bank-level foreign currency lending as our dependent variables: FX share corporates is the share of a bank’s outstanding loan portfolio to firms which is FX denominated. Likewise, FX share households is the share of the outstanding loan portfolio to households denominated in FX. We
Table 1. Bank ownership by country
Total Foreign greenfield Foreign takeover Domestic Foreign acquired
Central Europe and Baltics (CEB) 62 15 26 21 15
Czech Republic 7 0 4 3 3 Estonia 5 0 4 1 1 Hungary 3 3 0 0 0 Latvia 16 1 6 9 2 Lithuania 5 0 3 2 2 Poland 13 7 4 2 3 Slovak Republic 6 3 3 0 2 Slovenia 7 1 2 4 2
South Eastern Europe (SEE) 72 22 22 28 13
Albania 4 3 1 1 Bosnia 11 3 4 4 2 Bulgaria 11 3 6 2 5 Croatia 11 4 1 6 1 Macedonia 6 0 2 4 2 Romania 11 5 5 1 2 Serbia 18 4 3 11 0 Commonwealth of Independent States (CIS) 59 7 3 49 0 Belarus 9 1 2 6 0 Kazakhstan 7 0 0 7 0 Moldova 8 0 1 7 0 Russia 27 3 0 24 0 Ukraine 8 3 0 5 0 Total 193 44 51 98 28
Note: The table reports the number of banks in our sample by country and ownership type. Foreign greenfield banks are foreign banks established from scratch, whereas Foreign takeover banks are foreign banks that are the result of a takeover of a domestic bank by a foreign strategic investor. Foreign acquired banks are takeover banks that were acquired in 2000, 2001 or 2002. Table 2 provides definitions and sources of all variables.
measure both of these variables in 2004 and 2001 and use the 2004 values in our cross-sectional analysis and the 2004–2001 differences in our panel analysis. In our panel analysis we further employ two variables – FX growth corporates and FX growth households – that measure the growth of the volume of FX loans over 2001–2004.
Figure 1 depicts the 2001 and 2004 values for FX share corporates and FX share households for each of the 193 banks in our dataset. It shows a strong correlation between the 2001 and 2004 proportion of corporate lending in FX. By contrast, during this period many banks experienced stronger changes in the currency denomination of their household loan portfolio. On average, the share of FX loans to households in our sample increased from 28% in 2001 to 38% in 2004. How-ever, as Figure 1 shows, these averages mask substantial heterogeneity in the development of household lending across banks.
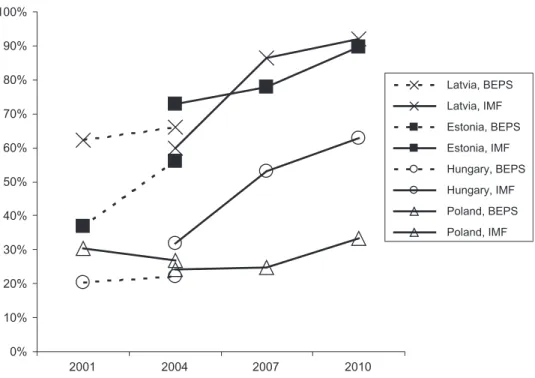
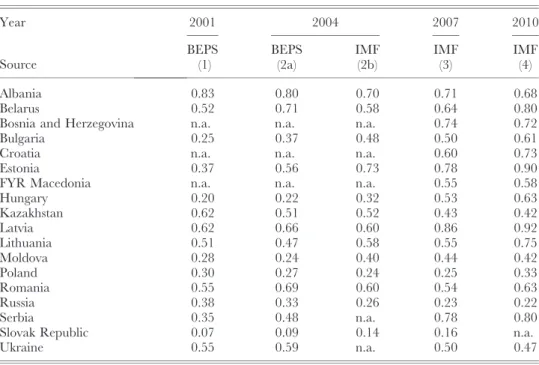
While dynamics in FX lending continued after our sample period ended, we think that the period 2001–2004 – that is, the first half of the 2001–2007 credit boom in many parts of emerging Europe – is well-suited to study the determinants of FX lending as it set the scene for later developments. Table A1 in the Appendix displays country-level data on FX lending. It shows that in many countries the FX lending dynamics that took place during 2001–2004 continued during the later years. For instance, our data pick up both the trend towards more FX lending in
0 20 40 60 80 100 FX share corporates 2004 (%) 0 20 40 60 80 100 FX share corporates 2001 (%) Corporate loans 0 20 40 60 80 100 FX share households 2004 (%) 0 20 40 60 80 100 FX share households 2001 (%) Household loans
Figure 1. FX lending in 2001 and 2004
Note: This figure plots the 2001 values against the 2004 values for the variables FX share corporates and FX share households. Table 2 provides definitions and sources of all variables.
Bulgaria, Estonia, Latvia and Serbia and the trend towards less FX lending in Albania, Kazakhstan and Russia. Indeed, the overall cross-country correlation between FX lending in 2004 and 2007 is very high at 0.79 and between 2007 and 2010 even 0.94.
3.2. Explanatory variables
Table 2 provides a description and the source of all variables we use in our empiri-cal analysis. We construct bank ownership dummies that indicate whether a bank is a Foreign greenfield bank, a Foreign takeover bank, or a Domestic bank in 2004. Informa-tion to construct these dummies is taken from BEPS and where needed supple-mented with information from banks’ websites. We also create a variable Foreign held which is 1 for all banks that were foreign-owned throughout 2000–2004 and 0 for all banks that were domestically owned throughout this period. Finally, we construct a dummy Foreign acquired that identifies banks acquired in 2000, 2001 or 2002.
We use two indicators of the funding structure of a bank. FX deposits is taken from BEPS and directly captures the share of customer deposits which are FX denominated. Wholesale funding is taken from BankScope and captures non-customer liabilities as a share of total liabilities. We employ this variable as an indicator of wholesale funding in foreign currency. We think this is a reasonable assumption as much of the transition region remains characterized by very underdeveloped local currency bond and money markets (EBRD, 2010). As a result, banks find it difficult if not impossible to supplement their (mainly short-term) domestic deposit base with longer-term local-currency liabilities. Wholesale funding therefore tends to be FX denominated, as (the more reputable) banks attract FX debt in the international capital markets or, in the case of foreign bank subsidiaries, from their parent banks. De Haas and Naaborg (2006) show how centralized Treasuries operated by multi-national banks such as SEB, Erste Bank, ING Bank and ABN Amro Bank form the main source of non-deposit funding for the subsidiaries of these banks in emerging Europe.
Both our measures of bank funding may be endogenous to FX lending. In our cross-sectional analysis we therefore add a specification in which we instrument both. Our instrument for Wholesale funding is the variable Internal ratings which indic-ates whether the bank used an internal ratings based approach in 2004. Banks that use such an approach tend to be relatively sophisticated and in a better position to attract wholesale funding. Our instrument for FX deposits is the variable Corporate deposits which measures the share of customer deposits from firms. FX deposits may be directly related to a bank’s focus on corporate clients as (exporting) firms tend to have more access to FX and deposit this at their bank. Section 4.1 provides details on our instrumentation strategy.
At the bank-level we control for bank size with the variable Assets which meas-ures total bank assets in log USD. This indicator is taken from BankScope and is a
Table 2. Variable descriptions Variable name Periodicity Description Source Bank-level data (No. of banks = 193) FX share corporates 2001, 2004 Share of FX loans in all loans to corporations (%) BEPS FX share households 2001, 2004 Share of FX loans in all loans to households (%) BEPS FX growth corporates 2004 Growth of the volume of FX loans to corporations 2004 minus 2001 (%) BEPS FX growth households 2004 Growth of the volume of FX loans to households 2004 minus 2001 (%) BEPS Foreign greenfield 2004 1= bank is a newly established ‘greenfield’ foreign bank, 0 = otherwise BEPS, websites Foreign takeover 2004 1= bank is a foreign bank resulting from a take-over, 0 = otherwise BEPS, websites Domestic 2004 1= bank is domestically owned, 0 = otherwise BEPS, websites Foreign held 2000 – 2004 1= if bank was foreign owned from 2000 – 2004, 0 = bank was domestically owned from 2000 – 2004. BEPS, websites Foreign acquired 2000 – 2004 1= domestic bank was acquired by a foreign investor in 2000, 2001 or 2002, 0 = domestic bank was not acquired in the period 2000 – 2004. BEPS, websites Assets 2001, 2004 Total assets (in log US dollars) BankScope Wholesale funding 2001, 2004 Non-customer liabilities as a share of total bank liabilities (%) BankScope FX deposits 2001, 2004 Share of FX denominated customer deposits in all customer deposits (%) BEPS Corporate deposits 2004 Share of customer deposits from corporates (%) BEPS Internal ratings 2004 Bank uses internal ratings approach for credit risk assessment (yes = 1 , n o = 0) BEPS Country-level data (# countries = 20) Interest differential 2001 – 2004 Domestic Tbill or money market rate minus Eurepo rate (% p.a.) IMF-IFS Exrate volatility 2001 – 2004 Coefficient of variation of monthly changes in nominal exchange rate to the euro (%) IMF-IFS Interest advantage 2001 – 2004 Interest differential /(1 + Exrate volatility ) IMF-IFS Inflation history 1994 – 2003 Mean annual CPI inflation rate over the period 1994 – 2003 EBRD-TR EU accession 2001 – 2004 EU accession negotiations completed (yes=1, no=0) EBRD-TR Note : This table presents definitions and sources of all variables used in our empirical analysis. BEPS is the EBRD Banking Environment and Performance Sur vey conducted in 2005. BankScope is Bureau van Dijk’s BankScope database of bank balance sheet and income statement data. EBRD-TR is the EBRD Transition Report 2004 . IMF-IFS are the International Financial Statistics provided by the International Monetary Fund.
measure of both client structure and bank-funding structure. On the one hand, lar-ger banks are more likely to serve large firms, which may have a higher demand for FX debt. On the other hand, larger banks may have better access to cross-border wholesale funding.
In our empirical analysis we alternatively employ country fixed effects and country-level explanatory variables to account for cross-country variation in macro-economic conditions. Our country-level explanatory variables are taken from the EBRD Transition Report and the IMF International Financial Statistics. Interest differential is the difference between reference interest rates on the domestic currency and the euro. Exrate volatility captures the variation of month-on-month changes in the nominal exchange rate of the domestic currency to the euro. Interest advantage combines the preceding two variables into one summary measure of the relative advantage of borrowing in a foreign currency. It divides Interest differential by the Exrate volatility (plus 1) and can be seen as a reward-to-variability or Sharpe ratio that measures the benefit of borrowing in euro, rather than in the local currency, per unit of exchange rate risk.
Besides the above measures of contemporary monetary conditions we attempt to control for past and future macroeconomic stability which may affect FX lend-ing. Inflation history measures the mean annual inflation rate over the preceding period 1994–2003. Lastly, we create a variable EU accession which indicates for each country and year in the 2001–2004 period whether a country had com-pleted EU accession negotiations. This yearly score is then averaged over the sample period.
3.3. Descriptive statistics
Table 3 provides descriptive statistics for all our variables. Panel A reports sum-mary statistics for the full sample as well as means by bank-ownership and region. Panel B shows summary statistics for our country-level variables. Table A2 in the Appendix provides a matrix of pair-wise correlations. Table 3 shows that in 2004, 44% of all corporate lending and 38% of all household lending by the banks in our sample was denominated in FX. Differences in the share of FX lending are sub-stantial across banks, with some banks displaying no FX loans while other banks have their entire loan portfolio in FX. Between 2001 and 2004 there was an average increase of 3 and 10 percentage points, respectively, in the proportion of corporate and household loans denominated in FX.
The table confirms that foreign banks lend more in FX. However, there is a marked difference between lending to firms and to households. For corporate clients we see that in 2004 both greenfield and takeover foreign banks display a higher share of FX lending than domestic banks. Interestingly, the share of FX loans to firms by takeover banks converges to that of greenfield banks between 2001 and 2004, while FX lending by domestic banks to firms did not increase. For
household loans we find that the share of FX lending increased strongly for all ownership types. In contrast to corporate lending, we also find that in 2004 the share of household loans in FX is similar for foreign takeover banks and domestic
Table 3. Descriptive statistics
Panel A. Bank-level variables
Variable name Full sample summary statistics Means by bank-ownership Means by region
Obs Mean Std. Dev. Min Max Green
field Take
over Domestic CEB SEE CIS
Cross-sectional analysis: 2004 FX share corporates 179 44.0 28.9 0 100 51.3 50.4 37.6 44.6 45.2 42.0 FX share households 174 38.0 36.1 0 100 45.7 36.1 35.5 32.0 36.1 46.1 Assets 187 20.0 1.6 16 24.1 20.1 20.7 19.7 20.9 19.5 19.8 Wholesale funding 187 31.9 22.2 1 99 44.0 28.6 27.8 34.4 27.8 34.0 FX deposits 176 41.7 23.6 0 99 43.0 37.2 43.4 34.9 49.3 39.8 Corporate deposits 177 45.1 24.7 0 100 49.5 39.0 46.1 43.4 43.2 49.4 Internal ratings 178 0.80 0.40 0 1 0.80 0.84 0.78 0.74 0.79 0.89
Panel analysis: 2004 minus 2001 FX share corporates 166 2.5 20.4 )54 98 0.7 10.0 )0.1 5.3 4.2 )2.1 FX share households 158 9.8 32.4 )95 100 11.5 9.6 9.2 3.2 10.9 15.3 FX growth corporates 127 6.7 26.1 )1 270 12.6 8.2 3.1 3.6 14.0 3.2 FX growth households 77 4.7 5.9 )1 33 4.1 6.1 4.2 4.0 5.4 5.0 Assets 155 1.0 0.5 )0.7 2.9 1.1 1.0 1.0 1.0 1.0 1.1 Wholesale funding 155 3.0 15.3 )42 50 4.5 5.4 0.9 4.1 4.0 0.6 FX deposits 167 )4.1 16.0 )52 62 )3.4 )2.1 )5.5 )2.4 )4.2 )5.9
Panel B. Country-level variables
Variable name
Full sample summary statistics Means by region
Obs Mean Std. Dev. Min Max CEB SEE CIS
Country-level variables: 2001–2004 averages
Interest differential 20 6.9 9.2 0.4 37.4 2.9 7.8 12.0
Exrate volatility 20 2.8 2.1 0.0 8.0 2.1 1.8 5.2
Interest advantage 20 1.7 1.5 0.1 4.8 0.9 2.5 1.6
Inflation history 20 60 93 2 371 11 42 165
EU accession 20 0.2 0.3 0 0.5 0.5 0 0
Note: This table provides summary statistics for the 2004 values and 2004–2001 differences of our bank-level and country-level variables. Region definitions CEB, SEE and CIS are in accordance with those listed in Table 1. Table 2 provides variable definitions and sources.
banks with both bank types displaying a lower level of FX loans than foreign
green-field banks.4
Looking at banks’ funding structure, we find that on average 32% of total liabil-ities is Wholesale funding, while 42% of bank deposits are denominated in FX. Green-field foreign banks rely much more on wholesale funding (44%) compared to foreign takeover banks (29%) or domestic banks (28%). By contrast, the foreign cur-rency share of deposits is similar for all bank types, indicating that the ‘euroization’ of deposits is mostly driven by the macroeconomic environment. Interestingly, dur-ing 2001–2004 the share of FX deposits in total deposits declined by about four percentage points.
To what extent is FX lending by the banks in our sample related to their funding structure? The scatter plots in Figure 2 provide some first insights into this issue. The figure shows no apparent bivariate relationship between the proportion of wholesale funding and FX lending. By contrast, banks with a large share of FX denominated customer deposits lend more in FX. In line with this, Table A2 in the Appendix shows that whereas the pair-wise correlation between wholesale funding
R2= 0.02 0 20 40 60 80 100 FX share corporates (%) 0 20 40 60 80 100 Wholesale funding (%) R2= 0.24 0 20 40 60 80 100 FX share corporates (%) 0 20 40 60 80 100 FX deposits (%) R2= 0.03 0 20 40 60 80 100 FX share households (%) 0 20 40 60 80 100 Wholesale funding (%) R2= 0.18 0 20 40 60 80 100 FX share households (%) 0 20 40 60 80 100 FX deposits (%) Figure 2. FX lending and bank funding in 2004
Note: This figure plots FX share corporates and FX share households against Wholesale funding and FX deposits. All data refer to 2004. For comparability with Figure 1 we include only banks with observations for FX share corporates and FX share households in 2004 and 2001. Table 2 provides definitions and sources of all variables.
4
and corporate and household FX lending is only 0.16 (p = 0.04) and 0.13 (p = 0.09), respectively, the correlations between the proportion of FX deposits and both types of FX lending are 0.44 (p = 0.00) and 0.43 (p = 0.00). This is in line with findings by Brown et al. (2010) and Fidrmuc et al. (2011) on the importance of FX deposits for FX lending.
4. MULTIVARIATE RESULTS
The cross-sectional and panel analyses in this section examine to what extent there is a causal relationship between foreign ownership, bank funding and FX lending.
4.1. Cross-sectional variation in FX lending
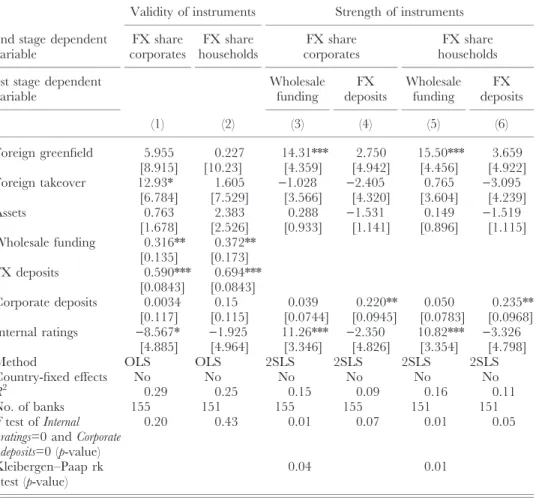
Table 4 provides a cross-sectional analysis of banks’ share of FX lending to corpor-ate clients (left-hand panel) and households (right-hand panel) in 2004. In line with the hypotheses developed in Section 2, we analyse the impact of bank ownership, bank funding and the macroeconomic environment. The first column in each panel displays an OLS specification in which the share of FX lending is explained by bank ownership, bank funding and bank size.
In Columns 2 and 7 we account for the endogeneity of a bank’s funding struc-ture by instrumenting our variables Wholesale funding and FX deposits with Internal rating and Corporate deposits, respectively. Our analysis suggests that the chosen instruments are valid, strong and span our endogenous regressors. When we run second-stage regressions where we add these instruments as additional regressors they do not have an independent impact on FX lending, suggesting that the instruments are valid. Our instruments are highly correlated with the endogenous regressors in the first-stage regressions and thus relatively strong. Finally, the reported Kleibergen– Paap statistics show that our regression specification is not underidentified. Table A3 in the Appendix reports the first-stage results of our instrumental variable analysis.
In Columns 3–4 and 8–9 we add to this IV specification country-level indicators of the macroeconomic environment. Finally, in Columns 5 and 10 we interact these macroeconomic indicators with foreign bank ownership to examine whether foreign banks react differently to contemporaneous monetary conditions and long-term
macroeconomic stability.5 As these two specifications also contain country fixed
effects, we do not include the macroeconomic indicators as stand-alone variables but only when interacted with the bank-ownership variables.
5
Since some banks provide no FX loans at all, we also ran models where we first estimate a probit regression and then a conditional OLS. This yields similar results to the unconditional OLS results reported in Table 4. The same holds when we estimate Tobit regressions. Note that the proportion of FX lending is naturally bound between 0 and 100 and not truly cen-sored, which makes OLS a more appropriate estimation technique than Tobit regressions.
Table 4. FX lending in 2004 Dependent variable FX share corporates FX share households Model (1) (2) (3) (4) (5) (6) (7) (8) (9) (10) Foreign greenfield 0.982 16.010 17.18* 17.71* 16.680 0.909 ) 2.370 6.139 2.801 ) 15.980 [8.907] [9.839] [10.35] [10.24] [16.27] [9.954] [10.99] [10.55] [10.50] [20.87] Foreign takeover 7.423 12.53** 12.73** 12.02** 15.550 1.224 3.559 11.000 5.832 ) 8.570 [7.562] [6.248] [6.282] [5.749] [13.40] [7.749] [9.062] [8.412] [8.136] [15.30] Assets 1.236 1.196 0.055 0.057 1.288 2.107 3.346 1.760 2.366 1.931 [2.221] [1.712] [1.704] [1.690] [2.289] [2.546] [2.113] [1.950] [1.857] [2.852] Wholesale funding 0.382** ) 0.415 ) 0.365 ) 0.363 0.100 0.378** 0.390 0.207 0.334 0.442 [0.143] [0.485] [0.467] [0.464] [0.504] [0.161] [0.558] [0.483] [0.494] [0.672] FX deposits 0.456*** 0.735* 0.512 0.489 0.183 0.735*** 1.329*** 1.096*** 1.071*** 0.895 [0.119] [0.435] [0.390] [0.401] [0.605] [0.0713] [0.471] [0.362] [0.370] [0.636] Interest differential 0.365 ) 0.422 [0.408] [0.461] Exrate volatility 1.177 7.069*** [1.837] [2.302] Interest advantage 1.219 ) 0.961 [1.619] [1.896] Inflation history 0.0602* 0.0989*** 0.045 0.119*** [0.0337] [0.0280] [0.0423] [0.0313] EU accession 20.21* 22.18* 7.121 7.103 [11.86] [12.14] [14.18] [15.17] Foreign*Interest advantage ) 5.367 5.549 [5.106] [4.821] Foreign*Inflation history 0.103 ) 0.057 [0.0643] [0.0668]
Table 4. (Continued) Dependent variable FX share corporates FX share households Model (1) (2) (3) (4) (5) (6) (7) (8) (9) (10) Foreign*EU accession ) 12.740 30.280 [33.21] [35.60] Method OLS IV IV IV IV OLS IV IV IV IV Country-fixed effects No No No No Yes No No No No Yes R 2 0.53 0.06 0.20 0.18 0.50 0.24 0.11 0.33 0.27 0.53 No. of banks 155 155 155 155 155 151 151 151 151 151 No. of countries 20 20 20 20 20 20 20 20 20 20 Notes : In this table the dependent variables are FX share corporates and FX share households in 2004. Models 1 and 6 report OLS estimates in which standard errors are adjusted for clustering by country. Models 2 –5 and 7 – 10 report IV estimates with robust standard errors in which Wholesale funding and FX deposits are instrumented with the variables Internal ratings and Corporate deposits . Models 5 and 10 include country-fixed effects. Standard errors are reported in brackets. ***, **, * denote significance at the 0.01, 0.05 and 0.10 level. Table 2 provides the definitions and sources of all variables. Table A3 in the Appendix provides diagnostic tests related to the instrumentation strat egy.
Table 4 displays four key findings. First, foreign ownership is associated with a higher share of FX loans to firms but not to households. Columns 2–4 show that greenfield (takeover) foreign banks lend 17 (12) percentage points more in FX than domestic banks. In sharp contrast, bank ownership does not impact FX lending to households. Why do foreign banks lend more in FX to firms but not to households? One reason may be that households are a relatively homogenous borrower group whereas firms are more diverse. Foreign banks may serve a different set of corpor-ate clients with a higher demand for FX loans, for instance because they are larger and better diversified or because they have FX revenues that need to be hedged. Indeed, the BEPS data indicate that foreign banks lend significantly more to subsidiaries of international firms than domestic banks (see also De Haas et al. 2010).
Our second finding is that Wholesale funding of banks seems to be a result rather than a determinant of FX lending. The coefficients in Columns 1 and 6 suggest that there is a relation between wholesale funding and FX lending. However, once we account for the endogeneity of wholesale funding (by instrumenting it with Internal rating) its coefficient is no longer significant at any conventional level.
Our third finding is that there does seem to be a causal impact of foreign denominated customer deposits on FX lending. The coefficients reported in Columns 1 and 6, respectively, suggest that a 10 percentage point increase in FX deposits by customers increases the share of FX loans to firms by 5% and to house-holds by 7%. Not surprisingly, the impact on FX share corporates loses statistical and economic significance once we account for the potential endogeneity of deposits. This indicates that FX deposits is partially endogenous, as FX lending to (inter-national) firms and access to FX deposits by these firms is determined simultaneously.
Interestingly, and in line with this interpretation, the same instrumentation strat-egy does not reduce the significance of FX deposits in the right-hand panel. In the case of lending to households, access to FX deposits is exogenous and has a causal impact on FX lending to retail clients. Note, however, that the coefficient becomes insignificant once we include country fixed effects in Column 10. Our result is thus mainly driven by country variation in FX deposits rather than between-bank variation in access to FX deposits within countries. The impact of FX denom-inated customer deposits on the share of FX lending to households confirms recent findings by Brown et al. (2010) and Luca and Petrova (2008).
Our fourth finding is that long-term macroeconomic conditions rather than con-temporaneous monetary conditions affect FX lending. In particular, we find that banks in countries with a history of high inflation (over the period 1994–2003) show a higher proportion of FX lending. This may suggest that in countries with ‘infla-tion traumas’ banks are more reluctant to lend in local currency. An alternative explanation is that FX lending is related to a history of real appreciation of the local currency. Our data show that in emerging Europe high levels of past inflation are associated with real appreciation of the local currency. Indeed, when we replace
the variable Past inflation in Table 4 with the variable Trend appreciation, which meas-ures the mean real appreciation of the local currency over the period 1994–2003, we find that FX lending is indeed higher in countries that have experienced trend appreciation in the past.
For FX lending to firms we also find that progress with EU accession, and the associated macroeconomic and institutional stabilization, had a positive effect on the proportion of FX lending. Progress towards EU accession may somewhat para-doxically have increased the incentives for denominating debt in FX as the ‘cer-tainty’ of a euro exit, and the expectation of nominal exchange rate stability during the convergence trajectory, made FX lending more attractive even when interest-rate differences came down at the same time. Indeed, in line with recent evidence by Brown et al. (2009), we find that neither interest-rate differentials nor nominal exchange-rate volatility is significantly related to FX lending. The main macro economic determinants seem to be past inflation and real appreciation as well as the expected stabilization of EU accession.
In Columns 5 and 10 we examine whether FX lending by foreign banks is more sensitive to the macroeconomic environment. Foreign banks may be more reluctant to lend in domestic currency if they mistrust macroeconomic policy more than domestic banks. We therefore interact our macroeconomic indicators with the dummy variable Foreign, which is 1 for greenfield and takeover foreign banks (while also including
country fixed effects).6Our results suggest that foreign banks are not significantly more
sensitive to the host-country macroeconomic environment than domestic banks. Throughout much of central and south-eastern Europe the euro has been the main currency used for FX lending and we have therefore calculated our variables Interest rate differential, Exrate volatility, and Interest advantage relative to euro interest and exchange rates. However, in a number of countries many FX loans are
denomin-ated in either the Swiss franc (Hungary and Poland)7 or the US dollar (Belarus,
Kazakhstan, Moldova, Russia and Ukraine). As a robustness test we therefore ran the regressions in Table 4 while replacing the exchange rate of the local currency vis-a`-vis the euro with the exchange rate vis-a`-vis the Swiss franc or the US dollar for the countries mentioned above. Our results remain virtually unchanged in terms of economic and statistical significance, reflecting the co-movement of these foreign currencies relative to the currencies of emerging Europe during 2001–2004.
As the BEPS survey does not cover all bank types in all countries, the effects of foreign bank-ownership indentified in Table 4 may simply be capturing omitted cross-country differences in financial sector, economic or institutional conditions. To assess whether we are mixing ownership effects with country effects we run
6
We do not distinguish between greenfield and takeover foreign banks here because unreported regression results show no significant differences in the interaction effects between these two types of foreign banks.
7
Brown et al. (2009c) show that Poland and Hungary are the only two transition economies with a significant share of for-eign currency loans denominated in Swiss francs.
robustness tests where we exclude those countries for which we only have informa-tion on one type of bank. In further robustness tests we also control for whether the bank is a member of a multinational bank network, as well as for additional characteristics (mean loan size, share of real-estate loans) of the loan portfolio held by each bank. Each of these robustness tests confirms our cross-sectional finding that foreign bank ownership is associated with more FX lending to corporates (but not to households).
Summing up, our cross-sectional results contradict widespread views concerning for-eign bank ownership, bank funding and FX lending. First, we find that forfor-eign banks lend more in FX to corporate clients but not to retail clients. Second, we find only a very weak relationship between wholesale funding and FX lending, with the former being a result, rather than a determinant of the latter. These results are remarkable as they run counter to the view that foreign banks, using cheap funding from abroad, have been ‘pushing’ FX loans into the hands of unsuspecting retail borrowers.
We further find that long-term macroeconomic stability (past inflation/trend appreciation and EU accession) rather than contemporaneous monetary conditions are associated with persistently high shares of FX lending by both domestic and for-eign banks. Indirectly, the macroeconomic environment may play an important role as well. We find that between countries – but not so much within countries – a higher proportion of FX deposits is linked to higher proportions of FX lending, in particular to households. As shown by De Nicolo et al. (2005) the macroeconomic environment is a key driver of deposit dollarization.
4.2. Foreign ownership and changes in banks’ FX lending over time
It is difficult to establish a causal relationship between bank ownership or funding and FX lending from our cross-sectional results alone. First, the observed impact of customer funding may be driven by omitted bank characteristics, for example customers with income in FX, which affect both FX deposits and FX lending. Sec-ond, the observed impact of (long-term) macroeconomic instability may be driven by unobserved country characteristics, for example institutional weaknesses which may be correlated with both weak macroeconomic policies and the absence of (exporting) firms which demand FX loans. Third, the observed relation between foreign bank ownership and FX lending to corporate clients may be due to reverse causality. For-eign banks may be more likely to enter countries where there are more clients with a demand for financial services in foreign currency, that is, countries with more export-oriented firms or a real estate market that is denominated in euro. Foreign institutions may also be more likely to take over domestic banks that already have a
clientele that use financial services in foreign currency.8 In this section, we try to
8
For foreign banks like ABN Amro, Bank Austria and Raiffeisen, serving foreign firms – in particular home-country clients – has been an important part of their expansion strategy into emerging Europe (De Haas and Naaborg, 2006).
mitigate concerns about omitted variables and reverse causality by looking at changes in banks’ FX lending between 2001 and 2004, controlling for time-invariant bank characteristics and changes in the macroeconomic environment.
In Table 5 we control for omitted bank-level variables by running first-difference regressions using a sub-sample of banks that did not change their ownership during 2000–2004. We examine changes in the share and the volume of FX lending between 2001 and 2004. The dependent variables in the left-hand side panel are the
percent-age-point change in FX share corporate/households between 2001 and 2004.9The
depen-dent variables in the right-hand side panel are FX growth corporates/
households, that is, the percentage-point change in the volume of FX lending to these clients. Likewise all independent variables – with the obvious exception of the Foreign held dummy – are expressed in changes as well. We control for changes in country specific monetary conditions with country fixed effects. The results presented in Table 5 suggest that foreign bank ownership did not impact the change in either the share or the volume of FX lending to firms or households.
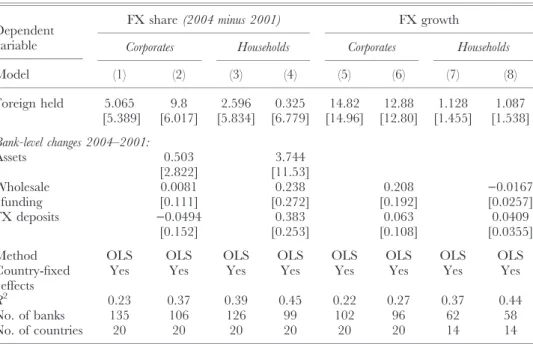
Table 5. Foreign ownership and changes in FX lending (2001–2004)
Dependent variable
FX share (2004 minus 2001) FX growth
Corporates Households Corporates Households
Model (1) (2) (3) (4) (5) (6) (7) (8) Foreign held 5.065 9.8 2.596 0.325 14.82 12.88 1.128 1.087 [5.389] [6.017] [5.834] [6.779] [14.96] [12.80] [1.455] [1.538] Bank-level changes 2004–2001: Assets 0.503 3.744 [2.822] [11.53] Wholesale funding 0.0081 0.238 0.208 )0.0167 [0.111] [0.272] [0.192] [0.0257] FX deposits )0.0494 0.383 0.063 0.0409 [0.152] [0.253] [0.108] [0.0355]
Method OLS OLS OLS OLS OLS OLS OLS OLS
Country-fixed effects
Yes Yes Yes Yes Yes Yes Yes Yes
R2 0.23 0.37 0.39 0.45 0.22 0.27 0.37 0.44
No. of banks 135 106 126 99 102 96 62 58
No. of countries 20 20 20 20 20 20 14 14
Notes: In this table we examine the sample of banks that were either domestically owned or foreign owned during the entire period 2000–2004 and which report data on FX lending for 2001 and 2004. The dependent variables are the percentage point changes (2004 minus 2001) in either the share of FX lending (Columns 1–4) or in the amount of FX lending (Columns 5–8). All models report OLS estimates with country fixed effects. Standard errors are reported in brackets and are adjusted for clustering at the country level.
***, **, * denote significance at the 0.01, 0.05 and 0.10 level. Table 2 provides definitions and sources of all variables.
9
A number of banks change their proportion of FX lending very considerably between 2001 and 2004. We undertook a robustness test where we exclude extreme values in the dependent variables by trimming at the 5th and 95th percentile. This does not change our results.
4.3. Foreign acquisition and changes in banks’ FX lending over time
In Table 6 we control for reverse causality in the observed relationship between foreign bank ownership and FX lending by analysing whether the currency com-position of bank lending changes when a domestic bank is taken over by a foreign strategic investor. As in Table 5, the dependent variables are the percentage-point change in FX share corporates/households (left-hand side) and FX growth corporate/ households (right-hand side). To measure the impact of foreign acquisition we limit our sample to those banks which were domestically owned before 2000 and com-pare banks that remained domestically owned over 2000–2004 to those that were taken over by a foreign bank in 2000, 2001 or 2002. The latter are captured by
the dummy Foreign acquired.10
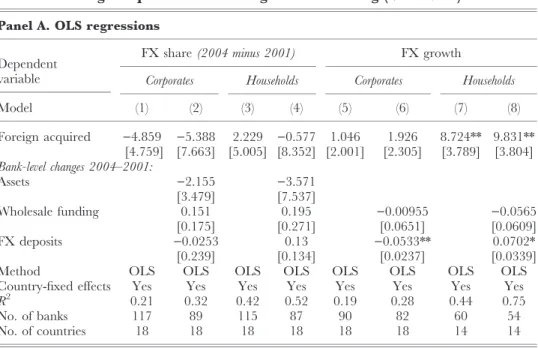
The results presented in Panel A of Table 6 suggest that there is no effect of for-eign acquisition on FX lending to corporates. The coefficients for Forfor-eign acquired in Columns 1–2 and 5–6 suggest that neither the share of bank lending in FX nor the growth of the FX loan volume to corporate clients differs between acquired and non-acquired banks.
The foreign acquisition of a domestic bank does, by contrast, impact FX lending to households. The results in Columns 7–8 suggest that after a take-over, acquired banks expand the volume of FX lending to households by almost 10 percentage points more than banks that remain in domestic hands. Interestingly though, the stronger increase in FX loan volume to households does not appear to be driven by an increase in the share of household loans extended in FX. The results displayed in Columns 3–4 suggest that foreign acquisition has no impact on FX share households. These results suggest that the main effect of foreign acquisition is to accelerate the growth of household lending by banks. This leads to a faster growth of FX loans to households, even though the share of FX loans in the household loan portfolio does not increase.
A concern with our analysis in Panel A of Table 6 is selection bias. Foreign insti-tutions choose to take over particular domestic banks. If our regressions omit indic-ators which are relevant for the takeover decision, and these indicindic-ators are positively correlated with initial FX lending, then we may underestimate the impact of foreign acquisition on the subsequent change in FX lending. In Table 6B we therefore report a propensity scoring exercise in which we attempt to mitigate potential selection bias by comparing banks that were taken over by a foreign bank
with similar banks that were not taken over (Rosenbaum and Rubin, 1983).11
10
Our definition of Foreign acquired implies that after a takeover in 2000, 2001 or 2002 there are four, three and two years, respectively, during which the integration into a multinational group may have influenced the FX lending of these banks. This should be enough time to pick up an effect of foreign ownership as the parent bank may in principle start providing its new subsidiary with intrabank funding as soon as the takeover is finalized.
11
See Havrylchyk and Jurzyk (2010) for a similar application to investigate the impact of foreign bank ownership on the per-formance and market power of acquired banks.
Table 6. Foreign acquisition and changes in FX lending (2001–2004)
Panel A. OLS regressions Dependent
variable
FX share (2004 minus 2001) FX growth
Corporates Households Corporates Households
Model (1) (2) (3) (4) (5) (6) (7) (8) Foreign acquired )4.859 )5.388 2.229 )0.577 1.046 1.926 8.724** 9.831** [4.759] [7.663] [5.005] [8.352] [2.001] [2.305] [3.789] [3.804] Bank-level changes 2004–2001: Assets )2.155 )3.571 [3.479] [7.537] Wholesale funding 0.151 0.195 )0.00955 )0.0565 [0.175] [0.271] [0.0651] [0.0609] FX deposits )0.0253 0.13 )0.0533** 0.0702* [0.239] [0.134] [0.0237] [0.0339]
Method OLS OLS OLS OLS OLS OLS OLS OLS
Country-fixed effects Yes Yes Yes Yes Yes Yes Yes Yes
R2 0.21 0.32 0.42 0.52 0.19 0.28 0.44 0.75
No. of banks 117 89 115 87 90 82 60 54
No. of countries 18 18 18 18 18 18 14 14
Notes: In this panel we compare the change in FX lending (2004 minus 2001) by domestic banks which were acquired in 2000, 2001 or 2002 to the change in FX lending by domestic banks that were not acquired. The dependent variables are percentage point changes in the share of FX lending (Columns 1–4) or the growth (2004 minus 2001) of FX volume in % (Columns 5–8). All models report OLS estimates with country-fixed effects. Standard errors are reported in brackets and are adjusted for clustering at the country level.
***, **, * denote significance at the 0.01, 0.05 and 0.10 level. Table 2 provides definitions and sources of all variables.
Panel B. Controlling for endogenous acquisition – Propensity score matching
Acquired Not acquired Difference S.E. t-stat
FX share (2004 minus 2001)
Corporates Unmatched 2.82 4.91 )2.09 5.29 )0.39
Nearest neighbour matching 2.28 8.37 )6.09 9.78 )0.62
Kernel matching 5.84 5.83 0.01 6.99 0.00
Households Unmatched 2.52 1.83 0.69 6.23 0.11
Nearest neighbour matching 3.02 5.71 )2.69 8.41 )0.32
Kernel matching 0.64 8.70 )8.06 9.46 )0.85
FX growth
Corporates Unmatched 4.96 3.71 1.25 1.51 0.83
Nearest neighbour matching 4.09 2.76 1.33 1.68 0.79
Kernel matching 5.63 3.69 1.95 2.16 0.9
Households Unmatched 9.64 3.29 6.35 2.14 2.96***
Nearest neighbour matching 9.64 3.38 6.26 3.23 1.94**
Kernel matching 9.64 3.39 6.25 3.22 1.94**
Notes: In this panel we compare the change in FX lending (2004 minus 2001) by domestic banks which were acquired in 2000, 2001 or 2002 to the change in FX lending by domestic banks that were not acquired. The propen-sity to be acquired is estimated as a function of the banks Asset volume (log USD, in 2000) and a set of country dum-mies. The table reports treatment effects based on unmatched comparisons as well as nearest neigbour matching (with a common support requirement) and kernel matching. ***, ** denote significance at the 0.01 and 0.05-level.
In a first step we run a probit regression on the sub-sample of domestic banks in 2000 in which the dependent variable is Foreign acquired. This probit regression yields a propensity score (the conditional probability of a bank being acquired given pre-acquisition characteristics) for each bank. As explanatory variables in the first-step regression we include bank size and country-fixed effects. We expect that acquiring banks are mainly interested in large banks, as they search for a minimum presence and scale in a country. The first-stage probit regression results (available upon request from the authors) show that bank size is indeed an important determi-nant of the acquisition probability. In addition, various country-fixed effects are sig-nificant, indicating that foreign strategic investors targeted particular countries more than others, for instance because of a higher credit-growth potential and a better institutional environment.
In a second step we match each ‘treated’ (acquired) bank to similar banks that were not acquired by a strategic investor. We either match an acquired bank to the closest propensity score (nearest neighbour match with a common-support
require-ment) or use Gaussian kernel matching.12The results in Table 6B confirm our
find-ing of Table 6A that over the 2001–2004 period acquired banks expanded their FX loan volume (but not their FX loan share) to households significantly faster than banks that remained in domestic hands. Again, we find no relation between foreign acquisition and changes in FX lending to corporate clients.
4.4. Convergence of FX lending within countries and multinational banks
In this section we examine the role of foreign banks in spreading FX lending within countries (to domestic banks). We also examine their role in spreading FX lending across countries through their multinational networks. Panel A of Table 7 displays the results for within-country and Panel B for within-network dispersion of FX lending.
Panel A reports regressions on our sample of banks for which information on FX lending is available for 2001 and 2004. We relate the change in FX share corporate/ households over the 2001–2004 period to the dummy variable Low FX 2001 in country which is 1 if in 2001 a bank had a lower proportion of FX lending compared to the country average. As in Tables 5 and 6 we control for cross-country variation in changes in macroeconomic conditions through country fixed-effects.
The results provide evidence for convergence of FX lending within countries. Banks with below-average levels of FX lending in 2001 increased the share of FX loans the fastest between 2001 and 2004. A bank that had below-average FX lending in 2001 subsequently increased its proportion of FX lending to firms and
12
In the latter case the counterfactual outcome is calculated as a kernel-weighted average of the outcomes of all acquired banks. Weights are inversely proportional to the distance between the propensity scores of acquired and non-acquired banks.
Table 7. Convergence of FX lending Panel A. Within country convergence Panel B. Within network convergence Dependent variable: FX share (2004 minus 2001) Corporates Households Corporates Households Model (1) (2) (3) (4) (5) (6) (7) (8) Low FX 2001 in country 14.17*** 9.202* 14.68** 17.96** 12.080 19.37** [3.633] [5.239] [6.416] [6.989] [9.585] [7.717] Foreign held 7.086 ) 10.170 [4.449] [11.59] Foreign held* Low FX 2001 7.679 21.240 [6.922] [18.09] Foreign acquired ) 8.720 12.030 [6.943] [13.02] Foreign acquired* Low FX 2001 6.375 ) 17.670 [8.737] [15.21] Low FX 2001 in network 26.29* 25.790 [12.43] [15.00] Bank-level changes 2004 – 01: Assets ) 0.121 ) 0.486 ) 0.398 4.115 1.467 ) 1.828 1.412 10.990 [1.990] [2.762] [2.626] [8.395] [9.780] [6.748] [12.39] [6.908] Wholesale funding 0.125 0.017 0.126 0.212 0.370 0.167 0.630 0.427 [0.101] [0.0787] [0.126] [0.205] [0.234] [0.239] [0.450] [0.644] FX deposits ) 0.104 ) 0.102 ) 0.076 0.343 0.448 0.080 ) 0.167 0.719*** [0.133] [0.148] [0.216] [0.202] [0.265] [0.147] [0.207] [0.154]
Table 7. (Continued) Panel A. Within country convergence Panel B. Within network convergence Dependent variable: FX share (2004 minus 2001) Corporates Households Corporates Households Model (1) (2) (3) (4) (5) (6) (7) (8) Method OLS OLS OLS OLS OLS OLS OLS OLS Country-fixed effects Yes Yes Yes Yes Yes Yes Yes Yes R 2 0.39 0.47 0.43 0.51 0.54 0.59 0.70 0.85 No. of banks 130 106 89 123 99 87 39 37 No. of countries 20 20 18 20 20 18 17 17 Notes : In Panel A Low FX 2001 in country is a dummy variable which is 1 if the bank had a lower fraction of FX loans to corporates (households) in 2001 than the country mean. In Panel B w e analyse data for banks that are subsidiaries of a multinational bank. Low FX 2001 in network is a dummy variable which is 1 if the bank had a lower frac-tion of FX loans to corporates (households) in 2001 compared to the mean of all subsidiaries of the network it belongs to. All models report OLS estimate s. Standard errors are reported in brackets and are adjusted for clustering by country. ***, **, * denote significance at the 0.01, 0.05 and 0.10 level. Table 2 provides the definitions and sources of all variables.
households by 14% and 18% more, respectively, compared to banks in the same country that had above average shares of FX loans in 2001.
Kira´ly et al. (2009) point out that in the case of Hungary the combination of for-eign-bank ownership and intense inter-bank competition was a key determinant of FX lending. Did foreign banks start the euroization process while intense competi-tion merely forced domestic banks to follow their foreign competitors? We find no evidence that the catching up effect identified above is driven in particular by domestic or foreign banks. In Columns 2, 3, 5 and 6 we examine whether foreign banks spread FX lending to domestic banks during our observation period. We interact the variable Low FX 2001 in country with a Foreign held dummy, which is one for banks that were already foreign owned in 2000, or a Foreign acquired dummy, which is one for banks that became foreign owned in 2000, 2001 or 2002. The results are in line with banking competition increasing FX lending as a two-way rather than as a unidirectional process.
In Panel B of Table 7 we examine whether foreign banks spread FX lending across countries through their multinational networks. For this exercise we analyse a sub-sample of banks which belong to a multinational banking group – such as UniCredit Group, Raiffeisen International or Socie´te´ Ge´ne´rale – for which we have at least three subsidiaries from the group in our sample. We relate changes in FX share corporates/households between 2001 and 2004 to a dummy variable Low FX 2001 within network which is 1 for subsidiaries with a proportion of FX lending below the 2001 average for the group they belong to. As in Panel A we find positive coeffi-cients for the variable Low FX 2001 although the estimates are not precisely estim-ated. We cannot conclude that during our observation period multinational banking groups used their internal capital markets to spread FX lending throughout their network.
5. CONCLUSIONS AND POLICY IMPLICATIONS
We use a unique dataset – containing detailed information on the loan and deposit structure of nearly 200 banks in 20 transition economies – to examine how FX lending is related to bank ownership, bank funding and the macroeconomic envir-onment. We focus on the extent to which foreign-owned banks and wholesale fund-ing have contributed to the widespread use of FX lendfund-ing in emergfund-ing Europe.
Overall our results contradict the view that foreign-owned banks have been driving FX lending to unsuspecting retail clients throughout Eastern Europe as a result of eas-ier access to cross-border wholesale funding. First, our cross-sectional results suggest that while foreign banks do lend more in FX to corporate clients, they do not do so to retail clients. Second, while foreign acquisition of a bank does lead to faster growth in FX lending to households, this is driven by faster growth in household lending per se, and not be a redirecting of household credit from domestic to foreign currency. Third, we find no evidence that wholesale funding had a strong causal effect on FX lending
for any type of bank over the 2001–2004 period. The correlation between wholesale funding and FX lending at the bank level is weak, and if anything wholesale funding seems to be a result rather than a determinant of FX lending.
Our results also contradict the view that foreign bank presence spread the FX lend-ing to domestic banks in emerglend-ing Europe. We do find evidence for a within-country convergence process of FX lending. However, we show that both foreign and domestic banks with low levels of FX lending in 2001 – compared to the country average – let their FX lending increase faster over the subsequent three years. Finally, at the coun-try level, our results suggest that banks’ FX lending is driven by long-term macro-economic stability rather than contemporaneous monetary conditions. In particular, a history of high inflation and prospective EU accession are associated with high levels of euroization. Again, this holds for both domestic and foreign banks.
All in all, our findings tell us that foreign banks did not indiscriminately ‘push’ FX loans through their subsidiary network in the transition region, but followed a more cautionary approach where FX lending is targeted to (corporate) clients that can carry the associated risks and to countries in which FX lending to households is attractive from a macroeconomic and institutional perspective. Our results pro-vide important insights to policymakers into the drivers of FX lending in Eastern Europe. They show that FX customer deposits rather than wholesale funding have been a key driver of FX lending in the region. This suggests that credible macro-economic policies which encourage customers to save in local currency may in many countries be more important than regulatory proposals to limit the wholesale funding of (foreign) banks.
Indeed, countries like the Czech Republic and Poland demonstrate how adher-ence to credible macroeconomic policies can result in relatively low levels of FX lending even when a majority of the banking system is foreign owned. Similarly, various Latin American countries have successfully de-dollarized by moving to macro-economic regimes that were more conducive to local currency funding, including flexible exchange rate regimes and inflation targeting (see Zettelmeyer et al., 2010). Having said that, our results also indicate that macroeconomic stabilization within the framework of a credible political commitment to eventual euro adoption, may actually stimulate firms and households to disregard any residual currency risk and expand their FX borrowing.
In countries with weak monetary and fiscal institutions a strong regulatory response to reduce FX lending may even be counterproductive as lending in domestic currency is not a realistic alternative in the short term. In those cases, reducing FX lending through regulation may just lead to less credit. The current policies in Ukraine and Belarus, where new FX denominated mortgages (Ukraine) or all FX retail loans (Belarus) have been banned, may come at the cost of an even sharper decline in bank lending.
This is not to say that regulation can or should not play a role in reducing FX lending. In a second-best world where monetary credibility is not instantly