HAL Id: hal-01550345
https://hal.archives-ouvertes.fr/hal-01550345
Submitted on 29 Jun 2017
HAL is a multi-disciplinary open access
archive for the deposit and dissemination of
sci-entific research documents, whether they are
pub-lished or not. The documents may come from
teaching and research institutions in France or
abroad, or from public or private research centers.
L’archive ouverte pluridisciplinaire HAL, est
destinée au dépôt et à la diffusion de documents
scientifiques de niveau recherche, publiés ou non,
émanant des établissements d’enseignement et de
recherche français ou étrangers, des laboratoires
publics ou privés.
When ego-involved and non ego-involved agents lead to
polarization despite a large consensus
S. Huet
To cite this version:
S. Huet. When ego-involved and non ego-involved agents lead to polarization despite a large consensus.
Social Simulation Conference 2016 (SSC 2016), Sep 2016, Rome, Italy. �hal-01550345�
When ego-involved and non ego-involved agents lead to
polarization despite a large consensus
Sylvie HUET sylvie.huet@irstea.fr
LAPSCO, UBP, 63000 Clermont-Ferrand, France / Irstea, LISC, 63172 Aubière, France
Abstract. Huet & Deffuant [33] showed polarisation on minor issues can be
repro-duced by a dynamics inspired from laboratory experiments [29] considering a popula-tion of self-involved agents on a main issue. This paper studies the impact of a mixed population of involved and not involved agents. The dynamics of self-involved agents is based on [33] meaning agents are attracted on every issues if they are close onto the main issue but reject their peer’s opinion if they are only close onto secondary issue. The dynamics of non self-involved agents is a simple 2D bounded confidence model [11]. In this paper, we focus on the level of polarisation of agents when they are majorly gathered into one cluster. We observe the emergence of vari-ous types of “extreme minor clusters”. They can lead the population to a polarisation on minor issues, but also on fundamental ones. A very long transitory state of ingroup polarisation on secondary issues has been also exhibited. Some of these states are specific to mixed populations.
Keywords. Attraction, rejection, negative influence, involvement, bounded confidence model, polarization, extreme minority effect, in-group polarisation
Polarisation is classically defined as an extremisation of the attitudes after some
discussions in a group compared to the attitudes initially held by people of this group. It is classically measured by the average opinion before and after a discussion. When the average opinion has increased in absolute value, the discussion is assumed having led to polarisation. This is an individual as well as a collective process.
Ego-involvement “… refers more generally to the Ego-involvement of the self or personal
involvement. … Ego-involving topics were those that have intrinsic importance and personal meaning. …. Important or involving issues were those that had self-relevance.” [1]. Muzafer Sherif especially outlined the role of ego-involvement in
persuasion: “... Regardless of the discrepancy of the position presented, we predict
that the more the person is involved in the issue (the more important it is to him), the less susceptible he will be to short-term attempt to change his attitude” [2]. In this
paper, inspired by [3] and the social identity theories [4-6], we assume a strong ego-involvement explains polarisation. We explore our hypothesis using a simulation agent-based model inspired from social psychology studies and considering agents with two different levels of involvement in the discussed issue. In this conference paper, since the most unexpected type of polarisation is a polarisation of the whole
population, we focus on the parameter subspace where agents are majorly gathered into one cluster to study if it polarises. We discovered various types of emerging “ex-treme minor clusters”. They can lead to a polarisation on minor issues, but also on fundamental ones. A very long transitory state of ingroup polarisation on secondary issues has been exhibited also. The following presents a non exhaustive state-of-the-art before an overview of the model. The three next sections give details onto the results and their explanations. A last part discusses what we learn.
1
The state-of-the-art
For long polarisation has been neglected by scientists. Indeed, a large body of stud-ies dedicated to how individuals change their attitudes have at first exhibited the ten-dency of people to be attracted to each other [7, 8], to conform Asch [9]. These “dy-namics of attraction” lead to a consensus of people gathered in a single group due to a majority effect pushing everyone to a centred position. Therefore, with such a domi-nant dynamics, it is difficult to explain the diversity of opinions that is generally ob-served. Simulation models actually proposed different approaches, using binary atti-tudes, specific networks of interactions and various weights associated to the agents [10-12].
Another approach is inspired by the social comparison theory [13], and the social judgement theory [14], assuming that the attraction decreases or even vanishes when the agent attitudes are very contrasted. Several computer models are based on this idea, and the simulations show that the agents tend to gather in groups of homogene-ous attitudes called clusters [15, 16]. These models are usually called “bounded con-fidence” models. These models of bounded confidence are able to exhibit
polari-sation that they assume, accordingly to the literature, to be an attraction for a minority attitude [17] or a minority group [18, 19]. This is also in relation with
ego-involvement since the social judgement theory [14] assumes the ego-involvement level makes the sensitivity of the agents to persuasion: the influence increases and then decreases with the discrepancy between the attitude of the source and the attitude of the participants. The level of ego-involvement defined the inflexion point of the influence: the more ego-involved, the thicker the discrepancy before the inflexion point and the less sensitive to opinion change is the participant. Typically, the simula-tion starts with a populasimula-tion including two types of agents: extremists who have ex-treme and very certain attitudes (they are not easily influenced by others) and moder-ates whose attitudes are uniformly distributed and who can easily be influenced. De-pending on the initial number of extremists and the initial uncertainty of the moder-ates, three convergence types appear: central clusters, double extreme clusters in which almost everyone have adopted one or the other extremist attitude, single ex-treme cluster implying everyone has the same extremist attitude [20-22]. Recently [23] show that a new stationary state appears when the uncertainties do not change over time and for very large uncertainties of the moderates : the attitudes of moderate agents keep fluctuating without clustering but the distribution of the attitudes over the time remains stable. These models provide patterns of attitude evolution that can be
related to observations. However, they suppose that extremists are initially
pre-sent; they do not explain how these initial extremists appear.
Thus, more recently, several researchers investigated if polarisation can take place from a starting population with only moderates by adding a rejection mechanism in some conditions. Some of these models consider binary opinions [24] [25] [26]. In most of the models, the rejection takes place when the attitudes are very far apart ([27, 28]), as suggested by some researches in social psychology [29].
Another hypothesis for the condition in which rejection takes place is to consider it comes from a dissonance between someone’s values and a minor discussed issue. This hypothesis is grounded on studies and theories suggesting that polarisation is connected with identity issues [4-6]. In particular, the set of experiments presented in [3] suggests that the level of self-relevance of the group-source for the agent is very important in the rejection mechanism. Indeed, the experiments show that in case of agreement on a minor issue and disagreement on a highly self-relevant issue (i.e. the group membership in the experimentation), a subject tends to shift away from alter’s position on the minor issue. Moreover, in case of agreement on a highly self-relevant issue, the subjects tend to be attracted on minor issues whatever the level of prelimi-nary disagreement.
A first investigation by simulation of some identity issues in attitude dynamics has been done by [30] which has proposed a modelling of the self-categorization theory [31]. However agents have to solve an optimization problem to define their member-ship. Despite the great interest of this work, this does not seem us sufficiently simple to reflect real common human dynamics. Also [28] [32] have proposed an implemen-tation of the social judgment theory with a bound for attraction or rejection defined by the level of ego-involvement of the agent. However, their design, in one or two di-mensions, does not avoid a possible explosion of opinions.
Another approach has been proposed by [33] inspired by the [3]’s experiments. They consider pair interactions in which two agents who can share or not attitudes on a fundamental issue influence each other on less important (secondary) attitudes and on this fundamental (main) attitude. On each of the two dimensions (i.e. two atti-tudes), they suppose that the attitudes can take continuous values between -1 and +1. When the agents are close to each other on the main dimension, they tend to attract each other on the secondary dimension, even if their disagreement is strong. When they disagree on the main dimension, and are close on the secondary, then they tend to reject each other's secondary attitudes. Agents have thresholds to decide if the dis-tance between their attitude and someone else’s attitude is close. Then, to model a disagreement, they compare the distance between attitudes with a threshold (called attraction threshold um on the main dimension, and rejection threshold us on the
sec-ondary dimension). They show this dynamics reduce the number of clusters since agents are driven mainly by the main dimension and the number of clusters can be directly determined from the value of um; the number of secondary dimensions does
not play a role in the definition of the number of clusters. Moreover, they observe
polarisations on the secondary dimension due to the rejection. However, the dy-namics they have considered is only valuable for agents considering the main dimension as highly self-relevant as outlined by [3].
These authors (pp. 1190, 1191) also indicate that if the participant is not highly nega-tively self-involved in the group of the source, he does not change opinion when he agrees with the source on secondary issue but not on the fundamental issue. Rather he decreases the self-relevance of the source (i.e. the level of importance given to the source’s group) in a way not to differentiate from it in the future. They also precise that “participants relatively indifferent to the group source demonstrated little shift in their attitude judgments” (p. 1186). Then in this paper, we will assume that some agents are indifferent to their group membership and do not change their opinion if they disagree on at least one dimension. This choice is done for simplicity purpose, as well as the one considering a static self-relevance or level of importance given to the main attitude. In the following we consider a mixed population composed of a static part of highly involved agents in one main attitude and the complementary part of no-more-important-attitude agents. The dynamics of the first type of agents is based on [33] while the dynamics of the second type is based onto a classical 2D bounded con-fidence model [15]. They are presented with details in the next Section.
2
The model and the experimental design
We consider a population of N individuals. A part of them are considered as highly self-involved in the main dimension while the other part is not. The model includes four parameters: phsi, the part of highly self-involved people having a dynamics closed to the people considering the group membership as highly self-relevant in [29],
um and us, respectively thresholds for opinion change on the main and the secondary
dimension, and μ ruling the intensity of influence at each meeting (comprised between 0 and 0.5). An individual has two attitudes xm (on the main dimension) and xs (on the
secondary dimension) taking real values between -1 and +1. During an iteration, a couple of individuals X and Y is randomly chosen and can influence each other. The algorithm is the following:
Choose randomly a couple (X,Y) of individuals in the population;
X and Y change their attitudes at the same time, according to the influence function chosen accordingly to their status (i.e. the potentially influenced is a non-highly self-involved agent or a highly self-involved agent).
2.1 Influence on a non-highly self-involved agent (non-HSI)
The calculation of the influence of Y on X if X is a non-HSI agent (of course the influ-ence of X on Y if Y is a non-HSI agent is found by inverting X and Y) is the following. Let (xm, xs) and (ym, ys) be the attitudes of X and Y respectively. The influence of Y on
X is not null if xmym um and xsys us indicating agent X agrees with Y. Both attitudes of X are going to get closer to those of Y, proportionally to the attitudi-nal distance on each dimension:
() ()
) ( ) 1 (t x t y t x t xm m m m
() ()
) ( ) 1 (t x t y t x t xs s s sFor every other cases of partial agreement (only close on one dimension) or total disagreement (far on two dimensions), X remains indifferent to Y and does not change their opinions.
2.2 Influence on a highly self-involved agent (HSI)
The calculation of the influence of Y on X if X is a HSI agent (of course the influence of X on Y if Y is a HSI is found by inverting X and Y) is based on [33] and can be de-scribed as follows. Let (xm, xs) and (ym, ys) be the attitudes of X and Y respectively. We
first consider the main attitude dimension.
If xmym um, individual X agrees with Y on the main dimension. Both atti-tudes of X are going to get closer to those of Y, proportionally to the attitudinal dis-tance on each dimension:
() ()
) ( ) 1 (t x t y t x t xm m m m
() ()
) ( ) 1 (t x t y t x t xs s s sIndeed, whatever the agreement level on the secondary dimension is, X is going to be globally closer to Y. If it was already close, it gets closer.
If xmym um, agent X disagrees with Y on the main dimension and if s
s s y u
x : Agent X feels it is too close to Y on the secondary dimension, because of their disagreement on the main dimension. To solve the conflicting situation, X moves away from Y on this dimension. The attitude change is proportional to the dis-tance to reach the rejection threshold:
if
xsys
0 then xs(t1)xs(t)
us
ys(t)xs(t)
else xs(t1)xs(t)
us
ys(t)xs(t)
In the other cases X is not modified by Y.
Moreover, we confine the attitude in the interval [-1, +1]: if then where sign() is a function which returns -1 if its argument is strictly negative, +1 otherwise.
The attitude of Y is calculated is the same way considering the situation of the meeting with X and if Y is HSI.
2.3 The experimental design and the measured indicator
Our populations of agents have attitudes initially drawn at random. We simulate their evolutions, for different values of the parameters in order to compare the behaviour of a mixed population to the known behaviours of “pure” population of highly involved agents or not involved agents. We vary the following parameters considering 10 repli-cates for each set of values:
• N and phsi: 5000 (known as sufficient to observe stable states of the already
known models of “pure” populations, ie phsi equal 0 or 1 (corresponding to [33]), 10000 agents for phsi equal to 0.1, (and 25000 agents to have more visible graphs);
• um and us: from 0.05 to 1 by step of 0.05.
We stop the exploration of um and us at 1 arbitrarily for this first study. For a same
sec-ondary dimension, the opinion is bounded between [-1;+1]; it is not bounded. The second case has been studied to prove the bounds are not responsible for the polarisa-tion. μ remains constant on the two dimensions for every experimental conditions. It is valued 0.5.
Two indicators are measured during the simulation and then averaged over the rep-licates: (1) the number of clusters (which is classically counted considering one agent is member of a cluster if it is located at a distance smaller than a threshold from at least one member of the considered group); (2) the average absolute opinion on each dimension (it is valued 0.5 at the beginning for a uniform random initialisation of opinions).
In this conference paper, since the most unexpected type of polarisation is a polari-sation of the whole population (or almost), we focus on the parameter subspace where agents are majorly gathered into one cluster to study if it polarises. Practically, it
means our number of large clusters is one and the average absolute opinion on each dimension is close to 0 (since everyone goes to the centered position in “pure” population cases. Thus a value sufficiently higher than 0 indicates a po-larisation while a value close to 0 indicates a centralisation of the opinions.
3
The clustering process
This section is interesting in the number of clusters generated by the dynamics and remind what we already know from the behaviour of “pure” populations.
For a pure population of non-HSI, the number of sufficiently large clusters can be approximated by 1/um*1/us. If the population is only composed from HSI agents, we
know the number of clusters is approximated by 1/um since the main dimension drives
the clustering [33]. This makes the number of clusters independent from the number of discussed secondary dimensions and simplify the social space as it can be seen by an agent (i.e. because of the smaller number of clusters).
Fig. 1 on the right shows what occur for a mixed population of non-HSI and HIS agents (phsi=0.1): a behaviour quite similar to the one observed for phsi =1 making the number of clusters equal to 1/um. A few part of highly self-involved people is
enough to minimise the number of clusters and to make the problem of the num-ber of clusters always equivalent to a one-dimension problem (as for a pure
popu-lation of HSI agents).
Fig. 1 on the left remind about the existence of minor clusters containing a very small minority of agents when μ is sufficienly large (as it is the case in our current experimental design). They have been clearly identified in the BC model and are lo-cated between the various clusters and onto the extrema of the opinion space, espe-cially for large values of u normally leading to one major cluster containing at least 95% of the population [34] [35]. We will see these minor clusters become important when the population contains HIS agents.
Fig. 1. On the left: Number of clusters containing at least 4% of the population (for a bounded
opinion 2D space) and phsi = 0.1 (10000 agents). Abscissa um, ordinate : us. While light grey
draws the area of total consensus (only one cluster), other colours represents where agents gather into several clusters. On the right: Minor clusters appear for larger values of µ in an opinion space varying from 0 to 1, from Laguna et al [34] (see also [35] who shows size of minor clusters varies with um [for a density model])
4
The polarisation trajectories
In the one-cluster parameter subspace, we discovered emerging “extreme minor clusters” leading to a polarisation on minor issues, but also on fundamental ones. A very long transitory state of ingroup polarisation on secondary issues has been exhib-ited also. The following presents the respective trajectories after a first subsection explaining how they are represented.
4.1 How to read the trajectories.
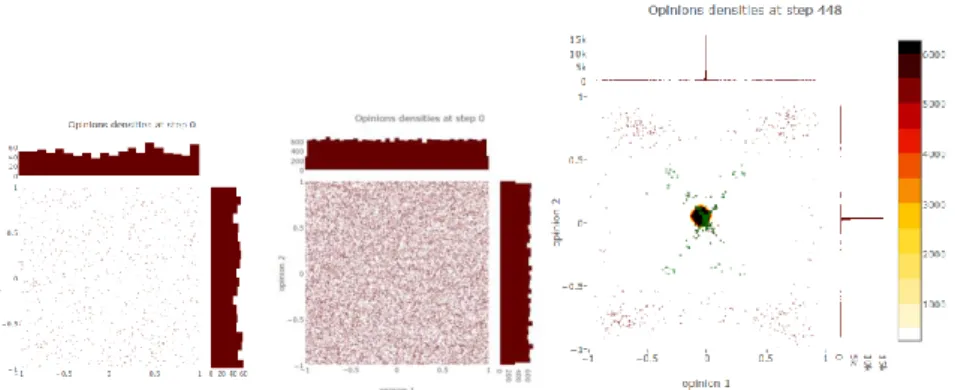
The following figure presents the initial state as well as the type of graph used to show the trajectories of the model (on the left). All along the simulation, dots on graphs represent an agent’s opinions: brown dots represent the non-HIS agents, and green dots represent the HSI agents. Since the clusters are sufficiently formed, they are also represented in density over the parameter space (on the right). The scale for the density is on the right of the figure.
Fig. 2. On the left, initial state of uniform random opinion for 1000 agents, and in the center for
25000 agents (25000 agents have been chosen for illustration because dynamics is more visible onto the graph): each dot represent one couple of opinion (xm,xs) of an agent. On Abscissa,
opinion 1 is the main opinion. On ordinate, opinion 2 is the secondary dimension. Brown dots are non-HIS agents, and green dots and non-HIS agents. The opinion density distributions of each dimension are visible on the right and the top of the graph.
4.2 Polarisation on the main dimension: a major single extreme due to extreme minorities
A first type of polarisation we observed occurs on the main dimension for various couples of values (um, us) with us < um. Fig. 3 shows an example of trajectory leading
to such a “single extreme” cluster on the main dimension since some very extreme minor clusters have emerged. It is mainly ruled by attraction between agents. Due to the high value of um, agents go quickly to the center and some agents are forgotten on
the extreme values of the main dimension by the dynamics (previously shown by [36] and [37], see also Section 3, fig. 1 on the right). For us < um the initial depolarisation
onto the secondary dimension is slower than the depolarisation on the main dimen-sion. Then, there are less forgotten agents on the extreme of the secondary dimendimen-sion. Moreover, HSI agents go quicker to the center compared to non-HSI. Since everyone is gathered into a centered unique large cluster, this cluster slowly oscillates in the opinion space due to HIS agents which want to be closer to “forgotten” agents on the borders. This move leads the larger cluster to an extremisation, only stopped when all “forgotten” people close on the main dimension are gathered into it.
This is obvious HSI agents in green are attracted on both dimension by the extreme corners of non-HSI agents. To sum-up, this is the stability of the emerging “corner” small clusters which is responsible for the polarisation of the larger cluster. This sta-bility comes from non-HSI agents which require closeness onto the two dimensions to be influenced. Then, considering the relation between the non-HIS of the larger and the corner small clusters, they ignore each other because they are different onto the secondary dimension. This type of polarisation does not depend on rejection (it appears also for a similar model with no rejection).
Fig. 3. Polarisation on the main dimension: Single extreme. Stable state for 25000 agents, um =
4.3 Polarisation on the secondary dimension: another extreme minorities effect
From the study of a “pure” population of highly self-involved agents in [33], we know the unique large cluster can polarise for very large values of us due to the
pres-ence of minor clusters in the opinion space. For large um, agents attract each other
very fast to the center of the opinion space on the main dimension. Then some agents are forgotten onto the extrema of the main dimension. Since almost everyone has gathered into a large central cluster, these remaining minor clusters, far on the main dimension, push agents from the central cluster to polarise onto the secondary dimen-sion.
Fig. 4. Polarisation on the secondary dimension. Stable state for 25000 agents, um = 0.7, us =
1.0, phsi = 0.11 (dots in green are HSI and those in brown are non-HSI agents). Blue circles indicate extreme cluster of non-HIS agents and green ones indicates HSI agents.
Fig. 4 shows this also occurs in mixed population. For our particular case, compar-ing to minor effect leadcompar-ing to polarization on main dimension, agents gather into the central cluster very fast on the secondary dimension. Since us is very large, there is
no forgotten (or very few) agents on the secondary dimension. Most of the forgotten agents on the main dimension gather altogether on quite central secondary dimension positions on the main extrema. Only when there are forgotten people onto the two
mostly composed from non-HSI agents. However, from the point of view of the HSI agents, members of the largest initially central cluster, they are considered as close onto the secondary dimension while far on the main dimension. Then HSI agents of the largest cluster reject them while simultaneously attract the non-HSI agents of the largest cluster. On the other hand extreme HSI agents on main dimension make the same (see green circles on Fig. 4). This makes the large cluster polarized onto the secondary dimension until the minor clusters are not anymore considered as close. Then, they remain at the end, on the other extreme than the one occupied by the minor clusters on the main dimension. This latter indeed, are absorbed by the larger cluster because of the HSI-agents considering them as attractive due to the proximity onto the main dimension. This type of polarisation depends on rejection (it does not appear for a similar model with no rejection).
4.4 Polarisation on the secondary dimension: a long transitory in-group polarisation
We have also noticed a transitory in-group polarisation occurring when us is small
(and um>0.5). It is due to the time required to reach the convergence which increases
when us decreases. For smaller values of us, the unique central cluster covers almost
all the secondary dimension for a long time, composed from various subclusters of non-HSI agents which are joined altogether by moving HSI agents (see Fig. 5). At the end, everyone is gathered in the center due to their impact of the HSI agents. This
perfectly describes how HSI increases the level of cohesion of the population compared to a population of non-HSI.
Fig. 5. Polarisation on the secondary dimension um = 0.7, us = 0.1, phsi = 0.1, 5000 agents: the
clustering process in the depolarisation area onto the secondary dimension is very long when us
is small. Then, the agents remain polarised for long inside a unique cluster but really clustering onto the two dimensions.
5
The polarisation maps for large u
mAs already said, we focus on polarisation on the most expected depolarisation area: the area leading to one cluster that we define as um >0.5 according to Fig. 1 and the
us on the main and on the secondary dimension. The blue color indicates a perfect
centralisation of the opinions (no polarisation) while other colors show various levels or polarisation (see 2.3 for explanations).
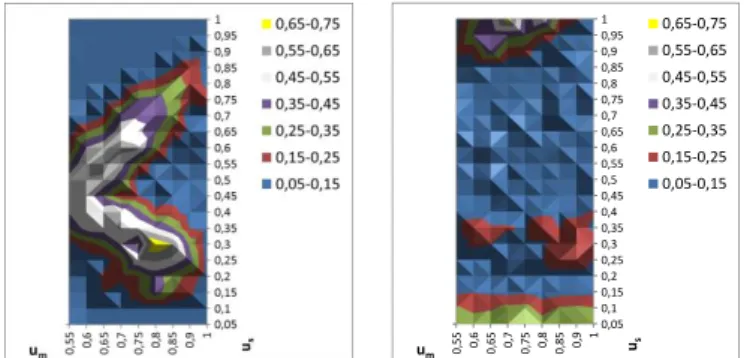
Fig. 6. Average absolute opinion on main dimension for, from the left to the right, phsi equals
to 0 (5000 agents), 0.1 (10000 agents) and 1 (5000 agents). Abscissa um, ordinate: us.
We see on the fig. 6 the polarisation on the main dimension. This polarisation
comes only from the co-presence of highly self-involved people and non-highly self-involved people (in the centered graph) since it does not occur for phsi = 0
(graph on the left) as well as for phsi=1 (graph on the right). For these latter cases, only depolarisation occurs. This polarisation leading to a single extreme cluster oc-curs only for a particular arrow-shape of couple (um, us) values for phsi=0.1 which
remain to explain. We notice especially it does not occur for us>um.
Fig. 7. Average absolute opinion on secondary dimension for, from the left to the right, phsi
equals to 0 (5000 agents), 0.1 (10000 agents) and 1 (5000 agents). Abscissa um, ordinate: us.
The polarisation on the secondary dimension does not occur for a “pure” popula-tion of non-HSI agents (on the left of the Fig. 7) and HIS agents (on the right of the Fig. 7), at least for us≤1. It does for a very small part of HSI agents in the population
(Fig. 7 in the central for phsi=0.1). From the centered graph of Fig. 7, we notice two various areas of polarisation for: (a) large values of us> um and us large enough (ie
close or higher than 1 not to observe forgotten agents onto the secondary dimension; (b) small values of us. They correspond to two trajectory types presented in Section 4.
The large values of us correspond to the single extreme cluster. The small values of us
correspond to the transitory in-group polarisation that, as expected, does not depend on the value of um since um is higher than 0.5.
One can think the polarisation can be explained by the fact the opinion space is bounded. But it is not the case as it can be seen in the following Fig. 8 showing results for an unbounded attitude space. We see on both figures the same polarisation areas.
Fig. 8. Average absolute opinion on the main (on the left) and on the secondary (on the right)
dimension for 10000 agents evaluating in an unbounded opinion space, phsi =0.1 Abscissa um,
ordinate: us.
6
Conclusion
We study how involvement can explain polarisation in an agent-based model. We consider a population composed of two different types of agents: the highly self-involved (HSI) agents having a dynamics based onto [33] inspired from a particular set of experiments [3]; the non-highly self-involved agents (non-HSI) with a dynam-ics based onto a two-dimensional bounded confidence model ([15]). HIS’s dynamdynam-ics corresponds to the particular behaviour in terms of attitude change of people who are highly self-involved in one dimension and consider it as defining themselves. From the modelling point of view, it assumes that one dimension is more stable and more important than the other. This more stable dimension, called main dimension, repre-sents the highly self-relevant issue for the agents and rules the attitude change on a secondary dimension. If two agents are close on the main dimension (separated by a distance smaller than um), then they attract each other on the main and on the
second-ary dimensions, whatever their disagreement on the secondsecond-ary dimension. If they are far from each other on the main dimension, then proximity on the secondary dimen-sion (at a distance less than us) is uncomfortable, and generates rejection on this
di-mension. The proximity on a dimension is defined by comparing the attitude distance with the agent’s threshold on this dimension. For non-HSI agents, neither the main nor the secondary dimension is more important than other. Then, to be influenced, the non-HIS agent should consider the peer source as close simultaneously onto the two dimensions. One can think this latter condition for influence is very demanding. But [3] precise in their paper that participants who do not consider the source as highly
0,05 0,1 0,15 0,2 0,25 0,3 0,35 0,4 0,45 0,5 0,55 0,6 0,65 0,7 0,75 0,8 0,85 0,9 0,95 1 0,5 5 0,6 0,65 0,7 0,75 0,8 0,85 0,9 1 us um 0,65-0,75 0,55-0,65 0,45-0,55 0,35-0,45 0,25-0,35 0,15-0,25 0,05-0,15
self-relevant do not change their opinions, and [36-39] show in their experiments the level of attraction for peers depends on the rate of similarity with them.
As expected, simulations show agents gathering into attitudinal groups. The num-ber of groups is defined by how high they feel close onto the main dimension of the rest of the population. Even few highly self-involved people are enough to minimise the number of clusters.
In this paper, for the study of polarisation, we focus on um>0.5 meaning the stable
state is only one major cluster (containing most of the population).
Polarisation on main issues appear for some particular couples of values (um,us)
and us≤um. They lead to polarisation because on the one hand to the rejection process,
on the other hand to the asymmetry of influence between highly self-involved and non-highly self-involved agents. In both cases, they allow the emergence of “corner” minor clusters, extreme on the two dimensions and composed of non-highly self-involved agents.
Since extreme minor clusters and central major cluster have emerged, the attraction of highly self-involved agents of the central cluster for non-highly involved agents of the minor extreme clusters leads the major cluster to polarise on the main attitude. The polarisation on fundamental issues is a specificity of mixed population. It is asso-ciated to the blindness of non-highly self-involved agent which makes the relationship with highly self-involved agent asymmetric and forced them to adopt exactly their position or to reject them. This type of polarisation does not depend on rejection. It occurs at least, but not always, when openness on the main issue is higher or equal than the one on the secondary issue. This is not really intuitive since fundamental issue makes us more stable and less influenced normally. However, this is totally coherent with the idea a high uncertainty is responsible for extremisation of people.
A second type of polarisation of the central cluster is onto the secondary dimen-sion. It occurs when the parameter values do not allow the appearance of “corner” minor clusters but some agents remain forgotten onto the extreme of the main dimen-sion (large values of us > um and us large enough (ie close or higher than 1 not to
ob-serve forgotten agents onto the secondary dimension). It is due to a rejection of highly self-involved agents between them simultaneously with an attraction for the agents of their own groups (major on the one hand, extremes on main attitude on the other hand). This sounds in accordance with theories related to groups and identity, espe-cially the self-categorization theory [26-28] arguing agents look for a compromise between difference and similarity to others at the group level. This type of
polarisa-tion depends on rejecpolarisa-tion. It is more intuitive since people are more certain about
their fundamental issue compared to the secondary.
The appearance of a long transitory in-group polarisation association to a large certainty (ie a small uncertainty) on secondary issues is also of interest. It also perfect-ly describes how HSI increases the level of cohesion of the population compared to a population of non-HSI.
Overall, these first results seem to reconcile various points of view about the possi-ble source of polarisation: attraction for extreme minority on main issue, or rejection of them on secondary issue. In the two cases, the key of the polarisation lays in the emergence of these extreme minorities which require a too fast convergence of
opin-ions (ie a sufficiently high value of µ). Our results also offer some new insights about this emergence complementing the work of [34, 35] who have shown minor clusters appear between the big clusters and on the border of the attitude space in the bounded confidence model. The in-group polarisation, even transitory, exhibited for very small values of us is also very interesting and new.
This is only a first study which deserves more investigations about the formalisa-tion of the behaviour and what occur for smaller values of um. The explanation of why
the polarisation on the main issue occurs only for some particular couples of values (um,us) and us≤um is also a challenge to deal with in the futre.
7
References
1. Petty, R., J. Cacioppo, and C. Haugtvedt, Ego-involvement and Persuasion:
An appreciative look at the Sherif's contribution to the study of self-relevance and attitude change, in Social judgment and intergroup relations: Essays in honor of Muzafer Sherif, D. Granberg and G. Sarup, Editors. 1992,
Springer/Verlag: New York. p. 147-175.
2. Sherif, C.W., and Muzafer Sherif, eds. . Sherif, Carolyn W., and Muzafer
Sherif, eds. Attitude, Ego-involvement, and Change. Wiley, 1968. in Symposium of the Pennsylvania State University. 1968. New York.
3. Wood, W., et al., Self-definition, defensive processing, and influence: the
normative impact of majority and minority groups. Journal of Personality
and Social Psychology, 1996(71): p. 1181-1193.
4. Brewer, M.B., The Social Self: On Being the Same and Different at the Same
Time. Pers. Soc. Psychol. Bulletin, 1991. 17(5): p. 475-482.
5. Tajfel, H. and J. Turner, An integrative theory of intergroup conflict. The social psychology of intergroup relations, 1979. 33(47): p. 74.
6. Turner, J.C., Social identification and psychological group formation, in The
social dimension, H. Tajfel, Editor. 1984, Cambridge University Press:
Cambridge. p. 518-538.
7. Allport, G.W., Social Psychology. 1924: Boston: Houghton Mifflin.
8. Sherif, M., A study of some social factors in perception. Archives of Psychology, 1935. 27(187).
9. Asch, E.S., Forming Impressions of Personality. Journal of Abnormal and Social Psychology, 1946(41): p. 258-290.
10. Axelrod, R., The dissemination of culture a model with local convergence
and global polarization. Journal of Conflict Resolution, 1997. 41(2): p.
203-226.
11. Latané, B. and M.J. Bourgeois, Dynamic social impact and the
consolidation, clustering, correlations and continuing diversity of culture (chapter 10), in Group Processes: Blackwell handbook of social psychology,
12. Nowak, A., J. Szamrej, and B. Latané, From Private Attitude to Public
Opinion: A dynamic Theory of Social Impact. Psychological Review, 1990.
97(3): p. 362-376.
13. Festinger, L., A theory of social comparison processes. Human Relations, 1954. 7(2): p. 117-140.
14. Sherif, M. and C.I. Hovland, Social Judgment. Assimilation and contrast
effects. Communication and attitude change. 1961: New Haven and London:
Yale University Press.
15. Deffuant, G., et al., Mixing beliefs among interacting agents. Advances in Complex Systems, 2001(3): p. 87-98.
16. Hegselmann, R. and U. Krause, Opinion Dynamics and Bounded Confidence
Models, Analysis and Simulation. Journal of Artificial Societies and Social
Simulation, 2002. 5(3).
17. Moscovici, S. and M. Zavalloni, The Group as a Polarizer Of Attitudes. Journal of Personality and Social Psychology, 1969. 12(2): p. 125-135. 18. Eagly, A.H. and S. Chaiken, The Social Context of Attitude Formation and
Change, in The Psychology of Attitudes, A.H.C. Eagly, S., Editor. 1993, Fort
Worth, TX: Harcourt Brace Jovanovich, Thomson/Wadsworth. p. 627-663. 19. Isenberg, D., Group Polarization: A critical Review and Meta-Analysis.
Journal of Personality and Social Psychology, 1986. 50(6): p. 1141-1151. 20. Deffuant, G., Comparing Extremism Propagation in Continuous Opinion
Models. Journal of Artificial Societies and Social Simulation, 2006. 9(3).
21. Deffuant, G., et al., How can extremism prevail ? A study based on the
relative agreement interaction model. Journal of Artificial Societies and
Social Simulation, 2002. 5(4).
22. Deffuant, G. and G. Weisbuch, Probability distribution dynamics explaining
agent model convergence to extremism, in Social Simulation. Technologies, Advances, and New Discoveries, B. Edmonds, C. Hernandez, and K.G.
Troitzsch, Editors. 2007, Information Science Reference, Hershey, USA. p. 43-60.
23. Mathias, J.-D., S. Huet, and G. Deffuant, Bounded Confidence Model with
Fixed Uncertainties and Extremists: The Opinions Can Keep Fluctuating Indefinitely. Journal of Artificial Societies and Social Simulation, 2016.
19(1): p. 6.
24. Galam, S., Contrarian deterministic effects on opinion dynamics: "the hung
elections scenario". Physica A, 2004. 333: p. 453-460.
25. Wio, H.S., M.S. de la Lama, and J.M. Lopez, Contrarian-like behavior and
system size stochastic resonance in an opinion spreading model. Physica A,
2006. 371: p. 108-111.
26. Mark, N.P., Culture and Competition: Homophily and Distancing
Explanations for Cultural Niches. American Sociological Review, 2003.
68(3): p. 319-345.
27. Flache, A. and M. Mäs, Why do faultlines matter? A computational model of
how strong demographic faultlines undermine team cohesion. Simulation
28. Jager, W. and F. Amblard, Uniformity, Bipolarization and Pluriformity
Captured as Generic Stylized Behavior with an Agent-Based Simulation Model of Attitude Change. Computational & Mathematical Organization
Theory, 2004(10): p. 295-303.
29. Whittaker, J.O., Opinion change as a function of communication-attitude
discrepancy. Psychological Reports, 1963. 13: p. 763-772.
30. Salzarulo, L., A continuous Opinion Dynamics Model Based on the Principle
of Meta-Contrast. Journal of Artificial Societies and Social Simulation,
2006. 9(1).
31. Turner, J.C., et al., Rediscovering the social groups: A self-categorization
theory. 1987: Cambridge, MA: Basil Blackwell.
32. Jager, W. and F. Amblard. Multiple Attitude Dynamics in Large Populations. in Agent 2005 Conference on Generative Social Processes, Models, and
Mechanisms. 2005. co-sponsored by Argonne National Laboratory and The
University of Chicago.
33. Huet, S. and G. Deffuant, Openness leads to opinion stability and
narrowness to volatility. Advances in Complex Systems, 2010. 13(3): p.
405-423.
34. Laguna, M.F., G. Abramson, and D.H. Zanette, Minorities in a Model for
Opinion Formation. Complexity, 2004. 9(4): p. 31-36.
35. Lorenz, J., Continuous Opinion Dynamics Under Bounded Confidence: A
Survey. International Journal of Modern Physics C 2007. 18(12): p.
1819-1838.
36. Michinov, E. and J.-M. Monteil, Attraction personnelle et attraction sociale:
Lorsque la saillance catégorielle annule la relation similitude-attraction.
Canadian Journal of Behavioural Science/Revue canadienne des sciences du comportement, 2003. 35(4): p. 305.
37. Michinov, E. and N. Michinov, Social comparison orientation moderates the
effects of group membership on the similarity-attraction relationship. The
Journal of Social Psychology, 2011. 151(6): p. 754-766.
38. Montoya, R.M. and T.L. Pittinsky, When increased group identification
leads to outgroup liking and cooperation: The role of trust. The Journal of
Social Psychology, 2011. 151(6): p. 784-806.
39. Reid, C.A., J.L. Davis, and J.D. Green, The power of change: interpersonal
attraction as a function of attitude similarity and attitude alignment. The