HAL Id: halshs-00553122
https://halshs.archives-ouvertes.fr/halshs-00553122
Preprint submitted on 6 Jan 2011
HAL is a multi-disciplinary open access archive for the deposit and dissemination of sci-entific research documents, whether they are pub-lished or not. The documents may come from teaching and research institutions in France or abroad, or from public or private research centers.
L’archive ouverte pluridisciplinaire HAL, est destinée au dépôt et à la diffusion de documents scientifiques de niveau recherche, publiés ou non, émanant des établissements d’enseignement et de recherche français ou étrangers, des laboratoires publics ou privés.
Decentralization in Africa and the nature of local
governments’ competition: evidence from Benin
Emilie Caldeira, Grégoire Rota-Graziosi, Martial Foucault
To cite this version:
Emilie Caldeira, Grégoire Rota-Graziosi, Martial Foucault. Decentralization in Africa and the nature of local governments’ competition: evidence from Benin. 2011. �halshs-00553122�
CERDI, Etudes et Documents, E 2010.19
Document de travail de la série
Etudes et Documents
E 2010.19
Decentralization in Africa and the nature of local governments' competition:
evidence from Benin
Emilie Caldeira*, Martial Foucault♯
and Grégoire Rota-Graziosi*
June 2010
* CERDI-CNRS, Université d'Auvergne, Economics Dept
Mail address: 65 boulevard François Mitterrand, 63000 Clermont-Ferrand, France Email: emiliecaldeira@gmail.com
Email: gregoire.rota_graziosi@u-clermont1.fr ♯: Universite de Montreal, Political Science Dept, Email : martial.foucault@umontreal.ca
Decentralisation in Africa and the nature of local
governments’competition: evidence from Benin
Abstract
Without denying particular dimensions of the decentralisation in Sub-Saharan countries, this paper applies standard reasoning from the …scal federalism literature to a developing country and tests the existence of strategic interactions among local Beninese governments, called ‘communes’. We …rst propose a two-jurisdiction model of public expenditure interactions, considering a constrained Nash equilibrium to capture the extreme poverty of some communes. We show that spillovers among jurisdictions involve strategic behaviours of local o¢ cials who have su¢ cient levels of …scal resources. Second, by estimating a spatial lag model, our analysis provides evidence for the presence of strategic interactions in Benin, contingent on communes’ …scal autonomy. Such interactions arise among communes which are geographically or ethnically close. We also highlight both an opportunistic behaviour of local governments before local elections and an e¤ect of partisan a¢ liations. This African democracy appears to be as concerned as developed democracies with strategic …scal interactions.
JEL Classi…cation: D72, H2, H7
Keywords: Fiscal interactions, Benin, decentralisation, local government, dynamic panel data.
Emilie Caldeira,z Martial Foucault] and Grégoire Rota-Graziosiz z: CERDI-CNRS, Université d’Auvergne, Economics Dept
Mail address: 65 boulevard François Mitterrand, 63000 Clermont-Ferrand, France Email: emiliecaldeira@gmail.com.
Email: gregoire.rota_graziosi@u-clermont1.fr. ]: Universite de Montreal, Political Science Dept. Mail address: CP 6128, succ. centre-ville. Montreal, Qc, H3C3J7, Canada
1
Introduction
Decentralisation has recently been embraced by a large number of developing countries, especially in Africa, since it has been presented as a powerful tool to reduce poverty and improve governance. The World Bank in particular views it as one of the major reforms on its agenda. In response to the failure of a central state to run the countries’ development or to limit the risk of civil con‡icts in ethnically fragmented countries, decentralisation is perceived as a way to ensure political stability, to improve accountability and responsiveness of local leaders, to increase the e¢ ciency of public policy, and ultimately to reduce poverty. Two principal and non-exclusive arguments might explain this infatuation with decen-tralisation in developing countries. The …rst one is what we call the ‘proximity principle’, given that decentralisation moves governments closer to citizens. Oates (1972) decentralisa-tion theorem states that decentralisadecentralisa-tion improves preference matching by o¤ering a greater diversity of public services to a heterogeneous population. Moreover, by reducing infor-mational asymmetries between those in power and those governed, decentralisation should induce a higher accountability of governments and in …ne a better e¢ ciency in public spend-ing. The second main argument in favour of decentralisation dates at least from Tiebout (1961) and may be called the ‘competition principle’. Indeed, decentralisation is supposed to induce some interjurisdictional competition among political powers: ‘voting with feet’ and ‘yardstick’competition (Salmon, 1987) are another ways to increase the e¢ ciency of public spending.
Bardhan (2002) argued, however, that ‘the institutional context (and therefore the struc-ture of incentives and organisation) in developing and transition economies is quite di¤erent from those in advanced industrial economies’, and he recommended us ‘to go beyond the traditional …scal federalism literature’. The reason is that most developing countries do not meet implicit or explicit assumptions posed by …scal federalism theory. For instance, the Tiebout model cannot be applied to developing countries where the population mobility appears to be strongly limited. The existence of a yardstick competition appears at least debatable in the context of young democracies. Moreover, apart from the corruption issue emphasised by Prud’homme (1995) or Bardhan and Mookherjee (2005), these countries face
some administrative capacity constraints that the rich countries do not su¤er.
These pitfalls have induced the literature on decentralisation in developing countries to focus on the e¤ectiveness of the …rst argument, the ‘proximity principle’. For instance, Faguet (2004) shows that decentralisation in Bolivia has improved the responsiveness of public in-vestment to local needs. Alderman (2002) established that local o¢ cials in Albania manage anti-poverty programmes more accurately and cost-e¤ectively than a central government agency since they are better informed. Bardhan and Mookherjee (2005) and Galasso and Ravallion (2005) have also highlighted that decentralisation improves anti-poverty systems in particular through better intra-regional targeting. These analyses suggest that decentral-isation may lead to poverty reduction from the bottom up.1 None of these authors, however, consider the second aspect of decentralisation, the ‘competition principle’, which induces some jurisdictions’interactions.
Do we have to believe that no interaction exists among local governments in developing countries and that decentralisation is only guided by the ‘proximity principle’ argument? The ‘departure from the classic …scal federalism literature’ advocated by Bardhan (2002) might have been followed too far.2 The aim of this paper is to come back to the ‘competition principle’by examining interactions among local governments in a developing country. With-out ignoring some of the speci…cities of developing countries, such as the extreme poverty of some jurisdictions, for instance, we apply some standard reasoning of the …scal federalism literature to a developing country, Benin, which has recently experienced a decentralisation process.
Considering the degree of freedom of local governments in developing countries, we focus on the public expenditure side and not on the revenues side to shed light on jurisdictional interactions. With respect to the huge literature on tax competition the analysis of public spending interaction seems very limited: for instance, Kelejian and Prucha (1998), Redoano (2007) and Foucault, Madies, and Paty (2008) respectively study the US, the EU and France. For developing countries this kind of work is even rarer: Akin, Hutchinson, and Strumpf
1 The relationship between decentralisation and poverty alleviation has been reviewed by Klugman (1997) and Bird and Rodriguez (1999).
2 Chavis (2009) studies the e¤ect of competition on decentralisation e¢ ciency in Indonesia. The author considers the extent to which the cost per square metre of road project decreases in the number of villages which compete to obtain grants from the central government. The appreciation of competition is limited to the number of competitors. There is no analysis of interactions.
(2005) analyse decentralised health care in Uganda; Arze, Martinez-Vasquez, and Puwanti (2008) investigate local public spending in Indonesia.
The aim of this paper is …rst to establish the existence (or not) of interactions among local Beninese governments, and second to identify its nature. This last notion directly refers to the industrial organisation literature and the well-established notion of strategic complemen-tarity or strategic substitutability provided by Bulow, Geanakoplos, and Klemperer (1985). We intend to tackle the following issues: (1) does decentralisation induce interjurisdictional interactions in Benin? (2) if yes, what is the nature of this competition (strategic comple-ments or substitutes): does an increase in the spending of a jurisdiction induce a similar or inversed variation in neighbouring jurisdictions? (3) which factors (geographical, political or ethnic) help to boost this competition? (4) …nally, what happens during election periods?
Our empirical analysis through a spatial lag model con…rms the existence of strategic in-teractions among Beninese local governments. Moreover public spending choices are strategic complements. These interactions, which are contingent on communes’ resources, exist not only among neighbouring communes but also among those close in terms of ethnic com-position. Lastly, our analysis highlights an e¤ect of partisan a¢ liations and opportunistic behaviour of local governments, which increase public spending in pre-electoral periods.
The remainder of the paper is divided into three sections. Section 2 develops a theoretical analysis of local public spending interactions which takes into account resource constraints of some local governments. In Section 3, after a brief overview of Benin we test the existence of interactions among Beninese local governments between 2002 and 2008; we also identify the …scal setting behaviour of local governments during election periods. Section 4 concludes.
2
Theoretical background
In this section, we present a theoretical model in order to highlight behaviours at play in determining the levels of public spending of local governments in a developing country. Our approach is very standard regarding the literature on …scal federalism, but we take into account some earmarks of developing countries. In particular we develop a constrained Nash equilibrium in order to capture the extreme poverty of some communes. Indeed, the poorest
communes in Benin, Bassila, Cobly, Kandi or Kari-Mama, for instance, respectively display an average level of annual resources of 168, 526, 734 and 861 FCFA per capita (respectively equivalent to $0.31, $0.97, $1.35 and $1.58). Beyond their realism, our assumptions have to be consistent with our empirical tools, in particular those of spatial econometrics, which we use in the next section.
2.1 The model
We consider two jurisdictions (i and j) of the same level. We do not study political issues and then adopt a normative approach. The utility function of a representative individual in jurisdiction i is given by Wi(xi; gi; ijgj), where xi is the private consumption, gi the public
spending in jurisdiction i, and ij is an exogenous non negative parameter, which represents
the degree of spillover e¤ect for inhabitants in jurisdiction i from the public good provided in jurisdiction j. We may have situations where spillovers are not symmetric ( ij 6= ji).3 We
de…ne = ( ij; ji).
Since spatial empirics use weighting matrices for the strategic variables (gi;j), the unique
consistent aggregation technology of local public goods is the weighted summation. Thus, it follows:
Wi(xi; gi; ijgj) = Vi(xi; gi+ ijgj) ;
where the weight is the parameter ij.
Our analysis focuses exclusively on current local public spending, since it is better con-trolled by local governments than investment expenditures. Indeed these latter are often ordered and …nanced by central government. The current spending is a mix of public and merit goods. We are not able to say whether local public spending is a complement to or substitute for private consumption. Thus, without loss of generality concerning our analysis of jurisdictions’ interactions, we will consider a quasi-linear utility function, that is, local public spending and private consumption are Edgeworth-independent:
Vi(xi; gi+ ijgj) = xi+ vi(gi+ ijgj) ;
3
This assumption is linked to our empirical work too. Since proximity matrices are normalised, their sum is equal to unity for each i. Thus, we have ij= ji if and only if jurisdictions i and j have the same number of neighbours for a proximity matrix based on contiguity.
where the function vi(:) is the appreciation of local public goods in jurisdiction i. This
function is increasing in its argument vi0(:) > 0. The sign of its second derivative, however, remains indeterminate. Indeed the concavity of function vi(:), which is often assumed in the
literature, would restrict our theoretical analysis of jurisdictional interactions to the case of strategic substitutes.
We ignore the issue of local debt, which is the focus in important literature on soft budget constraints. Very few countries in Africa, however, allow their local governments to run into debt. Thus, private consumption is equal to net income, and the local government faces the following hard budget constraint (BC):
Ri= xi+ c (gi) ; (1)
where Ri is the income of jurisdiction i and c (:) is the cost of providing an amount gi of local
public good. This cost is assumed to be increasing and convex: dc(gi)
dgi > 0 and
d2c(g i)
dgi2 > 0.
The convexity re‡ects the increasing marginal cost of public funds. Since we focus on current spending and not on public investments, we ignore scale economies. This assumption is not rejected by a preliminary empirical test on our data.4 In order to have some interior solutions when the jurisdiction is not constrained by its wealth, we have to assume that
8i; j; c00(gi) > vi00(gi+ ijgj) : (2)
The convexity of public spending must be superior to the variation of the marginal utility of public goods. This condition obviously holds as soon as the function vi(:) is concave.
Substituting the expression of the private consumption given by (1) into the initial welfare function, we obtain the following objective function, denoted by Ui, which only depends on the strategic variables (gi; gj):
Ui(gi; ijgj) = Ri c (gi) + vi(gi+ ijgj) :
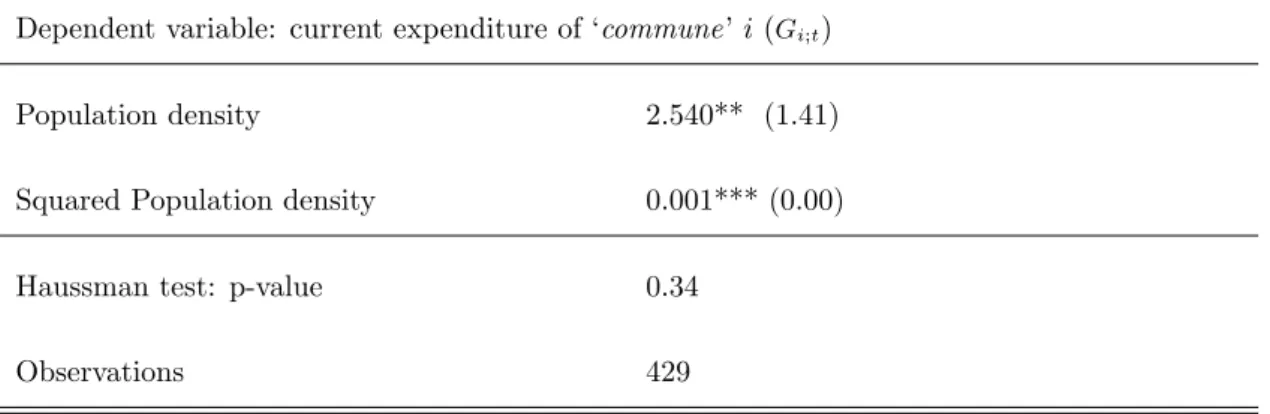
4 We show the absence of scale economies in providing current public spending according to the size of the jurisdiction (measured by the population density, dens). Both signs of …rst and second derivatives are positive and signi…cantly di¤erent from zero: gi= 3:751 :densi + 0:001 :dens2i. Detailed results are provided in Table 1 in the appendix.
Each local government chooses its level of public spending, considering as given the levels of public good in the other jurisdiction. The played game is static and the Nash equilibrium may be constrained. Indeed, we take into account situations where a local government is too poor to …nance the minimum of public spending. This leads us to consider a constrained Nash equilibrium denoted by gi ( ),
gi ( ) = min fgi;egi( )g ;
where gi is given by
Ri c (gi) = 0;
and egi( ) is the solution of the unconstrained Nash equilibrium:
8 > > < > > : egi( ) arg max gi>0 Ui gi; ijgj egj( ) arg max gj>0 Uj(gj; ijgi)
The set of strategies for each jurisdiction i is compact and it corresponds to [0; gi]. The First Order Condition (FOC) of the preceding programme for player i is
dc (gi)
dgi
+ vi0 gi+ ijgj ( ) = 0: (3)
The Second Order Condition (SOC) is respected under condition (2).
We focus on the nature of competition among jurisdictions when it exists. These strate-gic interactions are captured through the sign of dgi
dgj. Following Bulow, Geanakoplos, and
Klemperer (1985), we de…ne local public goods as strategic complements (resp. substitutes) if and only if the marginal utility of public good in jurisdiction i is increasing in the level of local public goods in the other jurisdictions, more formally if @2Ui(gi; ijgj)
@gi@gj > 0 (resp. < 0).
If jurisdiction i is constrained by its wealth, that is, if c (egi( )) > Ri, we have gi = gi and @gi
@gj = 0; otherwise gi =egi( ) and the application of the envelope theorem to (3) yields:
@gi @gj = @2Ui(g i; ijgj) @gi@gj @2Ui(g i; ijgj) @g2 i : (4)
Since the denominator corresponds to the SOC of the maximisation programme, the sign of
@gi
@gj is then equivalent to the sign of
@2Ui(g i; ijgj)
@gi@gj , which also corresponds to the sign of v
00 i (:).5
2.2 Comparative statics
We will now consider a unilateral change in the degree of the spillovers experienced in ju-risdiction i from juju-risdiction j. By so doing we can compare the e¤ects on the behaviour of jurisdiction i between an increase of public spending of a neighbouring jurisdiction and the same variation of a more distant jurisdiction. In other words, we estimate the consequences of geographic or ethnic proximity on local governments’public spending.
For comparative statics’ analysis, we follow Caputo (1996). Indeed, unlike single-agent models, knowledge of how a parameter a¤ects the marginal value of the i th player’s decision variables in a static game is not su¢ cient to determine the Nash equilibrium comparative statics for the level of the i th player’s decision variables. We also have to determine how the parameter’s change a¤ects the other player’s best reply, and …nally how these last variations impact on the marginal value of the i th player’s decision variable.
Considering the unconstrained Nash equilibrium (8i; gi ( ) =egi( )) the di¤erentiation
of (3) with respect to ij for both jurisdictions yields:
0 B @ U i 11(:) ijvi00(:) jivj00(:) U j 11(:) 1 C A 0 B @ @egi( ) @ ij @egj( ) @ ij 1 C A = 0 B @ ijegj( ) v 00 i (:) 0 1 C A :
Applying the Cramer rule we then obtain:
@egi( ) @ ij = ijegj( ) jJj vi00(egi( ) + ijegj( )) U11j (egj( ) ; jiegi( )) ; @egj( ) @ ij = ij jiegj( ) jJj v00i (egi( ) + ijegj( )) v00j(egj( ) + jiegi( )) : (5)
where J is the Jacoby matrix and its determinant is given by
jJj = U
i
11(egi( ) ; ijegj( )) ijvi00(egi( ) + ijegj( )) jivj00(egj( ) + jiegi( )) U11j (egj( ) ; jiegi( ))
: (6)
5 If this last expression is positive, then the game played by each jurisdiction is supermodular as noted by Topkis (1998) and at least one equilibrium exists.
Generally, the sign of jJj remains indeterminate, since it does not rely on the sign of the Hessian matrix of a single optimisation problem as Caputo (1996) emphasises it. Thus, without additional assumptions about the stability or uniqueness of the Nash equilibrium, for instance, we cannot sign jJj. We then obtain the following Proposition:
Proposition 1 Under our assumptions, we have
(i) If the jurisdiction i is constrained by its wealth egi( ) > c 1(Ri) , a change in ij has
no e¤ ect on the level of provided public good in both jurisdictions;
(ii) If the jurisdiction j is constrained by its wealth, a change in ij has no e¤ ect on the level
of provided public good in jurisdiction j but increases (decreases) the level of public good in jurisdiction i if public goods are strategic complements (substitutes);
(iii) If no jurisdiction is constrained, an increase in the degree of spillover from jurisdiction j to i ( ij) involves a variation in the same (opposite) sense in both jurisdictions if local public
goods are strategic complements (substitutes).
Proof. (i) If gi ( ) = gi; it is then obvious that @gi( )
@ ij = 0 and
@gj( )
@ ij = 0 from di¤erentiation
of (3) with respect to ij.
(ii) If gj( ) = gj and gi ( ) =egi( ), then we have @gj( ) @ ij = 0 which yields @gi ( ) @ ij = ijgjv 00 i gi+ ijgj @2Ui(g i; ijgj) @g2 i :
(iii) If gi ( ) =egi( ) and gj ( ) =egj( ), we obtain from (5)
@egi( ) @ ij @egj( ) @ ij = ji ijegj ( ) vi00(egi( ) + ijegj( )) jJj 2 v00j (egj( ) + jiegi( )) U11j (egj( ) ; jiegi( )) :
The parameter ij may represent, for instance, the degree of ‘proximity’that jurisdiction i
experiences from the local public good provided by jurisdiction j. This ‘proximity’ will be expressed in geographic or ethnic terms in our empirical works. An increase in ij would
induce two e¤ects on gi: one direct and one indirect (strategic) e¤ect through the level of
public good provided by the neighbour (gj). If jurisdiction i is constrained by its wealth, any
change in ij does not a¤ect the equilibrium value. Indeed, neither the direct e¤ect, nor the
strategic e¤ect would come into play, since the level of public spending in this jurisdiction is at the corner. If it is the other jurisdiction, namely j, which is constrained, then only the direct e¤ect of ij would play on gi. An increase of ij induces an increase (decrease) in
gi local public expenditures are strategic complements (substitutes). Remember that in the
presence of strategic complements, the marginal utility of local public good increases in the level of the other local public good or in the spillover e¤ect.
Finally, if no jurisdiction is constrained, then both e¤ects are at play. Without additional assumptions, however, particularly on the sign of jJj, we can only conclude that an increase in
ij would induce an increase or a decrease of levels of local public goods in both jurisdictions
in the presence of strategic complements. Otherwise, that is in the presence of strategic substitutes, an exogenous change of ij would involve opposite variations among jurisdictions.
Following Dixit (1986) or Kolstad and Mathiesen (1987), we specify the uniqueness and the stability of the Nash equilibrium through the following assumption:6
jJj > 0: (7)
This relationship allows us to pinpoint the sense of variations resulting from the two kinds of parameter changes. We obtain the following Proposition:
Proposition 2 Under our assumptions and (7), an increase in the degree of spillover from jurisdiction j to i ( ij) involves an increase (decrease) of the level of public goods in both
jurisdictions if local public goods are strategic complements (substitutes). Proof. Immediate from (5).
Assuming the uniqueness of the Nash equilibrium allows us to specify the sense of de-viation of public spending when the degree of spillovers varies. To sum up our theoretical results, we showed that spillovers among jurisdictions involve strategic behaviours, which in turn lead to a competition process. Without restricting the nature of such a competition, we estimated to what extent the level of provided public good is a¤ected by a deviation in the degree of spillovers.
Our theoretical framework yields the following implications: (1) the provision of local public goods with spillovers may induce two cases: (a) strategic interactions in terms of
6
If we adopt the contraction approach (see Vives, 1999), the condition of equilibrium uniqueness involves U11i (gi; ijgj) + v12i (gi; ijgj) < 0;
complements or substitutes (classical result), (b) no strategic interactions owing to the in-su¢ cient level of …scal resources and despite positive externalities (largely ignored by the relevant literature); (2) under the presence of strategic complements, the expected quantity of public goods in jurisdiction i will positively depend on the level of public good allocated by jurisdiction j; (3) in the presence of strategic substitutes, an opposite relationship is ex-pected; (4) the sign of such a strategic interaction is not determined a priori, since di¤erent measures of contiguity may be put forward (geographical or ethnic contiguity).
3
Empirical evidence of public spending interactions in a less
developed country: the case of Benin
Our empirical analysis focuses on Benin, a young democracy, which is quite representative of the Sub-Saharan region. After a brief overview of this country, we test the existence of strategic interactions among local governments’ spending with the spatial econometric method. We then examine if a change in these interactions occurs during election years.
3.1 Benin overview
With a per capita income of US$ 570 in 2007 and a ranking of 163 out of 177 countries,7 Benin remains one of the poorest countries of the world. It is ethnically fragmented.8 Since
its independence on 1 August, 1960, the history of Benin has been chaotic. A succession of military governments ended in 1972 with the last military coup led by Mathieu Kerekou and the establishment of a government based on Marxist-Leninist principles. A move to democracy began in 1989. Two years later, free elections ushered in former Prime Minister Nicephore Soglo (a former World Bank o¢ cial) as President. Kerekou regained power in 1996 in elections fraught with irregularities and won subsequent elections in 2001. Having served two terms and being over 70, he was ineligible to run in the presidential elections of 2006. He was succeeded by Thomas Boni Yayi, an independent political outsider who had previously headed the West African Development Bank. In March 2007, President Yayi
7 Human Development Report (2007). 8
Among the 42 ethnic groups, the most prominent are the Fon and the Adjas in the south, the Baribas and the Sombas in the north and the Yorubas in the south-east.
Boni strengthened his position following the legislative elections in which his coalition, ‘Force Cauris pour un Bénin Emergent (FCBE)’won the largest number of seats (35 out of 83) and negotiated a pro-government majority in Parliament with seven minor parties and coalitions joining the FCBE.
This democratic process was accompanied by a huge transformation of the political and administrative organisation. Since 1998, Benin has undergone a decentralisation process that became e¤ective with local elections in 2002. The second local elections took place in 2008.9 As depicted in Figure 1, Benin is divided into twelve départements which are subdivided into 77 communes, which are further divided into 546 districts. Départements are managed by a representative of the central government. In contrast, communes are ruled by a local government directly elected by inhabitants. The average size of communes, presented in the following map, numbers about 90,000 inhabitants.
Insert Figure 1
In January 1999, law 97-029 de…ned the transferred competencies from the centre to the 77 communes. Theoretically, competencies of Beninese communes range from elementary school to economic development and include transport infrastructure, environment (hygiene), health and social goods, tourism, security or market-place management. As in most of African countries, however, this competences’transfer was not accompanied by an adequate transfer of resources. Beninese communes are characterised by a very low level of resources (only about 4.5% of country tax revenues or equivalently 0.7% of GDP).10 Moreover, important inequalities appear between communes: the resources of the ten poorest communes represent 5 per cent of the resources of the …ve richest ones.
9 The …rst round of municipal elections held on 15 December, 2002 and the second round on 19 January, 2003 with an average rate of turnout estimated at 70 per cent.
1 0
Local resources are mainly communes’own resources (about 70%). Property taxes and licences to exercise a trade or profession (‘patente’) represent 90% of local tax revenues (see Chambas, Brun, and Rota Graziosi, 2008 for a detailed analysis of local …scal resources in Sub-Saharan Africa, particularly in Benin). Retroceded taxes, which come from transfers of state tax revenue to local governments, account for about 10% of local resources.
3.2 Econometric framework
Horizontal interactions entail a …scal reaction function that depicts how the decision variable for a given jurisdiction depends on the decisions of other jurisdictions. To test the existence of such functions, we have to test spatial dependence in a panel data framework. We consider a speci…cation in the most general form in which commune i public expenditure in year t, de…ned by Git, is a function of its neighbours’same public choice, Gjt. Moreover, we allow
Git to depend on a vector of speci…c controls Xit and we include a commune-speci…c e¤ect, i.11 This gives the following speci…cation:
Git =
X
ij
ij:Gjt+ :Xit+ i+ "it; (8)
where i = 1; : : : ; n denotes a commune and t = 1; : : : ; T a time period, ; and are unknown parameters and "ita random error. Since there are too many parameters ij to be
estimated, the usual procedure is to consider:
Git = :Ajt+ :Xit+ i+ "it; (9)
where Ajt =
X
ij:Gjt. Git, the vector of public spending in a local government i at time t
depends on Ajt, the weighted average vector of public spending in the set of the other local
governments j at time t and a set of speci…c controls Xit.
We explore a variety of weighting schemes to allow di¤erent patterns of spatial interac-tions. We are then able to examine the nature of the neighbouring e¤ects and to discuss the de…nition of distance. First, we have chosen a common geographical de…nition of neigh-bouring communities based on a contiguity matrix where the value one is assigned if two jurisdictions share the same border and zero otherwise. This scheme is given by the weight matrix neigh. Contiguity is commonly used in the relevant empirical literature. Second, we de…ne an ethnic weight matrix ethn based on the ethnic proximity of communes’ in-habitants. Ethnic proximity is de…ned as the probability that two individuals randomly drawn from two distinct communes are from the same ethnic group. In doing so, we test
1 1All time-invariant community characteristics, observed or unobserved can be represented by community-speci…c intercepts.
the existence of spending interactions between communes which are similar with respect to ethnicity. The …rst two weighting schemes are based on the idea that communes follows communes close to them either geographically or with similar socio-economic structure.12
Then, we consider a possible weighting scheme in which weights are assumed to be identi-cal for all communes j ( uni). This uniform weighting scheme will give us a useful benchmark to ascertain whether the potential observed spatial auto-correlation can be attributed to a substantive strategic interaction process and not to a ‘common intellectual trend’.13 More-over, following Lockwood and Migali (2009), we compare ethnic and contiguity weights with ‘placebo’weights, plac, which are chosen in a random way. We generate a random number distributed between zero and one for each commune. Then, the weight assigned between two communes is the di¤erence between its random numbers. Evidence of strategic interactions with this placebo matrix would indicate some general positive correlations between all public spending owing to omitted common shocks.14
Finally, we present a dynamic version of the model. We introduce the lagged dependent variable, Git 1 , as a right-hand side in order to take into account the persistency in public
expenditure (see Veiga and Veiga, 2007). The dynamic model can be written as follows:
Git= :Git 1+ :Ajt+ :Xit+ i+ "it: (10)
By estimating this reaction function we are confronted with important econometric issues as described by Brueckner (2003). First, because of strategic interactions, public expenditure in di¤erent jurisdictions is jointly determined. Therefore, neighbours’decisions are endogenous and correlated with the error term "itand ordinary least squares estimation of the parameters
is inconsistent, requiring alternative estimation methods based on the instrumental variables
1 2 In the welfare competition literature, jurisdictions are likely to take into account inhabitants’ mobility in the neighbouring communities induced by an increase in its own welfare. In the yardstick competition literature, residents consider neighbouring jurisdictions— on which they are likely to get better information— as a yardstick to compare the performance of their incumbent. It is easy to understand that ethnic as well as geographic proximity could explain such interactions.
1 3 Indeed, our theory relies on the common assumption that local governments behave strategically with each other. Alternatively, Manski (1993) suggests that …scal choices appear to be interdependent not because jurisdictions behave strategically but because they actually follow a ‘common intellectual trend’that drives …s-cal choices in the same directions. Thus, we extend our analysis to determine whether these interdependencies are owed to strategic interactions or only to a common trend.
1 4
Weights are normalised so that their sum equals unity for each i for all weight matrices. This assumes that spatial interactions are homogeneous: each neighbour has the same impact on the commune.
method (IV) or on maximum likelihood (ML).15
Second, the omission of explanatory variables that are spatially dependent may generate spatial dependence in the error term, which is given by: "it= "it+vit:16 When spatial error
dependence is ignored, estimation can provide false evidence of strategic interaction. To deal with this problem, one possible approach is to use the ML estimator, taking into account the error structure (see Case, Rosen, and Hines, 1993) or the IV method which yields consistent estimations even with spatial error dependence (see Kelejian and Prucha, 1998). Brueckner (1998), Brueckner and Saavedra (2000), Saavedra (2000) and Foucault, Madies, and Paty (2008) use the tests of Anselin, Bera, Florax, and Yoon (1996) to verify the hypothesis of error independence.17
Lastly, since we introduced the lagged dependent variable as a right-hand side to consider the autoregressive component of the time series, the previous estimators are inconsistent (Nickell, 1981). We propose to use the GMM System estimator after verifying the hypothesis of error independence and estimating the static model with the ML estimator. The GMM estimators allow us to control for both unobserved country-speci…c e¤ects and potential endogeneity of the explanatory variables. The GMM System estimator combines in one system the regressions in di¤erence and the regressions in level. Basically, Blundell and Bond (1998) show that this extended GMM estimator is preferable to that of Arellano and Bond (1991) when the dependent variable, the independent variables, or both are persistent.18
The …rst challenge of our empirical work is to determine that the observed spatial auto-correlation can be attributed to a substantive strategic interaction process and not to exoge-nous correlations in omitted jurisdictional characteristics or common shocks to local …scal policy. To go beyond this issue, we introduce time dummies to capture shocks in each period
1 5
With the IV approach, a typical procedure is to use the weighted average of neighbours’control variables as instruments (see Kelejian and Prucha, 1998). The ML method consists in using a non-linear optimisation routine to estimate the spatial coe¢ cient (see Brueckner, 2003).
1 6 We note that the use of a panel helps to eliminate spatial error dependence which arises through spatial autocorrelation of omitted variable, since the in‡uence of such variables is partly captured in community-speci…c intercept terms.
1 7 These tests are not contaminated by uncorrected spatial error dependence and may detect the presence of spatial lag dependence.
1 8 Arellano and Bond (1991) present a …rst-di¤erence GMM estimator. There are, however, conceptual and statistical shortcomings with this estimator as the …rst di¤erence estimator exacerbates the bias owed to errors in variables (Hausman, Hall, and Griliches, 1984). Thus, we use an alternative system estimator that reduces the potential biases and imprecision associated with the usual di¤erence estimators (Arellano and Bover, 1995 and Blundell and Bond, 1998) and also greatly reduces the …nite sample bias (Blundell, Bond, and Windmeijer, 2000).
which are common to all local governments and other speci…c controls. We then have
Git= :Git 1+ :Ajt+ 1:Dit+ 2:Ndt+ i+ t+ "it; (11)
where Dit is the population density of jurisdiction i on year t, which captures the possibility
of scale economies in public spending,19 Ndt is the percentage of men who have a job in
département d on year t. The employment rate is an indicator of the economic conjuncture and allows the partial control of common shocks which would be spatially correlated.
We extend our analysis to test the e¤ect of partisan a¢ liation and the …scal behaviour of local policymakers in an election period. Until he stepped down in March 2006, Mathieu Kérékou enjoyed strong support in the north of the country (Alibori, Atacora, Borgou and Donga) which is considered as his …ef.20 When Boni Yayi was elected, he a¢ rmed his desire for political openness. Municipal elections took place in April 2008. Parties allied with the President won a majority of local council seats, but the most of municipalities in the south were won by opposition parties. Departments that can be considered as …efs are concentrated in the south of the country, in particular, Atlantic, Collines and Mono. Finally, over the whole time period, about 40% of the departments have shared the same partisan a¢ liation as the President in o¢ ce. To capture this e¤ect (having the same partisan a¢ liation as the president in o¢ ce), we extend our analysis by including dummy variables for political a¢ liation. We also introduce dummy variables for election years to test opportunistic behaviour of local policymakers.21 It follows that:
Git= :Git 1+ :Ajt+ 1:Dit+ 2:Ndt+ 3:Oct+ 4:T
+ 5:P Rit+ 6:Et 1+ 7:Et+ 8:Et+1+ i+ "it;
(12)
where T is a trend variable, which accounts for the common trend in local governments, Oct is a trade openness measure at country level which controls for macroeconomic common
shocks, since developing countries are vulnerable to foreign trade.22 Moreover, it could have
1 9
Population density is the number of inhabitants per square kilometre. Per capita expenditures and population density are in log. Per capita expenditures are corrected for in‡ation.
2 0
Kérékou was born in 1933 in Kouarfa, in the north-west of the country. 2 1
We can note that we have a small number of observations for election years, so, results will only give us an indication of the existence of opportunistic behaviour and it will be di¢ cult to come to a …rm conclusion.
2 2
many e¤ects on public …nances.23 P Rit is a dummy variable which takes the value one if
the local government i has the same political a¢ liation as the President in o¢ ce and zero otherwise, Et 1 is a dummy variable, which takes the value one the year before the election
and zero otherwise, Etis a dummy variable, which takes the value 1 the year of the election
and zero otherwise, Et+1 is a dummy variable, which takes the value one the year after the
election and zero otherwise.24
With respect to our theoretical model, we see that 6= 0 is equivalent to the existence of some strategic interactions and that local governments are not constrained by their wealth, on average. Moreover, if > 0 ( < 0), that means an increase in the degree of spillover between jurisdictions involves a variation in the same (opposite) sense of the level of local public goods, we can conclude that local public goods are strategic complements (substitutes). To re…ne this result, we will also empirically test the e¤ect of wealth constraints on the existence of public spending interactions. Indeed, our theoretical model highlights that strategic interactions may be restricted by the extreme poverty of some local governments. To test the hypothesis that interactions are stronger when local governments are less constrained by their wealth, we use an indicator of …scal autonomy,25 denoted by Fit. We have:
Git= :Git 1+ :Ajt+ ':AFit+ 1:Dit+ 2:Ndt+ 3:Oct+ 4:T
+ 5:P Rit+ 6:Et 1+ 7:Et+ 8:Et+1+ 9:Fit+ i+ "it;
(13)
where AFit= Ajt Fit. If …scal autonomy actually reinforces strategic interactions, we should
observe the coe¢ cient of AFit being more signi…cant and higher than the coe¢ cient of Ajt
(' > ). Moreover, as policymakers should interact with their neighbours only if they can choose the level of their local resources, may no longer be signi…cant. If that is the case, we will conclude that strategic interactions are contingent on a certain degree of …scal autonomy and that strategic interactions exist only among unconstrained local governments.
2 3
Rodrik (1998) shows that there is a positive correlation between an economy’s exposure to international trade and the size of its government because government spending plays a risk-reducing role in economies exposed to a signi…cant amount of external risk.
2 4
Descriptive statistics are presented in Table 2.
2 5 A usual approximation of …scal autonomy is the ratio of jurisdictions’ own resources to their total resources.
3.3 Results
Our dataset covers the two local elections (2002 and 2008) and the 77 communes of Benin. Data for communes’ current expenditure come from Beninese Ministry of Finances and Economy. The other control variables are drawn from WDI (World Development Indica-tors), Afrobarometers, Demographic and Health Surveys provided by the National Institute of Statistic and Economic Analysis of Benin and 77 monographs realised for the Mission of Decentralisation.
First, as we have noted before, it is important to investigate whether the policy of a local jurisdiction is actually correlated with the policies of other jurisdictions and whether spatial lag or spatial error dependence are the more likely sources of correlation. Anselin, Le Gallo, and Jayet (2006) have proposed two in-depth tests based on the Lagrange Mutiplier principle for panel data that indicate the most likely source of spatial dependence (spatial lag or spatial error dependence). We compute the same robust tests for spatial lag dependence and for spatial error dependence which require only the OLS residuals from a non-spatial model. Therefore, we …rst estimate (12) using OLS for both contiguity and ethnic matrix without taking into account the in‡uence of public spending in other jurisdictions ( = 0) and the lagged value of our dependent variable ( = 0). The estimation results are shown in Table 3. Spatial tests indicate the presence of spatial lag dependence for public spending but not the existence of spatial error dependence for both matrices.
Second, since the hypothesis of error independence is veri…ed, we estimate (12) using ML with speci…c-e¤ects for both contiguity and ethnic matrices without taking into account the lagged value of our dependent variable ( = 0), but we introduce the in‡uence of the expenditure set by other jurisdictions ( 6= 0). The estimation results are shown in Table 4. The coe¢ cient of the weighted average vector of public expenditure in the set of the other local governments is always signi…cant and positive for both matrices.26
Finally, we estimate with the GMM System the dynamic model (12) for all weighting
2 6
In these …rst estimations, departments’ employment rate and population density coe¢ cients are not signi…cant. There are no economies of scale in the studied public spending. The trade openness indicator coe¢ cient is signi…cantly positive. Dummies associated with election years indicate, a priori, an opportunistic use of public spending during the year before the election. Indeed, current expenditure seems to increase during the year before the election and to decrease after. Lastly, a commune governed by a local government which has the same political a¢ liation as the president in o¢ ce has higher public expenditure.
schemes, taking into account the lagged value of our dependent variable ( 6= 0). We adopt the assumption of weak exogeneity of employment rates and trade openness, in the sense that they are assumed to be uncorrelated with future realisations of error terms. The weighted average vector of per capita public spending of other local governments is, as noted before, suspected of endogeneity. Other explanatory variables27are assumed to be strictly exogenous. The lagged levels of variables are used as instruments in the regressions in level as well as in the regressions in di¤erence. We collapse instruments and limit the number since too many instruments lead to inaccurate estimation of the optimal weight matrix, biased standard errors and, therefore, incorrect inference of overidenti…cation tests (see Roodman, 2009).28 Table 5 displays estimation results.
Insert Table 5
We focus our attention on (1) (2) (3) (4) and (5), that is, the GMM System estimations for contiguity, ethnic, uniform and placebo matrices. We can …rst note that orthogonality conditions are correct and that the coe¢ cient on the lagged dependent variable is always signi…cant and positive.29 As the coe¢ cient on lagged public spending provides an estimate varying between 0.411 and 0.629, the result indicates some level of persistency in public expenditure which is likely to change slowly over time. Moreover, it con…rms the consistency of the autoregressive speci…cation. After correction for endogeneity, the coe¢ cient of the weighted average vector of public expenditure in the set of the other local governments is signi…cant at least at 1% level and positive for ethnic and contiguity matrices.
2 7 Population density, time dummies, election dummies, partisan a¢ liation, trends. 2 8
The lags of at least two earlier periods for weak exogenous variables and three earlier periods for en-dogenous variables are used as instruments. The lagged dependent variable is instrumented by lags of the dependent variable from at least two earlier periods. We use two lags for endogenous and weak exogenous variables.
2 9
The consistency of the estimator depends on whether lagged values of explanatory variables are valid instruments. The criteria for the selection of instruments are two speci…cation tests (Arellano and Bond, 1991). With the Hansen test, we test the null hypothesis of the overall validity of instruments’orthogonality conditions (over-identifying restrictions). The second test is about the serial correlation of residuals. It exam-ines the hypothesis that the residuals from the …rst-di¤erentiated estimating equation are not second-order correlated. First, we test the null hypothesis of no …rst-order serial correlation of di¤erentiated residuals (AR (1) test) and second, the null hypothesis of no second-order serial correlation of di¤erentiated residuals (AR (2) test). If we reject the null hypothesis of no …rst-order serial correlation and do not reject the null hypoth-esis of no second-order serial correlation of di¤erentiated residuals, the residuals are serially uncorrelated and we conclude that orthogonality conditions are correct. In our case, both statistics con…rm the validity of the instruments used.
At this stage, we cannot conclude that there are strategic spending interactions as Manski (1993) suggested. If this is only a common trend that drives local governments in the same direction, we should expect a positive sign of the interaction coe¢ cient but not a speci…c pattern in the type of communes with which to interact. As the coe¢ cient of interaction with the uniform matrix is signi…cant (column (3)), we can say that local governments follow, in part, a common trend. When, however, we estimate the coe¢ cient for the contiguity matrix after checking for common trends in column (4), the neighbouring interaction coe¢ cient remains signi…cantly positive. Beyond the common trend, local governments interact with each other. Moreover, the placebo matrix (column (5)) does not show any evidence of positive strategic interactions. This shows that the phenomenon of …scal interactions detected with geographical and ethnical matrices is not an artefact of the estimation procedure. Note that we have also ascertained that before 1998, the beginning of the decentralisation process, there were no strategic interactions (see Table 6).30
Hence, we can conclude that there are strategic interactions between neighbouring juris-dictions and that these interactions also exist between communes that are close with respect to ethnic composition. Public expenditure seems to be a strategic complement. An aver-age public spending increase of 10% in the neighbouring municipalities induces an increase of around 6.2% in local primary expenditure. We …nd a smaller coe¢ cient (5.1%) for the ethnic matrix, suggesting the existence of stronger interactions among neighbouring com-munes than among ethnically close ones. Since di¤erent ethnic groups are located in close geographical areas, we can assume that the geographic matrix overlies the ethnic matrix. We estimate the coe¢ cient for the ethnic matrix after checking for geographical interactions in column (6), which remains signi…cant and stable. Therefore, even if geographical distance remains more relevant for explaining interjurisdictional competition, interactions also exist among ethnically close communes.
Finally, regarding our theoretical results, we can conclude that current expenditure is a strategic complement, since an increase in the degree of spillover involves a variation in the same sense in di¤erent jurisdictions. Moreover, jurisdictions seem not to be constrained by their wealth, on average.
3 0 We run the same regressions as previously for the period 1994 to 1998. The coe¢ cients of interaction with all matrices are not signi…cant.
In columns (7) and (8), we test the robustness of these results by estimating the same econometric model with alternative matrices. The neigh2 matrix, in which the value of one is assigned if two communes belong to the same département and zero otherwise, is a proxy of the contiguity matrix. Indeed, two communes that belong to the same département are generally close. The ethn2 matrix is de…ned as follows: the value one is assigned if two communes have the same dominant ethnic group and zero otherwise. The coe¢ cient of the weighted average vector of public expenditure in the set of the other local governments remains positive and signi…cant at the 5% level for the neigh2 matrix but only at 10% for the ethnic matrix ethn2. Additionally, these estimations tend to con…rm the existence of opportunistic behaviour of local governments and the e¤ects of partisan a¢ liation.
We …nd a positive and signi…cant sign for the parameter associated with the employment rate, which indicates the e¤ect of economic conjuncture. The trend variable remains, as expected, signi…cant and negative. Indeed, per capita public expenditure has decreased by 75% over the period despite little growth between 2004 and 2006. There seems to be opportunistic behaviour of local jurisdictions since dummies associated with the pre-election year indicate an increase in public spending.31 Thus, we …nd some evidence of a political budget cycle for current expenditure in this young democracy.32 As we noted before, however, it is relatively di¢ cult to determine since we have a small number of observations. In addition, it appears that having a local government which has the same political a¢ liation as the President in o¢ ce is likely to increase public expenditure. Indeed, the coe¢ cient of the dummy variable that indicates whether the local government has the same political a¢ liation as the President in o¢ ce is always signi…cant.33
In columns (9) and (10), we test the e¤ect of wealth constraints on the existence of pub-lic spending interactions by estimating equation (13) for both matrices. As expected, the
3 1
To understand the sign of the coe¢ cient associated with the election year dummy, one must refer to the election calendar and budget votes. Local elections took place at the beginning of March and the de…nitive budget must be adopted before 31 March. Therefore, in the year before the elections, decision-makers increase current expenditures and decrease them the year after, since the de…nitive budget is approved.
3 2 Shi and Svensson (2006) have shown that political budget cycles are much larger in young democracies than in developed countries, particularly in countries with weak institutional constraints on incumbents’ rent-seeking ability.
3 3
These municipalities bene…t from higher state subsidies.
Note that the parameter associated with population density is positive but not always signi…cant. This is also the case for the coe¢ cient of trade openness, which is negative but not always signi…cant. As some of these e¤ects o¤set each other, it is often di¢ cult to predict the net e¤ect of trade openness on public expenditure which is not signi…cant.
coe¢ cient of the interaction variable between the neighbours’ spending decisions and the indicator of …scal autonomy (') is positive and signi…cant. We can thus conclude that inter-actions are stronger when local governments have a more signi…cant share of their own local resources. Furthermore, since the coe¢ cient for strategic interaction alone ( ) is no longer signi…cant, strategic interactions are contingent on …scal autonomy: strategic interactions exist only among local governments which have a certain degree of autonomy.
At this stage, our results suggest that decentralisation has induced interjurisdictional competition. Indeed, there are strategic interactions between Beninese local governments with regard to current expenditure that appears to be strategic complement. These inter-dependences exist between neighbouring communes but also between those which are close in terms of ethnic composition. Finally, we have found a variation of public expenditure in the same sense between close local jurisdictions: local public goods are strategic comple-ments and, on average, local jurisdictions are not constrained by their wealth. Moreover, our results con…rm that strategic interactions are contingent on …scal autonomy. Estimations tend to show that local governments adopt opportunistic behaviour before elections. Lastly, communes where local government has the same political a¢ liation as the President enjoy higher public spending.
3.4 What happens in electoral years?
This section is really an empirical extension of our theoretical model, in which perfect infor-mation is assumed. Electoral years implicitly refer to a yardstick competition model, which is based on the informational asymmetry among local elected decision-makers and jurisdictions’ populations. Indeed, in this model, voters can use the performance cues of other governments as a benchmark to judge whether their representative wastes resources and deserves to re-main in o¢ ce. During an electoral year, we may expect that political campaigns increase interactions among communes, since more information is available on the …scal policies of local decision-makers, reinforcing the e¤ect of yardstick competition.
Here, we evaluate the e¤ects of electoral pressure on inter-jurisdictional interactions. The challenge consists in evaluating the real electoral pressure induced by decentralisation by identifying the e¤ect of elections on interjurisdictional competition. We consider the election
cycle variables to test the hypothesis that interactions may be stronger in election periods. A straightforward way to test this is to interact the neighbours’ spending decisions (Ajt)
with the election years dummy, EY (Et 1 and Et) and estimate two di¤erent interaction
coe¢ cients, one for years of election (Ajt EY ) and one for all the other periods, N EY
(= 1 EY ), (Ajt N EY ).
Git= Sit 1+ 0:(Ajt EY ) + 00:(Ajt N EY ) + 1:Dit+ 2:Ndt
+ 3:Oct+ 4:T + 5:P Rit+ 6:EY + 7:N EY + i+ "it;
(14)
where EY = Et 1 + Et and N EY = (1 (Et 1 + Et)). If elections actually reinforce
the exposure of jurisdictions, we should observe the coe¢ cient of (Ajt EY ) being more
signi…cant and higher than the coe¢ cient (Ajt N EY ) as policymakers should be particularly
concerned about their neighbours’decisions during election periods.
Insert Table 7
We note that signi…cant coe¢ cients have the same sign as in previous estimations and that statistics con…rm the validity of used instruments. Therefore, we focus our analysis on the comparison of the interaction term coe¢ cients. As expected, the coe¢ cient is slightly higher and more signi…cant in election periods than in other periods with contiguity and ethnic matrices. Therefore, current expenditure settings appear to be a little more dependent on neighbours during election periods. We complete our analysis with Wald tests to test how coe¢ cients during election periods are signi…cantly di¤erent from those in other periods. These tests do not indicate that the election year interaction coe¢ cients are signi…cantly di¤erent at the 10% level from the non-election ones. Thus, it is not a de…nite fact that yardstick competition is the main channel of communes’interactions.
4
Conclusion
Decentralisation has been advocated to improve the performance of the public sector by stimulating interjurisdictional competition. The originality of our paper consists in reason-ing from an African case in which decentralisation has been recently implemented. One may
expect that …scal interactions in a developing country where local public resources are scarce would remain modest. Our paper shows that this is not the case. Indeed, for the …rst time, we provide a new contribution in the …scal federalism literature by ascertaining that decen-tralisation entails interjurisdictional interactions in an African country. These interactions are not a common trend. They exist not only among neighbouring local jurisdictions but also among communes which are close in terms of ethnic composition. We also emphasise both the in‡uence of partisan a¢ liation and the opportunistic behaviour of local governments before elections. Finally, Benin which has recently experienced a decentralisation process seems to be as concerned with …scal strategic interactions as developed democracies.
Acknowledgement 1 We are grateful to the National Bureau of Economic Research (African Successes)and the Social Sciences and Humanities Council of Canada (SSHRC) for …nancial support. We thank seminar participants at the Eighth Workshop on ‘Spatial Economet-rics and Statistics’ in Besançon, the 2009 International Institute of Public Finance Annual Congress in Cape Town and the 2010 Public Economic Workshop at MSE Paris 1, for helpful comments, discussions, and encouragements. All remaining errors are ours.
References
Akin, J., P. Hutchinson, and K. Strumpf (2005): “Decentralisation and government provision of public goods: The public health sector in Uganda,”The Journal of Devel-opment Studies, 41(8), 1417–1443.
Alderman, H. (2002): “Do local o¢ cials know something we don’t? Decentralization of targeted transfers in Albania,” Journal of Public Economics, 83(3), 375–404.
Anselin, L., A. K. Bera, R. Florax, and M. J. Yoon (1996): “Simple diagnostic tests for spatial dependence,” Regional Science and Urban Economics, 26(1), 77–104. Anselin, L., J. Le Gallo, and H. Jayet (2006): “Spatial econometrics and panel data
models. In L. Matyas P. Sevestre (Eds.),” Handbook of panel data econometrics. Dor-drecht: Kluwer.
Arellano, M., and S. Bond (1991): “Some tests of speci…cation for panel data: Monte Carlo evidence and an application to employment Equations,” Review of Economic Studies, 58(2), 277–97.
Arellano, M., and O. Bover (1995): “Another look at the instrumental variable estima-tion of error-components models,” Journal of Econometrics, 68(1), 29–51.
Arze, J., J. Martinez-Vasquez,andR. Puwanti (2008): “Local government …scal compe-tition in developing countries: the case of Indonesia,”Urban Public Economics Review, pp. 13–45.
Bardhan, P. (2002): “Decentralization of governance and development,” Journal of Eco-nomic Perspectives, 16(4), 185–205.
Bardhan, P., and D. Mookherjee (2005): “Decentralizing antipoverty program delivery in developing countries,” Journal of Public Economics, 89(4), 675–704.
Barro, R. J. (1990): “Government spending in a simple model of endogenous growth,” Journal of Political Economy, 98(5), S103–26.
Bird, R. M., and E. Rodriguez (1999): “Decentralization and poverty alleviation. In-ternational experience and the case of the Philippines,” Public Administration and Development, 19, 299–319.
Blundell, R., andS. Bond (1998): “Initial conditions and moment restrictions in dynamic panel data models,” Journal of Econometrics, 87(1), 115–143.
Blundell, R., S. Bond, and F. Windmeijer (2000): “Estimation in dynamic panel data models: improving on the performance of the standard GMM estimator,”IFS Working Papers W00/12, Institute for Fiscal Studies.
Brueckner, J. K. (1998): “Testing for strategic interaction among local governments: the case of growth controls,” Journal of Urban Economics, 44(3), 438–467.
(2003): “Strategic interaction among governments: an overview of empirical studies,” International Regional Science Review, 26(2), 175–188.
Brueckner, J. K., andL. A. Saavedra (2000): “Do local governments engage in strategic property-tax competition?,” Econometric Society World Congress 2000 Contributed Papers 0357, Econometric Society.
Bucovetsky, S. (2005): “Public input competition,”Journal of Public Economics, 89(9-10), 1763–1787.
Bulow, J. I., J. D. Geanakoplos,andP. D. Klemperer (1985): “Multimarket oligopoly: strategic substitutes and complements,”Journal of Political Economy, 93(3), 488–511. Caputo, M. R. (1996): “The envelope theorem and comparative statics of Nash equilibria,”
Games and Economic Behavior, 13(2), 201–224.
Case, A. C., H. S. Rosen, and J. J. Hines (1993): “Budget spillovers and …scal policy interdependence : Evidence from the states,”Journal of Public Economics, 52(3), 285– 307.
Chambas, G., J.-F. Brun, and G. Rota Graziosi (2008): “Local public …nance in Sub-saharan Africa,” Funding agency: French Foreign O¢ ce.
Chavis, L. (2009): “Decentralizing development: allocating public goods via competition,” Journal of Development Economics, 12(4).
Dixit, A. K. (1986): “Comparative statics for oligopoly,” International Economic Review, 27(1), 107–22.
Faguet, J.-P. (2004): “Does decentralization increase government responsiveness to local needs?: Evidence from Bolivia,” Journal of Public Economics, 88(3-4), 867–893. Foucault, M., T. Madies, and S. Paty (2008): “Public spending interactions and local
politics. Empirical evidence from French municipalities,”Public Choice, 137(1), 57–80. Galasso, E., and M. Ravallion (2005): “Decentralized targeting of an antipoverty
pro-gram,” Journal of Public Economics, 89(4), 705–727.
Hausman, J., B. H. Hall, and Z. Griliches (1984): “Econometric models for count data with an application to the patents-R&D relationship,” Econometrica, 52(4), 909–38. Keen, M., andM. Marchand (1997): “Fiscal competition and the pattern of public
spend-ing,” Journal of Public Economics, 66(1), 33–53.
Kelejian, H. H., and I. R. Prucha (1998): “A generalized spatial two-stage least squares procedure for estimating a spatial autoregressive model with autoregressive distur-bances,” The Journal of Real Estate Finance and Economics, 17(1), 99–121.
Klugman, J. (1997): “Decentralization: a survey from a child welfare perspective,”Innocenti Occasional Papers, Economic Policy Series iopeps97/6, UNICEF Innocenti Research Centre.
Kolstad, C. D., andL. Mathiesen (1987): “Necessary and su¢ cient conditions for unique-ness of a Cournot equilibrium,” Review of Economic Studies, 54(4), 681–90.
Lockwood, B., and G. Migali (2009): “Did the single market cause competition in excise taxes? Evidence From EU Countries,” Economic Journal, 119(536), 406–429.
Manski, C. F. (1993): “Identi…cation of endogenous social e¤ects: the re‡ection problem,” Review of Economic Studies, 60(3), 531–42.
Nickell, S. J. (1981): “Biases in dynamic models with …xed e¤ects,” Econometrica, 49(6), 1417–26.
Oates, W. E. (1972): “Fiscal Federalism,” New York: Harcourt Brace Jovanovich.
Prud’homme, R. (1995): “The dangers of decentralization,”World Bank Research Observer, 10(2), 201–20.
Redoano, M. (2007): “Fiscal interactions among European countries. Does the EU matter?,” CESifo Working Paper Series CESifo Working Paper No., CESifo GmbH.
Rodrik, D. (1998): “Why do more open economies have bigger governments?,” Journal of Political Economy, 106(5), 997–1032.
Roodman, D. (2009): “A note on the theme of too many instruments,” Oxford Bulletin of Economics and Statistics, 71(1), 135–158.
Saavedra, L. A. (2000): “A model of welfare competition with evidence from AFDC,” Journal of Urban Economics, 47(2), 248–279.
Salmon, P. (1987): “Decentralisation as an incentive scheme,” Oxford Review of Economic Policy, 3(2), 24–43.
Shi, M., and J. Svensson (2006): “Political budget cycles: Do they di¤er across countries and why?,” Journal of Public Economics, 90(8-9), 1367–1389.
Tiebout, C. M. (1961): “An economic theory of …scal decentralization, in: National Bureau Of Economic Research (Ed.),” Public Finances: Needs, Sources and Utilization. Topkis, D. (1998): Supermodularity and complementarity. Princeton University Press,
Princeton, New Jersey.
Veiga, L., and F. Veiga (2007): “Political business cycles at the municipal level,” Public Choice, 131(1), 45–64.
Vives, X. (1999): Olipoly Pricing. Old Ideas and New Tools. The MIT Press, Cambridge, Massachusetts.
A
Appendix
A.1 Figure and Tables
Table 1: Estimation results for the presence of scale economies - Speci…c e¤ects
Dependent variable: current expenditure of ‘commune’i (Gi;t)
Population density 2.540** (1.41)
Squared Population density 0.001*** (0.00)
Haussman test: p-value 0.34
Observations 429
R o b u s t s ta n d a rd e rro rs a re in b ra cke ts .* * * : c o e ¢ c ie nt s ig n i…c a nt a t 1 % le ve l, * * : a t 5 % le ve l, * : a t 1 0 % le ve l.
Table 2: Descriptive statistics
Variables Obs. Mean Std. dev. Min Max
Current expenditure 448 2915 10934 15.06 (Basilla) 123779 (Cotonou) Population density 378 334.94 1019.25 7.61 (Tangui.) 7684 (Cotonou) Employment rate 462 26.67 10.68 3.46 (Kandi) 59.40 (Cotonou) Trade openess 462 39.14 0.81 37.95 (2003) 40.20 (2008)
Partisan a¢ liation 462 0.38 0.48 0 1
T a b le 3 : E st im a ti o n re su lt s fo r L M te st s -S p ec i… c e¤ ec ts Dep en de n t v ari ab le : curren t ex p end itu re of ‘c om mu ne ’ i ( Gi; t ) W eigh tin g sc heme (1) nei g h (2) eth n P o p ulati on den sit y 0.21 6 (0. 19) 0.2 16 (0. 19) Emp lo y me n t rate 0.17 6*** (0.0 5) 0. 176*** (0. 05) T rade op en ne ss -0.0 26*** (0. 00) -0.0 26*** (0. 00) P a rti san A¢ lia tion 0.07 4 (0. 27) 0.0 74 (0.27) T re nd 0.05 9* (0.03) 0. 059* (0.03 ) Elec tion y ear t-1 0.11 4* (0.06) 0. 114* (0.06) Elec tion y ear t -1.467 *** (0.17 ) -1.46 7*** (0. 17) Elec tion y ear t+1 -0.497 *** (0.07 ) -0.49 7*** (0. 07) LMlag (p-v alue ) 13.3 3 (0.0 01) 11. 97 (0. 005) LMe rr (p-v alue ) 1.35 (0.25 ) 0. 60 (0.4 3) Obse rv atio n s 462 462 R o b u s t s t a n d a r d e r r o r s a r e in b r a c k e t s .* * * : c o e ¢ c ie n t s ig n i… c a n t a t 1 % le v e l, * * : a t 5 % le v e l, * : a t 1 0 % le v e l.
T a b le 4 : E st im a ti o n re su lt s w it h sp a ti a l la g d ep en d en ce -M L es ti m a to r Dep en de n t v ari ab le : curren t ex p end itu re of ‘c om mu ne ’ i ( Gi; t ) W eigh tin g sc heme (1) nei g h (2) eth n Sp end in g in ci ty j 0.2 55*** (0.0 7) 0. 443** (0. 19) P o p ulati on den sit y 0.02 5 (0. 06) 0.0 22 (0. 06) Emp lo y me n t rate -0.0 03 (0.01) -0.0 03 (0 .01) T rade op en ne ss 0.11 5** (0. 05) 0. 167*** (0.05 ) P a rti san A¢ lia tion 0.28 8** (0. 11) 0.2 44** (0. 11) T re nd -0.1 24** (0.05) -0.0 65** (0 .01) Elec tion y ear t-1 0.21 4** (0. 09) 0.1 69* (0.10) Elec tion y ear t -0.6 66*** (0. 19) -0.3 61 (0 .30) Elec tion y ear t+1 -0.5 68*** (0. 09) -0.5 49*** (0.1 0) Log-l ik eliho o d -206.5 4 -207. 57 N 462 462 R o b u s t s t a n d a r d e r r o r s a r e in b r a c k e t s .* * * : c o e ¢ c ie n t s ig n i… c a n t a t 1 % le v e l, * * : a t 5 % le v e l, * : a t 1 0 % le v e l.