Decentralized Water Treatment in Urban India, and the
Potential Impacts of Reverse Osmosis Water Purifiers
by
Catherine L. O'Connor
B. S. Civil/Environmental Engineering Lafayette College
Submitted to the Faculty in partial fulfillment of the requirements for the degree of Master of Science in Engineering and Management
at
Massachusetts Institute of Technology June 2016
Massachusetts Institute of Technology 2016. All Rights Reserved.
Signature red acted
Author: ... ...
S
g
a u e r d
cd
Catherine L. O'Connor System Design and Management Program May 20, 2016
Certified by: ...
Signature redacted
0~
Winter, VThesis Supervisor Assistant Professor, Depa ti of Mechanical Engineering
Signature redacted
A cce pte d by : ...Patrick Hale Director, System Design and Management Program
MASSAC HUES INSTITUTE
OF TECHNOLOGY
JUN 23 2016
LIBRARIES
ARCHIVES
Page intentionally left blank
Catherine L. O'Connor MIT SDM Thesis
Decentralized Water Treatment in Urban India, and the
Potential Impacts of Reverse Osmosis Water Purifiers
By
Catherine L. O'Connor
Submitted to the System Design and Management Program on May 20, 2016 in Partial fulfillment of the Requirements for the Degree of Master of Science in Engineering and
Management.
Abstract
The degrading water quality in India combined with reduced groundwater supplies and insufficient municipal water distribution has led to the adoption of household water purifiers across the country. These water purifiers are used to treat water for potable consumption (drinking and cooking), and include a range of technologies capable of treating contaminants found in municipal water, groundwater, or other supplemental sources. The purifiers vary in cost, and have varying levels of accessibility to different socio-economic groups. As of 2010, market studies estimated that water purifiers, and more specifically reverse osmosis (RO) units,
had not yet achieved a high level of diffusion across India, though sales were projected to greatly increase. More recent studies found levels of adoption for RO purifiers in certain urban areas growing above 50%, much higher than the 10% or less of households relying primarily on groundwater. Interviews conducted in January 2016 confirmed that households with a
municipal supply were treating their water with RO purifiers, so RO adoption has spread beyond homes with only groundwater as a source.
Though increased RO system diffusion may increase access to improved water quality, the purifiers require a reject line that discards 30 to 80% of the input water. The waste generated can be substantial, and for an average RO recovery of 20% treating 5.0 liters per capita per day drinking water, total up to 100 liters per household per day, 82.2 megaliters per day (MLD) within the city of Delhi, or even 2,340 MLD across all major urban areas of India if complete adoption occurs within the top two socio-economic groups. These volumes can amount to a
measurable fraction of the volume of groundwater that a city extracts to supplement its surface water supply, and the volume of wastewater that goes untreated due to insufficient infrastructure.
Policy and technology-based alternatives such as a water efficiency ranking program and the replacement of RO with electrodialysis, a more efficient desalination technology, align with government initiatives calling for higher efficiency and public participation, though a combined
program is likely needed to make household water treatment sustainable in the long-term.
Thesis Supervisor: Professor Amos G. Winter, V
Title: Assistant Professor, Department of Mechanical Engineering, Massachusetts Institute of Technology
Catherine L. O'Connor 3
Acknowledgments
I am extremely grateful for all of the support I've received at MIT both leading up to this thesis, and throughout the process itself. I'd like to begin by thanking my classmates in the SDM
program for their feedback, support, and demonstration that through hard work (and a little humor) amazing things can be achieved. SDM Director Pat Hale provided an amazing level of encouragement and support, and I will always be grateful.
This journey began with team ED41ndia, and I would like to thank my teammates, especially Kishor Nayar, for the enthusiasm and energy put towards this project. In addition, I owe
Natasha Wright a huge thank you for introducing us to the challenges of water treatment through desalination in India, and the possibility of change.
Across MIT, I'd like to thank research support librarians Angie Locknar, Anne Graham, Christine Sherratt, Georgiana McReynolds, Shikha Sharma and Lisa Horowitz for their thoughtful guidance and comprehensive resource recommendations. I also appreciate time spent by Professor Roy Welsch and Professor John Hauser in discussing possible approaches to evaluating interview data, and follow up work to further explore results.
I owe a huge thank you to Sahil Shah for the countless hours preparing for and performing interviews across India so that we could achieve a better understanding of what RO users really need. David Taylor and Dev Ramanujan also played critical roles in improving my
understanding of water supply systems in India, as well as how to condense hundreds of interview observations into a succinct list of customer requirements. The team at Tata Projects and Suhail Shaikh from at IIT-Bombay then provided invaluable support through sharing market research data and insights. Aravind Asokan and Gia Medhi were amazing in their introductions to those we later interviewed for RO use or improving our understanding of the cultural factors in our work. For all of the people that welcomed us into their home and even introduced us to friends and family before even meeting us in person, I appreciate every minute you gave us.
To Amos, I cannot thank you enough for giving me the opportunity to work on such a meaningful project, and for supporting me throughout the process. This was an amazing ride, and I could not have done it without the support of my family. To Bernat Olle, Amy, Dan, Fran and Tom O'Connor, I am the luckiest person in the world to have you as my family.
Catherine L. O'Connor MIT SDM Thesis
Table of Contents
List of Acronym s...10
Chapter 1. Introduction ... 11
1.1 Problem Statem ent... 13
1.2 Report O rganization ... 13
Chapter 2. W ater Resources in India ... 16
2.1 Country Level W ater Resources ... 16
2.1.1 Sources...16
2.1.2 Q uality...17
2.1.3 Access ... 20
2.1.4 Forecast...21
2.2 Urban W ater Supply ... 24
2.2.1 M unicipal Corporation W ater... 24
2.2.2 Supplem ental Sources ... 26
2.3 City Level Data ... 27
Chapter 3. Dom estic W ater Consum ption... 29
3.1 Household W ater Consum ption in India ... 31
3.2 Variation of Household W ater Consum ption ... 34
3.3 The Impact of Intermittent Supply on Consumption ... 35
3.4 Trends in Water Consumption Observed Outside of India...36
Chapter 4. Household W ater Treatm ent... 39
4.1 W ater Q uality Standards ... 39
4.2 Off-line W ater Purifiers... 40
4.3 O n-line W ater Purifiers... 41
4.3.1 Ultraviolet Treatm ent System s ... 41
4.3.2 Reverse Osmosis (RO) Treatment Systems... 41
4.4 W ater Purifier Features ... 42
4.5 After-Sales Service ... 42
Chapter 5. The W ater Purifier M arket ... 44
Catherine L. O'Connor 5
5.1 Overview of the Market ... 44
5.2 Market Report Data...46
5.2.1 M arket S ize ... 46
5.2.2 Target Market Characteristics ... 48
5.2.3 Market Drivers and Constraints ... 52
5.3 The Role of M edia ... 54
5.4 City-Level Product Adoption Rates from Additional Sources...55
5.5 Willingness to Pay Studies ... 57
5.6 The Bottled Water Market ... 62
Chapter 6. Verifying the Market...63
6.1 COUHES Review and Approval ... 63
6.2 Qualitative Interviews...63
6.2.1 M ethodology ... 64
6.2.2 R esu lts ... 66
6.3 Quantitative Discrete Choice Evaluation...74
6.3.1 M ethodology ... 74
6.3.2 R esults ... 76
6.4 Summary of Interview and DCE Findings ... 80
6.5 Study Lim itations... 81
6.5.1 Qualitative Interview Results Evaluation...81
6.5.2 Discrete Choice Evaluation ... 82
Chapter 7. Reverse Osmosis Impact Evaluation ... 84
7.1 Household Choice Structure ... 84
7.2 Individual Household - Potential Wastage Volumes ... 92
7.3 Delhi - Potential Wastage Volumes for SECA and SECB Social Groups ... 97
7.3.1 Potential Wastage Volumes...98
7.3.2 Implications of Potential Wastage Volumes for Delhi's Water Supply...101
7.3.3 Additional Considerations Regarding Wastage and Reject RO Water...106
7.4 Potential Wastage Volumes for SECA and SECB Social Groups Calculated for other Indian Cities (Mumbai, Bangalore and Ahmedabad)...107
Catherine L. O'Connor 6
7.5 Potential Wastage Volumes for SECA and SECB Social Groups Calculated
for all of U rban India...110
Chapter 8. Implications for the Future...112
8.1 Product Diffusion - General Discussion ... 112
8.2 Policy-Driven Alternatives ... 114
8.2.1 Water Supply Volume Restrictions ... 116
8.2.2 Water Efficiency Ratings...117
8.2.3 Improved Quality of Municipal Water Supply ... 119
8.2.4 General Policy-related Challenges...119
8.3 Technology-Driven Alternatives...120
8.3.1 Reverse Osmosis with Waste Capture ... 120
8.3.2 Electrodialysis as a Replacement for Reverse Osmosis ... 121
8.3.3 Desalination Bypass...123
8.3.4 General Challenges for Technology-based Alternatives ... 124
Chapter 9. Conclusions and Future Work...126
9.1 C onclusions ... 126
9.2 Future W ork...127
A p pendix ... 130
A. The 2011 Socio-economic Classification (SEC) Method & Summary Tables for India 2 0 1 1 ... 13 1 B. CO UHES Consent Form ... 134
C. List of Interview Questions and Example DCE Choice Set...135
D. Summary of Use Context Statements from Initial VOC Evaluation...137
E. Willingness to Pay Evaluation Process Using DCE Results ... 139
F. Cost Evaluation, Water Treatment Options for 7.0 LPCD, Combined Drinking and C o o king ... 142
G. Calculated Wastage Volume from a Single Household, assuming 7.0 LPCD, Combined Drinking and Cooking Water, is Treated ... 144
H. Calculated Wastage Volumes for Delhi, assuming 5.0 LPCD, Drinking Water Only, is T reated ... 146
1. Calculated Wastage Volumes for Delhi, assuming 7.0 LPCD, Combined Drinking and Cooking W ater, is Treated ... 161
J. Specifications for Example Reverse Osmosis Water Purifiers ... 162
K. Calculated Wastage Volumes for Bangalore, Ahmedabad and Mumbai, assuming 5.0 LPCD, Drinking Water Only, is Treated... 165
L. Calculated Wastage Volumes for Urban India...168
M. Additional Discussion of the Bass Model as it Applies to the RO Water Purifier M a rket ... 170
Catherine L. O'Connor 7
Bibliographic References ... 184
List of Figures
Figure 1-1. Performance of Indian Cities Across Key Indicators of Quality of Life...12Figure 2.1.1-1. Surface W ater A vailability ... 17
Figure 2.1.1-2. Annual Replenishable Groundwater (as of 31-03-2011)... 17
Figure 2.1.2-1. EC Concentrations in Groundwater ... 20
Figure 2.1.2-2. Fluoride Concentrations in Groundwater... 20
Figure 2.1.4-1. Urban and Rural Population Trends in India, 1950-2050 ... 21
Figure 2.1.4-2. Migrants Classified by Duration of Residence in Places of Enumeration in Urban Areas of India (as per 2001 Census)... 23
Figure 2.1.4-3. Forecasted Annual Groundwater Consumption, By Use... 23
Figure 2.1.4-4. Forecasted Annual Surface Water Consumption, by Use... 23
Figure 3-1. The Domestic Water Supply System, On-Grid Households in Urban India Connected to Municipal Water and Sewer ... 30
Figure 5.1-1. Water Purifier Market: Number of Products Offered by Category, Top B ra n d s ... 4 6 Figure 5.2.1-1. Actual and Forecasted Market Value of Water Purifiers in India... 47
Figure 5.2.3-1. RO Unit Sales by Product ... 53
Figure 6.2.2-1. Distribution of Water Purifiers, January 2016 Interviews ... 67
Figure 6.2.2-2. Age of Current Water Treatment Systems, and Expected Lifetime ... 70
Figure 7.1-1. Cost Comparison of Water Treatment or Replacement Options, Drinking W ater O nly Treated (5.0 LPC D )... 89
Figure 7.3.1-1. Summary of Potential Wastage Volumes and Equivalent Households That Could Have Been Served, Given a Range of Product % Recoveries and Adoption; SECA and SECB Households within Delhi, 5.0 LPCD Treated, Delhi... 100
F ig ure 8 .3 .4 -1. B ra nd S tructure ... 125
Figure 9.1-1. India's Water Availability Cost Curve...127
List of Tables
Table 2.1.2-1. Typical Water Contaminants, by Source...19Table 2.1.3-1. Summary of Per Capita water Volume Supplied by State, 2001... 21
Table 2.2.1-1. Summary of Surface Water Supply Extension Projects ... 25
Table 2.3-1. Summary of City Level Water Supply Data ... 28
Table 3.1-1. Summary of Water Supply Norms with Breakdown by Activity ... 33
Table 3.1-2. Summary of Water Consumption with Breakdown by Activity ... 34
Table 3.2-1. Per Capita Water Supplied by Select Indian Cities in 2003 ... 35
Catherine L. O'Connor 8
Table 4.1-1. Subset of Relevant BIS Drinking Water Standards (IS 15000: 2012)...39
Table 4.2-1. Treatment Capabilities by Water Purifier Type ... 40
Table 5.1-1. Water Purifier Product Summary by Type...45
Table 5.2.1-1. Actual and Forecasted Unit Sales of Water Purifiers in India ... 48
Table 5.2.2-1. Approximate Total Number of Households by SEC Category, Cities & M a jo r D is tric ts ... 5 1 Table 5.4-1. Summary of Water Purifier Adoption Rates ... 56
Table 5.5-1. Summary of Select Customer Preference and Willingness to Pay Studies for Improved Water and Sanitation Services... 58
Table 6.2.2-1. Summary of Interview Respondents by Sex, Housing Type, and H o use ho ld S ize ... . . 66
Table 6.2.2-2. Summary of RO Use by Housing Type and Primary and Secondary W ate r S o u rce s ... . . 6 8 Table 6.2.2-3. Summary of RO-based Water Purifier Use Conditions, January 2016 ... 69
Table 6.2.2-4. Summary of Interpreted Primary Customer Needs and Use Context C a te g o reie s ... 7 2 Table 6.2.2-5. Interpreted Primary and Secondary Customer Needs, VOC Group Sort P ro c e s s ... 7 3 Table 6.3.1-1. Attribute and Level Summary used in the Discrete Choice Experiment..75
Table 6.3.2-1. Parameter Estimates from the DCE Evaluation, January 2016 ... 76
Table 6.3.2-2. Effect Likelihood Ratio Test Summary ... 76
Table 6.3.2-3. Marginal Probabilities and Utility Values for DCE Attributes, by Level.... 77
Table 6.3.2-4. Variable Importance Summary... 78
Table 6.3.2-5. Summary of DCE Attribute Non-Attendance Instances, January 2016...79
Table 7.1-1. Summary of Water Purifier Cost Elements, Capital Costs Plus 10 Years of Operation; Drinking Water Only Treated ... 88
Table 7.2-1. Summary of Selected Water Consumption Volumes, Per Capita and Per H o u s e h o ld ... 9 3 Table 7.2-2. Summary of Individual Household Wastage Volumes From Using a Water Purifier of Different Recovery Levels (5.0 LPCD, Drinking Water Only) ... 94
Table 7.2-4. Summary of Household Annual Water Wastage Volumes at Different UFW R a te s ... 9 7 Table 7.3-1. Delhi Households, Broken down by SEC Code (2011 Census)...97
Table 7.3.1-1. Summary of Wasted Water Volumes and Equivalent Households That Could Have Been Served by the Wasted Volume; 5.0 LPCD Treated, Households w ith 5 P eop le/E ach, D e lhi ... 10 1 Table 7.3.2-1. Basis for Evaluation of Delhi Wastage Volumes ... 102
Table 7.4-1. Basis for Evaluation of Bangalore Wastage Volumes...108
Table 7.4-2. Basis for Evaluation of Ahmedabad Wastage Volumes...109
Table 7.4-3. Basis for Evaluation of Mumbai Wastage Volumes ... 110
Table 7.5-1. Basis for Evaluation of Wastage Volumes, Urban India...111 Table 8.2-1. Summary of Select Government Water Conservation Initiatives and
P o lic ie s ... 1 1 4
Catherine L. O'Connor 9
List of Acronyms
ACA AMC ANA BIS DCE EC ED EDR GPCD HAM HH HIG INR KL KW LIG LPCD L/HH/D MDGs MIG MLD NOC N-P O&M P RO SEC SNA TDS TERI UFW UF UV VOC WoM WSS WTP Catherine L. O'Connor MIT SDM Thesis 10Adaptive Conjoint Analysis Annual Maintenance Contract Attribute Non-Attendance
Bureau of Indian Standards Discrete Choice Evaluation Electrical Conductivity Electrodialysis
Electrodialysis Reversal
Gallons (United Kingdom) per capita per day Hectare Meter
Household
High Income Group Indian Rupee Kiloliter Kilowatt
Low Income Group Liters per capita per day Liters per household per day Millennium Development Goals Medium Income Group
Megaliter per day No-objection Certificate Non-Potable
Operation and Maintenance Potable
Reverse Osmosis
Socio-economic Classification Stated Attribute Non-Attendance Total Dissolved Solids
The Energy and Resources Institute Unaccounted for Water
Ultrafiltration Ultraviolet Lamp Voice of the Customer Word of Mouth
Water and Sanitation Services Willingness to Pay
Chapter 1.
Introduction
According to the United Nation's 2015 report on the Millennium Development Goals (MDGs), 93% of the population in southern Asia has access to improved water sources, compared to 73% in 1990. The MDG target has been reached 5 years ahead of schedule, though as
presented later in the same report, a gap in access was identified between the poor and the rich, and between rural and urban households (United Nations, 2015). Aggregating data, therefore, can lead to overly positive assessments of current conditions at the global level. The same can be true for aggregating data at the country level.
In India, annual renewable groundwater and surface water volumes give the appearance of meeting demand through 2030 or even 2050, though unequal distribution of resources both spatially and temporally has caused shortages in arid regions and in urban areas (2030 Water Resources Group, 2009; Government of India: Planning Commission, 2013). In urban areas especially, it is common for inadequate surface water supplies to be supplemented through increased groundwater extraction to meet demand. Continued extraction of groundwater beyond its renewable volume, however, can have long-lasting effects such as a receding groundwater table and increasing salinity levels when the freshwater-saline interface is reached or salt-water intrusion occurs.
In recent years, urban water supply authorities have taken steps towards actively managing groundwater resources and reducing the amount of new development where groundwater has already been stressed by over-extraction. These conservation practices are limited, however, to areas where municipal supply is available and surface water supply is sufficient, so groundwater extraction continues to occur at both the private and public level, including in areas where groundwater has been degraded (Central Ground Water Authority, 2015b).
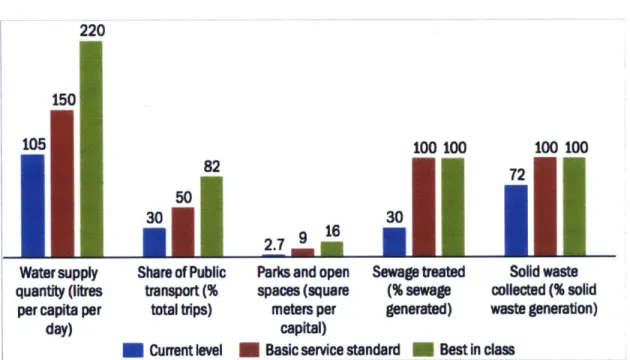
Urbanization is set to increase substantially within India through the next twenty-five years. As the population of a city grows faster than its water supply, limits in infrastructure will lead to larger gaps between demand and supply, continuing the norm of intermittent water supply, which cities use as a means of controlling distribution and further reducing the amount of freshwater available per capita (Lee & Schwab, 2005). Figure 1-1 presents the status of
Catherine L. O'Connor 11
Indian cities in terms of water supply and other factors contributing to the quality of life for its citizens as of 2010. Deficiencies are noted for each key indicator when compared to basic service standards. As municipalities take short-term and long-term measures to increase supply and manage demand, individual households are also adapting, together making millions of independent decisions regarding their water supply that end up indirectly impacting the community at large [(Delhi Jal Board, 2015a; Government of India: Planning Commission, 2013; Rosenberg, Tarawneh, Abdel-khaleq, & Lund, 2007; Srinivasan, Seto, Emerson, & Gorelick, 2013)]. 220 15 0 105 100 100 100 100 82
50 1
30 Eliii
2.7 9 1Water supply Share of Public Parks and open Sewage treated Solid waste
quantity (litres transport (% spaces (square (% sewage collected (% solid
per capita per total trips) meters per generated) waste generation)
day) capital)
U Current level U Basic service standard - Best in class
Figure 1-1. Performance of Indian Cities Across Key Indicators of Quality of Life
Source: (The Energy and Resources Institute, 2013))
As households procure supplemental water sources through the installation of private borewells, or the arrangement of private tankers or bottled water deliveries, they are also taking measures to ensure the quality of water consumed within the home is adequate and is
protective of their family's health (Rosenberg et al., 2007). Since 1990, decentralized water treatment through the use of household water purifiers has grown substantially, and promises to continue to do so as long as there is risk of contamination to the family's water supply through deteriorating water supplies, inadequate sewerage systems, aging infrastructure, and
Catherine L. O'Connor 12
intermittent operation of municipal water supply distribution networks. The technologies
employed in these water purifiers have evolved over time, but the current dominating technology in middle class and upper class households within the urban market is reverse osmosis (RO), a technology that typically produces only 20-40% (with "eco-friendly" systems producing up to 70%) purified water compared to the input volume, and wastes the remainder (Eureka Forbes, n.d.-b; Kent RO Systems Ltd., n.d.-b; Zero B, n.d.). The focus of this evaluation is to look closer at these RO water purifiers, better understand the potential impact of the current level of waste at the housebold and city level, and explore possible alternatives as the country continues to grow and develop.
1.1 Problem Statement
The intent of this thesis is to better understand the use of these RO-based water purifiers within urban areas of India, and how they may impact residential demand for potable water. The increased demand will be compared to volumes within the overall water balance
relating to a city's need for additional water sources and improved coverage of wastewater capture and treatment capabilities.
1.2 Report Organization
This report is organized by first providing an overview of water resources in India in Chapter 2. The different sources are discussed, as well as how cities have managed the supply that is distributed to their constituents. Variation exists in terms of the quantity and quality of water available in different areas of the country. Supplemental sources are then discussed, as there often exists a gap between demand and supply at the homeowner level. Chapter 3
explores domestic water consumption, and compares supply norms with observational data, which are generally much lower than the supply norms. The effects of intermittent supply and
customer perception on conservation were found to impact consumption if the supply volume was insufficient, or if households were not directly paying their water bill, as in the case of
societies and apartment buildings.
Chapter 4 briefly presents water treatment technologies currently in use at the household level in India. Each of the different technologies has a different set of treatment
Catherine L. O'Connor 13
capabilities, and varying maintenance requirements, though reverse osmosis (RO) is the one technology that requires a reject water line, and wastes anywhere from 30-80% of the input water in the treatment process.
The market for water purifiers is presented in Chapter 5, and a discussion about willingness to pay is included for comparison. Though market reports through 2010 indicate
low product diffusion of water purifiers throughout India, significant growth was forecasted, and verified through a summary of studies that looked exclusively at electric water purifiers in urban
areas, focusing on Delhi. With recent RO system adoption rates of 45% or higher in medium and high income groups in Delhi, a preference for RO systems was observed beyond the 10% or less of households relying on groundwater as a primary source. A review of willingness to
pay (WTP) studies found that households were willing to pay higher tariffs for improved water and sanitation services (WSS), but that significant coping costs were already being spent dealing with insufficient water supply volumes and poor water quality and were considered in total WTP costs. Chapter 6 then presents results from qualitative interviews and a discrete
choice evaluation performed in January 2016 on water purifier users in urban areas of India as a means of verifying the market, and further understanding the needs and preferences of the customers with regards to their water treatment equipment. RO users were confirmed to be treating water from municipal sources, as well as from borewells and tankers. Though
households were largely unaware of the waste generated by RO systems before purchasing them, there was a significant interest in improving recovery rates within the product price ranges evaluated.
Chapter 7 takes RO use case trends from Chapter 6 and combines them with product information (namely the percent of water recovered from the RO water purifiers currently on the market) and market penetration data to calculate the potential impact from wide-scale adoption of RO systems both at the home level, within a select number of cities (Delhi, Mumbai,
Bangalore and Ahmedabad), and then expanded to all of urban India. Volumes were found to be significant, ranging up to 93.2 megaliters per day (MLD) at the city level with full adoption and current RO recovery rates. Compared to the volume of groundwater extracted by
municipalities past sustainable levels, and the volume of wastewater that goes untreated due to inadequate infrastructure, these waste volumes could represent a measurable fraction of each.
Chapter 8 uses the results from Chapter 7 to present how a series of policy-based and technology-based alternatives might be structured to reduce the potential impact from RO.
Catherine L. O'Connor
Recent government initiatives were presented that emphasized water conservation through improved efficiencies and public participation. The alternatives presented were each shown to align with the initiatives, though not without certain challenges in implementation. Finally, Chapter 9 provides final conclusions that revisit the impact of RO diffusion, considering it is not limited to households relying on groundwater for their potable water, and encourages the use of a combined policy and technology-based approach to achieve a more sustainable future. Additional work is also recommended in order to verify calculated volumes and better understand the hierarchy of stakeholder requirements, so that future programs can have a higher chance of success.
Throughout the report, data from publicly available government documents and public and private studies are used to support the evaluation. Additional calculations and rationale are then provided in a series of appendices.
Catherine L. O'Connor MIT SDM Thesis
Chapter 2.
Water Resources in India
The following section first presents an overview of the volume and quality of water resources across India, as well as future projections. The typical urban water supply system is then described, with the different means of distribution. Finally, the water supply systems for four cities visited in January 2016: Delhi, Mumbai, Bangalore and Ahmedabad, are presented for comparison.
2.1 Country Level Water Resources 2.1.1 Sources
India relies on a combination of surface water and groundwater to meet demand from agriculture, industry and domestic uses. In terms of surface water, approximately 4,000 km3 of
precipitation falls in the form of snowfall and rainfall, with approximately 75% of this total from monsoons (Kumar, Singh, & Sharma, 2005). There are over 20 major rivers within India, most of which flow year-round. The total annual utilizable surface water volume, limited by technical, socio-political, and physical restraints, was estimated to be 690 km3 as of 2005. Groundwater
from natural recharge and from recharge augmentation through canal irrigation then provides another 396 km3 of annual utilizable water. Though annual demand in 2010 was calculated to
be approximately 710 km3, which is less than the theoretical utilizable water supply, certain areas of India have become water stressed, and in some cases the groundwater has been over-exploited (Central Ground Water Board, 2014; Central Water Commission: Water Resources Information System Directorate, 2015; Kumar et al., 2005). Figure 2.1.1-1 and Figure 2.1.1-2 demonstrate the variation in the availability of surface water and renewable groundwater across the country. By reviewing the two maps together, it can be observed that the states located in the western and northwestern regions of the country are low in both surface water and
renewable groundwater sources.
Catherine L. O'Connor
r4r. oi~,
tic A ta
r-0"Indu
1
1
Figure 2.1.1-1. Surface Water Availability Source: (World Resources Institute, 2016)
Kabul
Surface Water Availability (bin) Annual Replenishable GW (m) Water Availability (m/yr) > 0.5
[> 1.0 (Very High) 0.25 to 0.5 El 0.6 - 1.0 (High) 0.15 to 0.25 El 0.4 - 0.6 (Medium) 0.1 too 15 S0.1 -0.4 (Low) 0.025 to 0.1 < < 0.1 (Very Low) <0.025 * No Data Saline
l Not Assessed (Forest/Hilly Area)
I
2.1.2 Quality
Different types of raw water sources may have pollutants present, as summarized in Table 2.1.2-1. While municipal water suppliers design their water treatment facilities with these parameters and the applicable BIS standards in mind and perform testing to verify compliance, additional contaminants may be introduced during distribution of the treated water (as in the case of direct or indirect exposure to untreated sewage). Contamination may also be present in storage systems at the society or individual home level that have not been fully maintained, and
Catherine L. O'Connor MIT SDM Thesis 17 011al"a '-I' ' t t' N v; Py, Ti
-WI
Figure 2.1.1-2. Annual Replenishable Groundwater (as of 31-03-2011)
Page intentionally left blank
Catherine L. O'Connor 18
this water is not commonly treated prior to arrival at the tap (Kumpel, 2013; Lee & Schwab, 2005; Misra & Goldar, 2008). In addition, families relying on a public or private bore well for water could be susceptible to changes in groundwater quality over time, such as an increase in salinity [measured as total dissolved solids (TDS)] due to over-pumping at depths near the salt-water interface, accumulation from irrigation for agriculture or industrial pollution (California
State Water Resources Control Board; Division of Water Quality; GAMA Program, 2010). Figure 2.1.2-1 presents the electrical conductivity concentrations (a surrogate for TDS, with a measurement of 750 pS/cm EC generally equivalent to 480 mg/L TDS) in groundwater across the different regions of India in 2011 (Wright & Winter V., 2014). As shown, a significant area of the country has an EC concentration above 750 pS/cm, which when converted to TDS, is just
below the BIS drinking water standard of 500 mg/L, therefore requiring treatment in areas shaded yellow and red on the figure. Additional contaminants in groundwater that often requiring treatment are fluoride, shown in Figure 2.1.2-2, arsenic and nitrate (Central Ground Water Board, 2010; Susheela, 2002).
Table 2.1.2-1. Typical Water Contaminants, by Source
Source Typical Contaminants Notes
Type
Lakes and None if protected and erosion does Exposure to untreated sewage, short storage Ponds not take place, otherwise turbidity, periods, and overturning conditions can lead to
carbon dioxide, iron, manganese and the presence of additional pollutants on occasions, hydrogen sulfide
Impounding Turbidity, carbon dioxide, iron, Exposure to untreated sewage, short storage Reservoirs manganese and on occasions, periods, and overturning conditions can lead to
hydrogen sulfide the presence of additional pollutants
Rivers and Depends on character and area of the Exposure to untreated sewage can lead to the Irrigation watershed; Could include color, presence of additional pollutants
Canals turbidity, tastes and odors, hardness, bacterial and other microorganisms
Groundwater Depends on formation; Could include Over-draft from areas adjacent to saline water fluorides, salts, carbon dioxide, iron, sources, exposure to untreated sewage, water-manganese, hydrogen sulfide, or logging, and subsurface pollution can lead to the
arsenic presence of additional pollutants
Collected Typically N/A, though collection rainwater vessels may be contaminated with
microorganisms
Source: (Central Public Health and Environmental Engineering Organisation, 1999)
Catherine L. O'Connor MIT SDM Thesis
--
f
AA
A~wo
Figure 2.1.2-1. EC Concentrations in Groundwater
Source: (Central Ground Water Board, 2010) Legend EC In micro siemena/Cm at 26C <750 750-1500 1500-3000 >3000 Spot Value >3000 State Boundary District Boundary Drainage
Figure 2.1.2-2. Fluoride Concentrations in Groundwater Source: (Susheela, 2002) Legend: Districts Affected 1 -40% 40- 70% 4 70 -100% Not known 2.1.3 Access
According to the 2011 Census of India, approximately 43.5% of households in India (70.6% in urban areas, and 30.8% in rural areas) identified tap water as their main source of water. Data available at the state and union territory level uncovers wide variation in access to tap water, however, with a low of 16.8% urban households and 2.6% rural households (in
Lakshadweep and Bihar, respectively). For the remainder of the population that relies on groundwater from private or public borewells, tankers, or other sources of water, availability of
Catherine L. O'Connor MIT SDM Thesis
20
India: Fluorosts Prevalent States
6
lo
>,. A"
4L, Or's
water can depend on the condition of the groundwater table and the depth of the well, and the overall demand for water compared to its supply. The per capita volume of water supplied to households throughout India varied significantly in 2001, as summarized in Table 2.1.3-1.
Table 2.1.3-1. Summary of Per Canita water Volume Sunnlied by State 2001
State/Union Water Supply (LPCD)
Territory Min. Max.
Andhra Pradesh 41 131 Assam 77 200 Gujrat 21 157 Karnataka 45 229 Kerala 12 372 Madha Pradesh 28 152 Mizoram 26 280 Maharashtra 32 191 Haryana 30 105 Punjab 42 268 Tamil Nadu 51 106 Uttar Pradesh 63 172 West Bengal 66 237
Source: (Centra Pollution Control Board, 20-1 1)
2.1.4 Forecast
Urbanization is set to increase substantially within India through the next twenty-five years (see Figure 2.1.4-1), and the majority of people that migrate to urban areas plan to remain ten years or more (see Figure 2.1.4-2).
18,00,000 Rural Urban 16,00,000 14,00,000 12,00,000 C 0 10,00,000 a 8,00,000 6,00,000 4,00,000 2,00,000 0
Figure 2.1.4-1. Urban and Rural Population Trends in India, 1950-2050 Source: (World Bank, 2013)
21
Catherine L. O'Connor MIT SDM Thesis
Page intentionally left blank
Catherine L. O'Connor 22
30% Za 25% 2 0 % --- -0 015% 10% 5% 0%
Less than 1 1-4 years 5-9 years 10-19 years 20+ years Duration
year not stated
intended Duration of Stay in Relocated Urban Area
Figure 2.1.4-2. Migrants Classified by Duration of Residence in Places of Enumeration in Urban Areas of India (as per 2001 Census)
Source: (Indiastat, 2001b)
By 2025, India is predicted to be water stressed, with only 1,401 m3 per capita surface water availability. In addition, the Planning Commission of the Government of India has
predicted an increase in annual country-wide demand from 710 km3 in 2010 to approximately 1180 km3 in 2050, as domestic and industrial demand are each anticipated to grow as shown in Figure 2.1.4-3 and Figure 2.1.4-4 (Central Pollution Control Board, 2011; Kumar et al., 2005).
450
Total renowable vol re (396 rr3 350 *& 250 Other -Power 200 Industries c 150 8 Domestic 100
I IIrrigation
50 0 1998 2010 - 2010 - 2025 - 2025 - 2050 - 2050-Low High Low High Low High
Figure 2.1.4-3. Forecasted Annual Groundwater Consumption, By Use
(Source: (Kumar et al., 2005))
Catherine L. O'Connor MIT SDM Thesis
800
700 - -Total utilizab c volume (690 km3
600 700 -smm 00 200 100-0 1998 2010 2010 2025 2025 2050 2050
-Low High Low High Low High
Figure 2.1.4-4. Forecasted Annual Surface Water Consumption, by Use
(Source: (Kumar et al., 2005))
Though the estimated total renewable groundwater volume and total utilizable surface water volumes are in aggregate shown to be sufficient until 2050 (under the high growth scenario), it should be noted that these numbers look at India as a whole. Since distribution of these resources is not equal throughout the country, certain areas are already experiencing shortages.
2.2 Urban Water Supply
2.2.1 Municipal Corporation Water Supply
Across urban centers of India, water is primarily provided to households by municipal governments through their respective distribution networks. According to the Indian Census of
2011, 70.6% of urban households have access to water at the tap within the premises of their
home, 87.8% of which have treated water. The remaining population relies on well water (6.2%), a handpump or tubewell (20.8%), or other sources of water (2.5%) (Census of India, 2011 a). The distribution of households with tap water (typically referred to as "corporation water" or "municipal water") varies by state, by city, even by neighborhood within a city, depending on the infrastructure that is in place and the characteristics of the utility's water supply.
A city's location and proximity to water resources will dictate whether they will rely primarily on surface water or groundwater to supply municipal water to their constituents. Surface water sources tend to be limited in volume that can be withdrawn, dependent on the year's precipitation pattern. Groundwater is often used by municipalities as a supplemental source, and withdrawal rates are increased as needed in order to cover the gap in demand. With falling groundwater levels now common across the country, the Central Ground Water Authority has established guidelines for the evaluation of proposed groundwater extraction that prohibits new groundwater development in over-exploited areas without specific permission approval only considered if a no objection certificate (NOC) has been obtained. The NOC approval is based on review, but will only be allowed in areas where municipal supply water is otherwise unavailable, and will be terminated once access to municipal water is provided. Conservation activities such as rainwater harvesting and recycling and reuse for non-domestic
Catherine L. O'Connor 24
purposes are becoming required for new construction, and a condition of obtaining the NOC (Central Ground Water Authority, 2015b).
As cities look towards the future with a limitation on groundwater expansion despite rising urbanization, additional surface water sources in some cases outside the city limits -are sought out for integration into their network. Table 2.2.1-1 identifies several cities that -are evaluating supplemental water sources over 100 km in distance from the end-users. With
increased distances comes an increase in cost of transmission, and the need to further raise municipal water tariffs in order to recover the cost of operation.
Table 2.2.1 -1. Summary of Surface Water Supply Extension Projects
City Raw Water Source Distance (Km)
Ahmedabad River Sabarmati (Dharoi Dam) 150
Bangalore River Cauvery (K.R. Sagar) 100
Chennai River Krishna 9Telugu Ganga) 400
Delhi River Bhagirathi (Tehri Dam) 250 Renuka Dam (Planning Stage) 280 Kishau Dam (Planning Stage) 280 Hyderabad River Krishna (Nagarjunasagar) 160
Mumbai Bhasta Dam 54
Source: (Central Pollution Control Board, 2008)
24/7 Water Supply
To make water available at the tap on a continuous (or "24/7") basis, a water storage system is often installed, either informally within the home using buckets or other water storage
containers, or at a larger scale incorporating an underground tank and/or overhead tanks, and a booster pump. With the more formal storage system, the underground tank is filled while the municipal supply is "on" (which can be once or twice a day) using a suction pump, then water is pumped to the overhead tank, which is connected to the home's tap. As water is needed throughout the day, it is accessed from the overhead tank. When municipal water is available next, water is again collected to fill the underground tank, and the process repeats. During the January 2016 interviews (discussed in more detail in Chapter 6), several respondents referred to the municipal supply cycle, and for some, the schedule was consistent, but for others the time
of day varied to reduce illegal consumption. In all cases, the sump pump was manually turned
Catherine L. O'Connor 25
on/off by either a family member (in the case of stand-alone homes), or maintenance staff (in the case of households living in a flat). For households connected to an intermittent municipal
line without the outdoor tank collection system, a family member would manually fill vessels from the tap while the municipal line was open for use throughout the day.
2.2.2 Supplemental Sources
Having continuous access to municipal water may still not ensure a household has sufficient volume to meet its demand (consumption is discussed more in Chapter 3). Depending on the perceived gap in supply and their economic status, households may also seek an
additional water source for potable and/or non-potable uses. Bottled jugs, tanker trucks and borewells are some of the options available (Rosenberg et al., 2007; Saleth & Dinar, 2001).
Bottled Water
Bottled water jugs 20L in size are available for on-demand water supply for a fee that ranges from INR 30-80 per jug, including home delivery (WaterBot Online Solutions Pvt Ltd,
n.d.). Prices vary by brand and region and some subjects interviewed in January 2016 indicated they had experienced a delay in delivery of one or more days during periods of high demand. Bottled water is typically purchased for potable uses only, and depending on the household's preference and availability of alternatives, it may only be used for drinking, relying on another source of water for the household's cooking needs. With significant sales recorded by the country's number one bottled water brand, Bisleri, has come a surge in unbranded bottled water vendors (Indiastat, n.d.). Uncertainty in the sourcing and treatment operations associated with these vendors has led to a perception that the water quality of bottled water cannot be trusted, in some cases leading to homeowners providing further purification in the home prior to consumption.
Tanker Water
Tanker water is another option homeowners have for on-demand water during periods of insufficient municipal supply. Tanker water can be sourced from surface water bodies, or
groundwater, and can be controlled by municipalities or private vendors. The cost per delivery depends on location, the size of the truck, the volume needed (anywhere from 1,OOOL to
Catherine L. O'Connor 26
10,000L), and the purpose (regular supply vs. a special event such as a wedding) (Lasania, 2014; Subramanian, 2012). Except for special events, tanker water is generally used for non-potable or combined non-potable and non-non-potable use in the home, as temporary storage system is required for its use and not all households have separate tanks for different sources of water. The quality of tanker water is perceived to be low, as indicated by subjects interviewed in January 2016 that identified tanker water as their primary source. Tanker water is typically treated with a household's water purification system prior to its use for potable consumption.
Private Borewell
In cases where the municipal water supply is unavailable at the time of a home's construction or inadequate to meet a household's anticipated need, installation of a private borewell may be considered. A borewell is a long-term investment that involves significant up-front capital (estimated by Misra and Goldar in Delhi, 2008 as INR 17,000 for the borewell, INR 2,400 for the pump, and INR 1,600 for the overhead tank), but assuming a suitable range in the groundwater depth was incorporated into the design of the well, can provide supply on demand
(Misra & Goldar, 2008). It should be noted that depending on the condition of the groundwater in the region, and whether the local governing body has found current groundwater use to be sustainable, a NOC may be required for installation. In addition, the deteriorating quality of groundwater within India's urban areas discussed earlier in Chapter 2 can lead to a household's use of a water purifier for potable uses, or the decision not to install a borewell.
2.3 City Level Data
As mentioned above, evaluating India's water resources in aggregate form present an image of potential future shortages, but no current problems. The following takes a closer look at four cities: Mumbai, Delhi, Bangalore and Ahmedabad, in terms of their demographics, the current water source distribution, capacity and production levels, per capita water supplied as production costs and the average tariff paid. Table 2.3-1 summarizes the conditions of water supply from each city, according to data from a variety of sources, mostly if not entirely based on self-reported values.
Catherine L. O'Connor 27
Table 2.3-1. Summary of City Level Water Supply Data
Parameter Units Mumbai Bangalore Ahmedabad Delhi Data Source Population Population (2001) People 11,914,398 6,523,110 - 13,782,976 (1) Population (2011) People 12,442,373 9,621,551 7,214,225 16,368,899 (2) Avg Production MLD 3200 923 624 - (3) (2005-2006) 1 WTP Installed Capacity (2011) MLD 3128 900 - 2118 (1) (2015) MLD - - - 3423 (4) Service coverage % 100% 92.9% 74.5% - (3) % 81.9% (4)
Water Available (time) hrs/day 4 4-5 2 - (3)
hrs/day - - - 4 (5)
UFW Estimate % 13.6% 45.1% - - (3)
% - - - 40.0% (6)
Surface water % % 100% 100% 93% - (3)
% - - - 90% (4)
Groundwater % % Nil Nil 7% - (3)
% - - - 10% (4)
Per Capita Water Supply
(Mar 2001) LPCD 168 80 Not incl. 180 (7)
(Nov 2003) LPCD 268 141 139 218 (8) (2005-2006) LPCD 191 74 171 - (3) (2011) LPCD 263 138 - 154 (1) Unit Production Rs/m3 3.67 10.1 1.31 - (3) Cost Average Tariff Rs/m3 4.6 20.6 1.34 - (3) Rs/m3 - - - 4.39 (9) Sou (1): (2): (3): (4): (5): (6): (7): (8): (9): rces:
(Central Pollution Control Board, 2011) (Indiastat, 2011a, 2011b, 2011c, 2011d) (Asian Development Bank, 2007) (Government of NCT of Delhi, 2015a) (The World Bank, 2006)
(Government of NCT of Delhi, 2015b) (Indiastat, 2001 a)
(Indiastat, 2003)
(Delhi Jal Board, 2015b)
Catherine L. O'Connor MIT SDM Thesis
Chapter 3.
Domestic Water
Consumption
Domestic water consumption varies based on several factors including but not limited to, household size, convenience, the season, climate, cultural habits and the use of
water-consuming appliances (Andey & Kelkar, 2009; Inocencio, Padilla, & Javier, 1999). In addition, the availability of a household's water supply (in terms of volume and timing) and the quality of the water will also impact consumption levels (Andey & Kelkar, 2009; Rosenberg et al., 2007). Figure 3-1 illustrates the domestic water system, and its connections to infrastructure beyond the home (see legend for a description by number of each element, as well as the meaning of the color-coded lines).
The following provides several methods of estimating water consumption per household, splitting the volume between potable and non-potable uses. Theoretical values of minimum demand are presented first, then measured consumption values from studies within India and beyond are presented, as well as a review of studies evaluating the impact of intermittent supply and conservation efforts on consumption.
Catherine L. O'Connor MIT SDM Thesis
a ~ ~ ~ ~ ~ . . a mO nM Emms0OEaM o nMM Ea00mms ... . ...
C,0
12
Non-Potable uses -sanitation -bathing -cleanin0p
I
11 LegendPotable water (primary)
m m m w Potable water (secondary) Non-potable water
.Source for tanker water Kitchen drain
- Other domestic drain
Possible contamination
0
0
0
0
0
0
0
Municipal water supply Water tanker supply Borewell supply Bottled water supply Household storage
Pot. supply, untreated to tap Pot. supply to water purifier
Non-potable supply Domestic wastewater drain
O
Sewage captured and treated Sewage overflow/not captured Untreated discharge of sewageO
Cross-contamination of pot. supply®
Potential contamination from industry Note: Icons sourced from the Noun Project (http://thenounproject.com). See Bibliography for specific references to the creator of each icon.Figure 3-1. The Domestic Water Supply System, On-Grid Households in Urban India Connected to Municipal Water and Sewer
Catherine L. O'Connor 30 MIT SDM Thesis
C7
Potable uses -drinking -cookingrnm
3.1 Household Water Consumption in India
According to Gleick, the minimum volume of water needed to sustain human life is approximately 50 liters per capita per day (LPCD). Of this total, approximately 5 LPCD is used for drinking and is based on caloric consumption throughout the day, and 10 LPCD for cooking and food preparation. Combined, approximately 15 LPCD (or 30%) of the total consumption is for potable uses, while remaining 35 LPCD is used for non-potable activities including bathing and sanitation (Gleick, 1996).
In urban areas of India, the minimum required daily volume is not representative of the average volume actually consumed. In order to better understand what this volume should be, a review was performed both of water supply norms used in urban areas of India and actual consumption observations from urban households, with volume broken down by activity for each. Table 3.1-1 and Table 3.1-2 provide a summary of the studies reviewed. Since each study referred to the various activities differently, the terminology used in each study was maintained and kept with the corresponding volume. Similar terms were then grouped together when sequencing the data. Drinking and cooking activities were considered to require potable water (and would therefore be treated either with a water purifier or by boiling). The remaining
activities were assumed to use non-potable water, with no treatment required for those volumes. When assembling Table 3.1-1 for water supply norms, Gleick's 50 LPCD for meeting basic human needs was included for comparison purposes only, as the CPHEEO and INTACH water supply norms were more than double in volume, and represented households with full flushing sewer systems that were located within a planned colony or an authorized society, and fell within the targeted RO market segment.
As shown in Table 3.1-1, assigning a volume of 5 LPCD for drinking water appears to be standard practice. When accounting for additional water for cooking, or cooking and
dishwashing, the volume increases by up to 15 LPCD, though the distinction is not generally made between water used for cooking (which would need to be potable), and water used for washing dishes (which could potentially use non-treated water). The distinction is clear in Table 3.1-2, however, with observations split between cooking and washing dishes or washing
utensils. Though drinking and cooking are not always separate, with the exception of the Water
Catherine L. O'Connor 31
Audit study which measures water running from a tap in the kitchen', the volume of water used for drinking only to drinking and cooking ranged only from 3.8 to 7.1 LPCD. Based on this review, an average volume of 5 LPCD produced (treated) water will be assumed for drinking purposes (using Gleick's value as a lower limit), and an average volume of 7 LPCD produced water for combined drinking and cooking purposes. These assumptions are believed to be conservative, given the potential that the volumes observed by Shaban and Ghosh were limited by supply (Andey & Kelkar, 2009). As previously mentioned, water used for washing dishes and utensils, and all other domestic activities are assumed to use untreated, non-potable, water.
Conveyance losses are commonly referred to as unaccounted for water (UFW), and have been a challenge for urban water distribution systems in India, as discussed in Chapter 2. The estimated losses observed and those allocated in the water supply norms presented herein vary in magnitude, though all appear to be low in comparison to the UFW estimated across the country's major cities. As comprehensive metering does not often exist in any of India's urban areas, updates on UFW levels are not commonly available. As a result, for the purposes of the evaluation presented later in Chapter 7, UFW will be excluded from initial calculations, but discussed qualitatively when appropriate.
1 According to Shah et al, the measurement of running taps in the kitchen included "water used for rinsing vegetables, dishes, washing hands etc." (p. 2). The value was calculated based on the measured flow rate of the tap (2.83 L/minute), and the average duration the tap was on during the day per person (15 minutes) (Shah, Thakar, & Panda, 2009).
Catherine L. O'Connor 32
0, CD C,) C) (D CD 0 05 0 0
Gleick, Basic Water CPHEEO Manual on Water Supply & INTACH's Holistic Water Policy, Source: Requirements for Human Treatment Referenced in the Draft Water Policy for Delhi, 2015
Activities: Meeting Basic Needs
Year: 1996 1999 2013 2013
Population subgroup: N/A Household with full flushing system Planned Colony in Delhi Authorized Society in Delhi
General Activity Description LPCD Description LPCD Description LPCD Description LPCD
Drinking, Cooking & Dish Drinking 5 Drinking & Cooking 8.1 Drinking 5 Drinking 5
Washing Cooking & Dish Cooking & Dish Cooking & Dish
Washing 10 - - Washing 15 Washing 15
Bathing & Sanitation Bathing & Sanitation 35 Bathing & Flushing 60.8 Bathing 40 Bathing 40
Laundry - - - - Laundry 30 Laundry 30
Mopping - - Washing' 43.9 Mopping 20 Mopping 20
Garden/Green - Garden' 22.3 Garden/Green 65 Garden/Green 40
Space/Public Use Space/Public Space
Conveyance Losses Conveyance Conveyance
- - - Losses, 15% 22.5 Losses, 15% 22.5
Other - - - Rounding 2.5 Rounding 2.5
TOTAL 50 135 200 175
Notes:
1. Since the CPHEEO breakdown for 135 LPCD was based on percentages and the total slightly exceeded 135 LPCD, 0.5% was deducted from the Washing and Gardening activities.
Sources: (Gleick 1996; Central Public Health and Environmental Engineering Organisation 1999; Delhi Jal Board 2015)
WA CA), C, 0 CD IN CI) a z 0 I CL 0. 0
Table 3.1-2. Summary of Water Consumption with Breakdown by Activity
Water Audit - Need of the Hour; Water Poverty in Urban India: A Study of Major
Source: Shah et al, Tata CE Shaban, 2008
Year: 2009 2005
Population subgroup: Typical Urban Apartment Avg Household (All 7 Cities) Delhi Mumbai
General Activity Description LPCD Description LPCD2 LPCD2 LPCD2
Drinking, Cooking & Dish Washing Running Taps in Kitchen 42.5 Drinking 3.8 3.9 3.8
- Cooking 2.7 2.9 1.5
- Washing Utensils 14.9 12.9 15.7
Bathing & Sanitation Shower & Toilet 107 Bathing & Toilets 44.1 37.6 41.0
Laundry Laundry 28 Washing Clothes 17.0 11.1 22.0
Mopping - Cleaning House 6.7 5.5 6.0
Garden/Green Space/Public Use - - -
-Conveyance Losses Leaky Fittings 6.5 - - -
-Other - Other 2.2 4.4 0.5
TOTAL 184 91.6 78 90.4
Standard Deviation - 51.5 49.9 32.6
Implications of End User Behavior in Response to Deficiencies in water Source: supply for electricity consumption - A Case Study in Delhi; Ghosh, 2016
Year: 2014,2015
Population subgroup: Organized Housing, HIG MIG LIG
General Activity Description LPCD LPCD LPCD
Drinking, Cooking & Dish Washing Drinking & Cooking 7.1 6.4 6.1 (Stored)
Washing dishes 10.1 11.3 11.9
Bathing & Sanitation Bathing & Toilets 43.7 38.6 38.0
Laundry Washing Clothes 9.1 10.2 10.8
Mopping House Cleaning 4.6 4.2 4.1
Garden/Green Space/Public Use - - -
-Conveyance Losses - - -
-Other Other 4.1 4.2 4.2
TOTAL 78.7 74.9 75.1
Standard Deviation 21.7 18.2 19.9
Notes:
* LPCD consumption levels by activity were calculated using the mean total volume consumed, consumption per day for each activity.
and the average percent of total
Sources: (Ghosh, Kansal, and Aghi 2016; Shah, Thakar, and Panda 2009; Shaban and Sharma 2007)
3.2 Variation of Household Water Consumption
Water consumption values provided above typically represent the average volume consumed within a subgroup (by city or economic level). As demonstrated by the standard deviation exhibited in Table 3.1-2, variation in this volume exists. In Shaban and Sharma's
Catherine L. O'Connor MIT SDM Thesis
study alone, of the seven cities surveyed, the average per capita volume ranged from 77 LPCD to over 115 LPCD, with standard deviations that ranged from 32 to 58 LPCD. The impact can also be observed at the household level, with a standard deviation that represented up to 75% of the average household consumption value, suggesting not only a range in consumption, but also in household size. The multi-city study calculates a distribution of households with varying
levels of per capita water consumption and as of 2005, a significant amount of households (40%, averaging the cities together) had access to less than 75 LPCD, and 17.5% even had less than 50 LPCD, the assumed minimum standard (Shaban & Sharma, 2007). Since standard
consumption and household size values were used to determine the market size in the potential wastage calculations of Chapter 7, it is possible that the number of households was
underestimated, and the volume of water consumed was overestimated (though aggregate city supply data would suggest otherwise). To further enforce the range of water consumption, Table 3.2-1 illustrates the range in per capita water supplied by different cities as of 2003.
Table 3.2-1. Per Capita Water Supplied by Select Indian Cities in 2003
City LPCD City LPCD City LPCD
Greater Mumbai 268 Nagpur 176 Meerut 185
Kolkata 173 Patna 107 Nashik 140
Delhi 218 Indore 149 Jabalpur 95
Chennai 106 Vadodara 169 Jamshedpur 90
Bangalore 141 Bhopal 180 Asansol 120
Hyderabad 164 Coimbatore 108 Dhanbad 70
Ahmadabad 139 Ludhiana 117 Faridabad 120
Pune 283 Kochi 124 Allahabad 111
Surat 139 Visakhapatnam 131 Amritsar 135
Kanpur 124 Agra 134 Vijayawada 137
Jaipur 170 Varanasi 191 Rajkot 88
Lucknow 164 Madurai 88
Source: (Indiastat, 2003)
3.3 The Impact of Intermittent Supply on Consumption
The water supply norms values presented in Table 3.1-1 do not distinguish between water supplied during intermittent or continuous supply conditions, though all consumption
values in Table 3.2-1 represent conditions where water is supplied for only certain hours of the
Catherine L. O'Connor 35


![Les horloges moléculaires à l'heure de la génomique [Molecular dating in the genomic era]](data:image/gif;base64,R0lGODlhAQABAIAAAP///wAAACH5BAEAAAAALAAAAAABAAEAAAICRAEAOw==)