Design of Trace Caches for
High Bandwidth Instruction Fetching
byMichael Sung
S.B., Electrical Engineering and Computer Science Massachusetts Institute of Technology, 1997
Submitted to the Department of Electrical Engineering and Computer Science in Partial Fulfillment of the Requirements for the Degree of
Master of Engineering in Electrical Engineering and Computer Science at the
Massachusetts Institute of Technology
May 1998
© Michael Sung, MCMXCVIII. All rights reserved.
The author hereby grants to M.I.T. permission to reproduce and distribute publicly paper and electronic copies of this thesis document in whole or in part.
Author
Department of Electrical Engineering and C mputer S/nce
/1\I May 22, 1998
Certified by
V-
v Arvind
ssor of Computer Science and Engineering
7 . _---;e.is Sunervisor
S
Arihur
C. Smith Chairman, Department Committee on Graduate Theses Accepted by MASSACHUSETTS INSTITUTE OF TECHNO -~f\JUL
141998
LIBRARIES v -- lDesign of Trace Caches for
High Bandwidth Instruction Fetching
by
Michael Sung
Submitted to the Department of Electrical Engineering and Computer Science on May 22, 1998 in partial fulfillment of the
requirements for the Degree of Master of Engineering in Electrical Engineering and Computer Science
ABSTRACT
In modern high performance microprocessors, there has been a trend toward increased supersca-larity and deeper speculation to extract instruction level parallelism. As issue rates rise, more ag-gressive instruction fetch mechanisms are needed to be able to fetch multiple basic blocks in a given cycle. One such fetch mechanism that shows a great deal of promise is the trace cache, originally proposed by Rotenburg, et. al. In this thesis, critical design issues regarding the trace cache fetch mechanism are explored in order to develop techniques to further improve trace cache performance. The thesis research presents an optimized trace cache design that show an average 34.9% improvement for integer benchmarks and 11.0% improvement for floating-point bench-marks, relative to the originally proposed trace cache design. This corresponds to a 67.9% and 16.3% improvement in fetch bandwidth over a traditional instruction cache, for integer and float-ing-point benchmarks respectively. The results demonstrate the viability of the trace cache as a high performance fetch mechanism and provide justification for additional research .
Thesis Supervisor: Arvind
Acknowledgments
First and foremost, I would like to express my gratitude to my Mom and Dad, for all their love and encouragement throughout the years. I definitely would not be where I am today, had it not been for them. I also want to thank my little sister, Emily, who has always made me feel important and special.
To Marilyn, I give my utmost appreciation and thankfulness. I wish I could show her how grateful I am for her unconditional support. She has been an inspiration to me, patiently sticking by my side through the countless days and nights while I worked on my thesis.
A special thanks goes to Marty Deneroff, who has been the most incredible resource while I have been at Silicon Graphics. I would also like to acknowledge Professor Arvind for his guidance and helpful suggestions.
I must also recognize Silicon Graphics, Inc. for all the resources and opportunities that were pro-vided to me. The company has been instrumental to my education and growth, and I am indebted to their support.
Finally, I would like to pay a tribute to MIT, which has been my home for the last five years. They have been the most memorable in my life, and I will always reserve a special place in my heart for those that I have met and befriended while at the 'Tute.
Table of Contents
CHAPTER 1. INTRODUCTION... 1
1.1 BACKGROUND AND MOTIVATION ... 1
1.2 THESIS OVERVIEW... ... 6
CHAPTER 2. PRIOR WORK ... 7
CHAPTER 3. TRACE CACHE FETCH MECHANISM... ... 10
3.1 TRACE CACHE... 10
3.2 MULTIPLE BRANCH PREDICTION ... ... 15
CHAPTER 4. CONTRIBUTIONS OF THESIS ... 16
4.1 TRACE CACHE DESIGN ISSUES TO ADDRESS ... ... 16
4.2 LONG-TERM ROADMAP OF RESEARCH ... ... 18
CHAPTER 5. SIMULATION METHODOLOGY ... 19
5.1 SIMULATION ENVIRONMENT ... ... 19
5.1.1 Trace-driven Simulation... ... 19
5.2 SIMULATION M ODEL ... 20
5.3 PERFORMANCE METRIC ... ... 21
5.4 TEST W ORKLOAD ... 21
5.4.1 General Characteristics of SPEC95 Benchmarks... 22
5.4.2 Trace Generation ... ... ... 22
CHAPTER 6. SIMULATION RESULTS AND ANALYSIS... 25
6.1 INSTRUCTION CACHE RESULTS ... ... 25
6.2 BASE TRACE CACHE ... 26
6.3 EFFECTS OF HASHED INDEXING ... ... 31
6.4 EFFECTS OF TRACE LINE LENGTH ... ... 33
6.5 EFFECTS OF INCREASING BRANCH THROUGHPUT... ... 36
6.6 EFFECTS OF MODIFYING THE FILL MECHANISM... ... 38
6.6.1 Storing Only Complete Basic Blocks ... 38
6.6.2 Aborting a Trace Fill on a Trace Hit... 41
6.6.3 Specifying End Branch Direction ... ... 44
6.7 EFFECTS OF PARTIAL HITS ... ... 45
6.8 EFFECTS OF ASSOCIATIVITY ... 48
6.9 EFFECTS OF TRACE CACHE SIZE ... ... ... 49
6.10 REPLACEMENT POLICY ... ... 52
6.11 EFFECTS OF REAL BRANCH PREDICTION... ... 53
CHAPTER 7. CONCLUSIONS ... 56
CHAPTER 8. FUTURE WORK ... 58
List of Figures and Tables
Figures
Figure 1-1: Typical Superscalar Design with Fetch and Execute Engines... 2
Figure 1-2: Noncontiguous Basic Blocks From Taken Branches... ... 4
Figure 1-3: Basic Functioning of Trace Cache... 5
Figure 3-1: Trace Cache Fetch Mechanism... . I...11
Figure 3-2: Trace Cache Line-fill Buffer Operation with n=16 and m=3... 13
Figure 3-3: Misrepresented Trace Cache Hit Resulting from Starting with Delay Slot... 14
Figure 3-4: Correlated Predictor Scheme Extended To Increase Predictor Throughput... 15
Figure 6-1: Fetch IPC for Instruction Cache Fetch Mechanism... ... 26
Figure 6-2: Fetch IPC for Base Trace Cache Fetch Mechanism ... 27
Figure 6-3: Performance Improvement of Base Trace Cache... 28
Figure 6-4: Base Trace Cache Miss Statistics... ... 30
Figure 6-5: Trace Cache Miss Cause Breakdown ... . ... ... 30
Figure 6-6: Hashed Indexing into the Trace Cache ... ... 32
Figure 6-7: Fetch IPC of Trace Cache with Hashed Indexing... ... 32
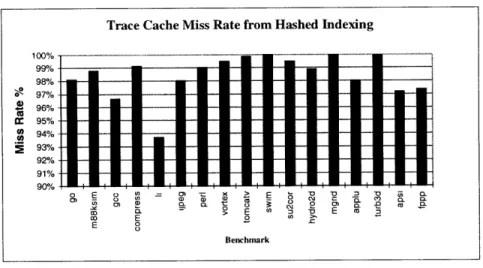
Figure 6-8: Trace Cache Miss Rate from Hashed Indexing... 33
Figure 6-9: Fetch IPC as a Function of Maximum Trace Length ... ... 34
Figure 6-10: IPC Improvement from Increased Trace Line Length ... 35
Figure 6-11: Integer Fetch IPC as a Function of Branch Throughput... 37
Figure 6-12: Average Written/Read Trace Statistics for Branch Throughput = 5... 37
Figure 6-13: Unnecessary Trace Storage from Offset Traces... ... ... 39
Figure 6-14: Fetch IPC When Only Storing Complete Basic Blocks ... 40
Figure 6-15: Improvement When Only Storing Complete Basic Blocks... 40
Figure 6-16: Miss Rate When Only Storing Complete Basic Blocks... 41
Figure 6-17: Redundant Traces from Trace Fills Allowing Trace Hits... 42
Figure 6-18: Fetch IPC When Aborting a Trace Fill on a Trace Hit... ... 42
Figure 6-19: Miss Rate When Aborting a Trace Fill on a Trace Hit... ... 43
Figure 6-20: Fetch IPC for Traces with Specified End Br. Direction ... 44
Figure 6-21: Trace Cache Modifications to Allow Partial Hits... 46
Figure 6-22: Fetch IPC of Trace Cache Allowing Partial Hits... ... 47
Figure 6-23: Trace Cache Miss Rate from Allowing Partial Hits... 47
Figure 6-24: Integer Fetch IPC from Increased Cache Associativity ... 48
Figure 6-25: Trace Cache Miss Cause Breakdown for a 2-way Set Associative Trace Cache... 49
Figure 6-26: Integer Fetch IPC as a Function of Trace Cache Size... ... 50
Figure 6-27: FP Fetch IPC as a Function of Trace Cache Size... 50
Figure 6-28: Integer Miss Rate as a Function of Trace Cache Size... 51
Figure 6-29: FP Miss Rate as a Function of Trace Cache Size ... ... ... 51
Figure 6-30: Fetch IPC from Different Replacement Policies... ... 52
Figure 6-31: Fetch IPC from Using Real Branch Predictor... ... ... 53
Figure 6-32: Branch Misprediction Rates... 54
Tables Table 1-1: Average Dynamic Basic Block Sizes for SPECint95 Benchmarks... 3
Table 5-1: Description of SPEC95 Benchmarks... ... 22
Table 5-2: Traces for Benchmarks... ... 24
Table 6-1: Instruction Cache Parameters ... ... 25
Table 6-2: Base Trace Cache Design... ... 27
Table 6-3: Average Written/Read Trace Statistics ... .... ... 29
Chapter 1
Introduction
1.1 Background and Motivation
In today's modern microprocessor, many aggressive techniques are employed in order to exploit instruction level parallelism. The trend of these high performance superscalar microprocessors has been to widen dispatch and issue paths in order to increase their effective IPC (instructions per cy-cle). To this end, each successive microprocessor generation has increased parallel functional units, more physical registers, larger instruction issue windows, and deeper branch speculation. Currently, microprocessors such as the MIPS R10000, Sun UltraSPARC, and AMD K5 are capa-ble of issuing up to four instructions per cycle [28], [29], [30]. Next generation microprocessors will have even higher issue rates as hardware parallelism increases.
The focus on increasing instruction issue width in recent years has introduced a possible perform-ance bottleneck in these superscalar architectures. In order to fully exploit instruction level paral-lelism, it is necessary to balance the increased issue rate of these superscalar processors with suffi-cient instruction fetch bandwidth. If instructions cannot be issued fast enough, then overall per-formance will drop as execution resources lie idle. Thus, there is a need to explore new techniques for increasing instruction fetch bandwidth. Increasing fetch bandwidth can improve overall per-formance in two ways. First and foremost, the increased number of fetched instructions can be used to fill idle functional unit resources. In addition, since there are more instructions, more inde-pendent instructions can be found for issue.
Traditional superscalar architectures can be thought as being divided into two main components: an instruction fetch unit and an execution unit. The fetch and execution units are connected by an instruction issue buffer which serves to decouple the two components. The instruction fetch engine fetches and decodes the dynamic sequence of instructions in the program and places them in the
instruction issue buffer. The instruction execution engine takes instructions from the issue buffer and executes them as soon as data dependencies are resolved and resources become available. Control dependencies, in the form of branch and jump instructions, provide a feedback mechanism between the fetch and execution engines.
Instruction
Buffers
Figure 1-1: Typical Superscalar Design with Fetch and Execute Engines
From Figure 1-1, it is apparent that increasing instruction fetch bandwidth is necessary as the exe-cution engine becomes more parallel and issue rates rise. Instruction fetch bandwidth has tradi-tionally been controlled by factors such as the cache hit rate and branch prediction accuracy. The cache hit rate affects fetch bandwidth because overall instruction cache performance is directly proportional to it. Branch prediction accuracy affects the fetch bandwidth because of the mispre-dict recovery time. These two factors have long been identified as fetch performance bottlenecks and are relatively well-researched topics. The design of instruction caches has been studied in great detail in order to lessen the impact of instruction cache misses on fetch bandwidth [31]-[36]. Likewise, there have been many studies done to improve branch prediction accuracy [16]-[25].
To date, the techniques developed to reduce instruction cache misses and increase branch predic-tion accuracy have been very successful in improving fetch bandwidth. However, as the issue rates for superscalar processors increase beyond four, other additional factors become increasingly
im-portant to instruction fetch performance. These factors include the frequency of control transfer instructions, branch prediction throughput, noncontiguous instruction alignment, and fetch unit latency. Conventional instruction caches are limited in their effectiveness by control transfer
in-structions present within the instruction stream. Since branch prediction is currently limited to the one branch, an instruction cache can only fetch up to one basic block's worth of instructions per cycle. Since control transfer instructions occur relatively frequently in an instruction stream (approximately 1 in 5 instructions for common integer code), they create a bottleneck in the in-struction fetch bandwidth of the processor. Table 1-1 provides the percentage of control transfer instructions in a program and the resulting average basic block sizes for the SPECint95 bench-marks.
SPECint95 % Control Transfer Average Basic
Benchmark Instructions Block Size
go 15.7% 6.32 m88ksim 16.8% 5.88 gcc 18.2% 5.41 compress 13.7% 7.33 ii 21.6% 4.63 ijpeg 6.7% 13.87 perl 18.8% 5.32 vortex 21.7% 4.62
Table 1-1: Average Dynamic Basic Block Sizes for SPECint95 Benchmarks
In order to increase instruction fetch bandwidth, one needs to either increase the basic block size or fetch multiple basic blocks every cycle. A great deal of compiler research has been conducted in order to increase the basic block length, including research on how to decrease the frequency of taken branches [37], [38]. The other possibility is to increase the number of branch predictions, or branch throughput, that can be made during a given cycle. Currently, only one branch can be pre-dicted ahead of time. This limits the amount of instructions that can be fetched, given the fre-quency of control transfer instructions in a typical fetch stream.
Unfortunately, increasing branch throughput does not solve everything. Even if multiple branch prediction is employed, the presence of taken branches results in noncontiguous instruction fetch-ing. Instruction caches store static instruction blocks from memory. With multiple branch predic-tion, specialized interleaved instruction caches can be made to fetch beyond a control transfer in-struction if the next basic block is contiguous [2]. However, in general dynamic inin-struction se-quences do not always lie in contiguous cache locations, as in the case of taken branches and
jumps. This presents a problem, as a conventional instruction cache cannot fetch noncontiguous blocks in a single cycle. Since taken conditional branches occur rather frequently (estimates of around 70% of the time [41], instruction fetch bandwidth is severely limited. Figure 1-2 illustrates the problem with taken branches and jumps:
Dynamic Instruction Stream
2 d.asic b lo c k -X . .. . ...
taken jump
The instruction blocks lie in noncontigu-ous locations within the instruction cache. Since a conventional cache cannot align these blocks in a single instruction block, the presence of taken branches results in the fetch of single basic blocks.
Figure 1-2: Noncontiguous Basic Blocks From Taken Branches
Finally, fetch unit lateny has a large effect on processor performance since incorrect control transfer instruction speculation results in the need to flush the fetch pipeline. Increasing the fetch latency, as is necessary for allowing higher branch prediction throughput and noncontiguous basic block fetching, limits fetch bandwidth.
The above issues that are emerging as limiting factors in instruction fetching have prompted several significant research studies. A fill mechanism to accomplish noncontigous basic block fetching and alignment has been proposed [6], [7]. In addition, there has been significant work in the area of multiple branch prediction in combination with multiple basic block fetching [2]. These research studies all address the issues of branch throughput and noncontiguous instruction fetching but at the cost of the last factor, namely fetch unit latency. This last issue is addressed with the groundbreaking work in the development of trace caches. A trace cache provides a low latency mechanism for concatenating basic blocks to form instruction traces that are dynamically created during instruction fetching [1].
The trace cache captures and stores instruction sequences, called traces, from the dynamic fetch stream. Later on during program execution, if the same instruction sequence is present in the dynamic instruction stream, then the instruction sequence can be fetched from trace cache. Traces
Instruction Cache
- 2 basic block
are specified by a start address as well as the branch outcomes of the control transfer instructions present within it. For a given fetch iteration, if the starting address of a particular trace matches the fetch address, and the predicted outcomes of the branches match the branch directions specified in the trace, then the trace cache provides the trace to the instruction buffer. The basic idea is that the stored instruction traces can cross basic block boundaries, allowing more than one basic block to be fetched in a given cycle. Figure 1-3 shows the high level functioning of the trace cache scheme:
Dynamic Instruction Stream
later...
tf FAM
I'
A n t
trace with starting address A, and two branches (not-taken, taken)
A completed trace is written into the trace cache along with branch status information.
V
'
1'
If the same trace (with starting address A and same branch outcomes n,t) occurs later, then the trace cache can provide the instructions to the instruction buffers.
Figure 1-3: Basic Functioning of Trace Cache
The trace cache takes advantage of temporal locality by storing dynamic traces for reuse. The trace cache is accessed in parallel with the instruction cache. Thus, in the worst case of a trace cache miss, normal instruction fetching proceeds through the instruction cache. The basic block concatenation for creating the traces is done off the critical path of the fetch mechanism so latency
Trace Cache
is not increased. This is the primary advantage of the trace cache over other noncontiguous basic block alignment mechanisms.
The concept of a trace cache exhibits great potential as a method to increase fetch bandwidth. However, beyond the original design presented in [1], there has been no significant studies that investigate the design space of trace caches. This lack of follow-up research on such a promising idea presents the motivation for this thesis. The research for this thesis attempts to explore the design space of trace caches by examining the performance effects of critical trace cache design parameters. The ultimate goal is to design a high bandwidth instruction fetch mechanism suitable for actual implementation into a future generation microprocessor.
1.2 Thesis Overview
The remaining portion of this thesis is presented in seven chapters. In Chapter 2, relevant previous work is discussed. Chapter 3 describes the basic trace cache design and branch prediction mecha-nisms. Chapter 4 summarizes the trace cache design issues that will be addressed in the thesis. The simulation methodology is presented in Chapter 5. Simulation results and the ensuing discus-sions are presented in Chapter 6. Finally, Chapter 7 provides concludiscus-sions to this research, fol-lowed by a chapter on future work.
Chapter 2
Prior Work
There have been several techniques that has been proposed to overcome the bottleneck presented by control transfer instructions within the dynamic instruction stream. These techniques were devel-oped from a number of recent studies on high instruction fetching bandwidth and is closely related to the research for this thesis. All of these studies deal with proposals for aligning multiple non-contiguous basic blocks from the instruction cache in order to increase instruction fetch bandwidth. The groundwork for the multiple basic block fetching was done by Yeh, Marr, and Patt, who pro-posed the idea of a Branch Address Cache (BAC) as a fetch mechanism to increase instruction fetch bandwidth [2]. This mechanism consists of an interleaved instruction cache, a multiple branch predictor, an interchange and alignment network, and the branch address cache itself. The BAC can be viewed as an extension to a branch target buffer, in which the starting address of the next basic block is provided for a single given branch. The BAC is a generalized BTB in the sense that it provides the starting addresses of the next m basic blocks, given the multiple branch predic-tions for the next m branches (here, m is a small integer set by the implementation). These starting addresses are fed into the instruction cache, which aligns the basic blocks together. A second fetch mechanism proposed by Dutta and Franklin [3] also has a variant of a branch address cache for multiple branch targets. However, they provide an alternative method of single-cycle multiple branch prediction.
A third instruction fetch mechanism was proposed by Conte, Menezes, Mills, and Patel which features a collapsing buffer (CB) [4]. It is composed of an interleaved branch target buffer, an interleaved instruction cache, a multiple branch predictor, and an interchange and alignment net-work with collapsing buffer logic. Two access iterations are made to the interleaved branch target buffer, allowing two noncontiguous cache lines to be fetched. The collapsing buffer then merges the appropriate instructions from the cache lines together to form the fetch block.
The fetch mechanisms proposed above have a number of disadvantages, namely:
1) An additional pipeline stage before the instruction fetch may be required, because the pointers to all the noncontiguous instruction blocks must be generated before fetch can begin.
2) Additional hardware complexity in the instruction cache because multiple noncontiguous cache lines must be accessed simultaneously.
3) An additional pipeline stage after the instruction fetch may be required, in order to merge and align instruction blocks after they are fetched for the issue buffer.
More recently, another fetch mechanism was proposed by Rotenburg, Bennett, and Smith [1] that eliminates the above disadvantages of the two previously discussed instruction fetching schemes. It involves a special instruction cache called a trace cache to capture dynamic instruction sequences. The trace cache removes the instruction fetch bandwidth bottleneck by storing these dynamic se-quences of instructions (i.e. traces) as the program executes via a fill buffer. These traces can be composed of multiple basic blocks and may contain one or more taken branches.
In this scheme, a trace cache would be used in conjunction with a standard instruction cache. The branch predictor of the processor would provide the predicted branch direction of the next few branches in the program, and if they matched the direction of the branches within a stored trace, the trace cache is used to fill the issue buffer instead of the conventional instruction cache. If no match is made, then fetching proceeds in a standard manner from the instruction cache. Instruc-tions from the instruction cache are merged by a fill buffer over time and written to the trace cache when the fill buffer is done with assembling the trace.
The advantage of this setup is the fact that the fill buffer does not lie on the critical path of the in-struction fetch, and hence latency through this structure has little impact on overall performance. The basic assumption is that augmenting an instruction cache with a trace cache and associated fill buffer can significantly improve the fetch IPC performance of a microprocessor.
A trace cache only improves performance if dynamic sequences of instructions are commonly re-executed. This seems to be the case, both because of temporal locality, in which instructions used recently have a high probability of being used again, and branch behavior, since most branches are usually heavily biased toward one direction.
There are two other previously proposed hardware mechanisms that exhibit similarities to the trace cache scheme but were developed for other applications. Melvin, Shebanow, and Patt [5] pro-posed a fill unit mechanism to cache RISC-like instructions from a CISC instruction stream. Franklin and Smotherman [6], [7] extended the functionality of the fill unit to assemble instructions from a fetch stream into VLIW-like instructions to be cached in a structure called a shadow cache. The purpose of the shadow cache is to remove the need for dependency checking in the issue stage, thereby reducing complexity in wide issue processors.
Work on multiple branch prediction is also very relevant, as all of the above schemes rely on it in some form. Recently, Wallace and Bagherzadeh have proposed schemes for multiple branch and block prediction [8]. Since the introduction of the trace cache, path prediction has also become a topic of interest. Path prediction is a form of program execution prediction, where paths of execu-tion are predicted. Both Rotenburg [9] and Conte [10] have made contribuexecu-tions to this area of re-search.
Chapter 3
Trace Cache Fetch Mechanism
This chapter describes the implementation details of the trace cache fetch mechanism discussed in the introduction. It is based on the original trace cache device proposed by Rotenburg, et. al. [1], which forms the foundation for this thesis research. The basic trace cache mechanism is described in detail first, followed by a description of the associated multiple branch predictor.
3.1 Trace Cache
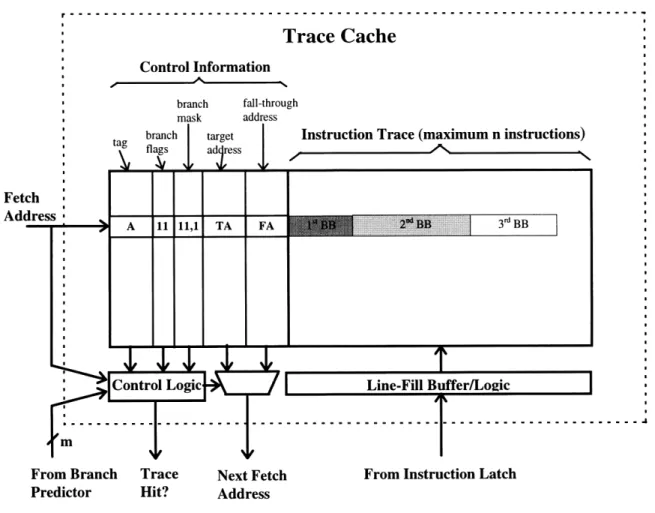
The fetch scheme using a trace cache works in conjunction with a standard instruction cache. At the beginning of each cycle, the trace cache is accessed in parallel with the instruction cache based on the fetch address. The multiple branch predictor generates the branch outcomes for the next couple of branches while the caches are being accessed. If there is a trace cache hit, then the trace is read from the trace cache into the instruction issue buffer. A trace cache hit occurs when the fetch address matches the address tag of a trace and the branch predictions match the branch di-rections of the trace. If either of these conditions is not true, then there is a trace cache miss and normal instruction fetching proceeds from the instruction cache. The complete trace cache fetch mechanism is depicted in Figure 3-1.
Fetch Adc
:tion
Figure 3-1: Trace Cache Fetch Mechanism
The trace cache itself consists of instruction trace lines, control information, and line-fill buffer logic. The trace lines hold the actual instructions in the trace. The maximum trace length n is specified by the trace cache line width. Each trace is also constrained by the maximum number of branches m present within the trace. Every trace line has associated with it some control
informa-tion, namely:
Valid Bit: Indicates whether or not a trace line contains a valid trace.
Tag: Identifies the starting address of the trace, i.e. the higher order bits of the address for the
first instruction of the trace.
Branch Flags: A single bit for each branch within the trace to indicate whether or not the
branch was taken or not taken. The mh branch of the trace does not need a flag since no in-structions follow it. Therefore, only m - 1 bits are needed to encode the branch flags.
* Branch Mask: Some state is needed to indicate the number of branches within the trace. This information is used by both the trace cache, to determine how many branch flags to check, and by the branch predictor, for updating. The first log2(m+1) bits encode the number of branches
present in the trace. The branch mask also has an extra bit to determine whether or not the last instruction of the trace is a branch. If so, the corresponding branch flag does not have to be checked since no instructions follow it.
* Trace Target Address: The next fetch address if the last instruction is a branch and is pre-dicted taken.
* Trace Fall-through Address: The next fetch address if the last instruction to the trace is a branch and is predicted not-taken.
For a 64-entry direct-mapped trace cache with 16 instruction traces (n=16, m=3), 4kbytes is needed for instruction store, and a minimal 712 bytes is used for the control information.
The line-fill buffer is used to latch basic blocks together to form the traces to be written into the trace cache. The basic blocks are latched one at a time into the fill buffer as instruction fetching proceeds. The fill logic merges each new basic block with the instructions already in the line-fill buffer. Filling is completed when either the maximum trace length n or the maximum number of branches in the trace m is reached. When either case occurs, then the contents of the fill buffer are written into the trace cache, along with the control information. The branch flags and mask is gen-erated during the line-fill process, and the trace target and fall-through addresses are computed at the end of the line fill. If the trace does not end in a branch, then the target address is set equal to the fall-through address. The complete trace cache and line fill mechanism is described in the Figure 3-2.
In order to simplify the fill logic for the trace cache, the trace cache simply does not store indirect jumps, returns, or traps. Whenever one of these instructions is encountered, the trace fill truncates at that instruction. In addition, unconditional branches and calls are simply treated as conditional branches that are highly predictable. Thus, no special case is needed to deal with them.
Trace Cache
Control Information branch fall-through
Instruction Trace (maximum n instructions)
Fet Adl
From Branch Trace Next Fetch From Instruction Latch
Predictor Hit? Address
Figure 3-2: Trace Cache Line-fill Buffer Operation with n=16 and m=3.
In the above figure, the line-fill buffer combines 3 basic blocks fetched from the instruction cache to form the trace. Each basic block is latched into the buffer one at a time. In this case, the branch limit m is reached after the third basic block. After this point, the instruction trace and the appro-priate control information are written into the trace cache.
The fill logic for the trace cache is complicated by the fact that there are different classes of control transfer instructions that must be handled differently. Control transfer instructions can come as conditional branches, unconditional branches, calls and direct jumps, indirect jumps, returns, and traps. The trace cache design described is only capable of dealing with conditional branches. Indi-rect jumps, returns, and trap instructions are not included in traces, as these instructions can have an indeterminate number of targets. Since the predictor can only predict one of two targets (the
jump target or fall-through target), the trace cache scheme cannot handle these control transfer in-structions. In addition, unconditional branches and calls should not be involved in prediction, since their outcome is known. This complicates the trace cache hit logic, since the trace cache must be able to identify these instructions within the trace and deal with them appropriately.
An issue of importance is the fact that the instruction fill should include the associated delay slot of the branch in question. In Rotenburg's implementation of the trace cache, a basic block ends in a branch and does not include the associated delay slot. Since the delay slot can be assumed as part of the basic block, the implementation that is considered in this research includes the delay slot when possible (i.e. when the maximum trace length has not been reached).
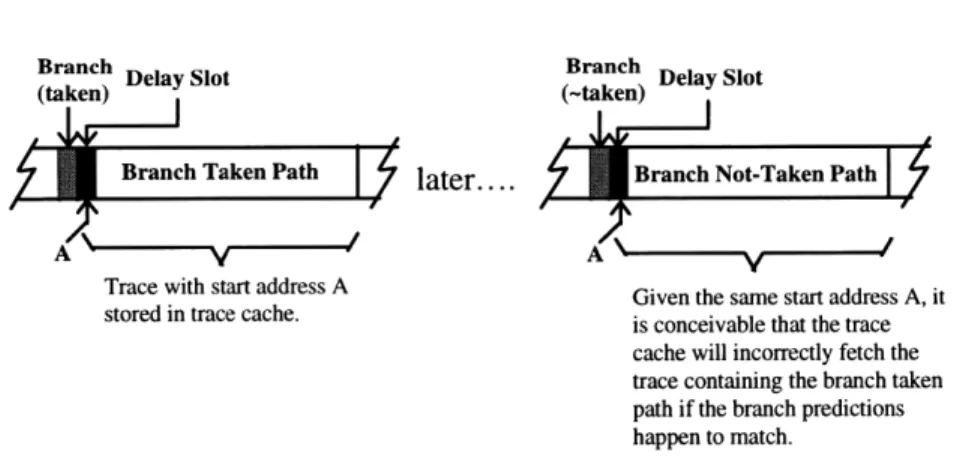
The trace cache design implemented for this thesis research also places the additional restriction whereby a trace cannot start with an instruction that is the delay slot of a branch. If a trace starts with the delay slot of a control transfer instruction, then the control information for the trace cache can inappropriately signal trace cache hits when it is not supposed to. Consider the following situation diagrammed in Figure 3-3. In this scenario, the trace cache will signal a trace hit, since the tag matches the fetch address and the branch directions match the branch predictions. This is the case even if the trace corresponds to wrong path of execution, as long as the branch directions of the trace happen to match the predictions. Based on existing control information, there is no way of determining whether the trace represents the correct path of execution. Thus, it is impor-tant to prevent traces starting with delay slots from being committed to the trace cache.
Dynamic Instruction Stream
Branch Branch
Branch Delay Slot Branch Delay Slot
(taken) (-taken)
Branch Taken Path later.... Branch Not-TakenPath
ran later....
A \A
Trace with start address A Given the same start address A, it
stored in trace cache. is conceivable that the trace
cache will incorrectly fetch the trace containing the branch taken path if the branch predictions happen to match.
3.2 Multiple Branch Prediction
The trace cache relies on a multiple branch predictor in order to determine whether or not the branch directions of a stored trace match the predicted branch outcomes of the instruction stream. The prediction accuracy of the branch predictor is critical to the performance of the trace cache, as mispredictions result in large trace abort penalties. Thus, the branch predictor used in this research is the Gag correlated branch predictor [21], based on its high prediction accuracy and its ability to be generalized to do multiple branch prediction.
In this scheme, a 16-bit global history register indexes into a pattern history table. The pattern history table actually consists of four sets of counters, which are then selected based on the predic-tion and history bits. Figure 3-4 shows the basic multiple branch predicpredic-tion scheme:
Pattern History Table
C
assays ui luul.
3 branch predictions
Chapter 4
Contributions of Thesis
The concept of a trace cache shows a great deal of promise, as it provides a method of effectively generating traces for instruction fetching that crosses basic block boundaries without increasing fetch latency. However, this area of research remains relatively untouched and there are a great deal of trace cache design issues that have not been explored. The focus of the research behind this thesis attempts to further improve fetch bandwidth by exploring the design space of trace caches. This thesis will attempt to refine and develop methods for improving fetch bandwidth beyond limits achievable by currently proposed mechanisms. Specifically, techniques are explored to decrease the trace cache miss rate and increase trace cache storage efficiency. The goal is to establish the viability of the trace cache as a practical hardware device for future high performance microprocessors.
4.1 Trace Cache Design Issues to Address
There is a considerable amount of research that can be done to expand upon Rotenburg, et. al.'s initial work on trace caches. In their paper, the authors only discuss a simple trace cache design. Important issues in trace cache design that this thesis research will address include:
1) Indexing: The simplest way of indexing into a trace cache is by directly using the bits from the fetch address. There are alternative indexing schemes, some of which involve hashing, that may result in more uniform trace distribution within the trace cache.
2) Trace Length: One of the most basic parameters in trace cache design is how long a maxi-mum trace can be. If the trace length is set too high, then trace cache storage efficiency de-creases as the extra space within the trace line is wasted. Specifying a trace length that is too
small may also have detrimental effects on trace cache performance by decreasing the effective possible fetch bandwidth. It remains to be seen what the optimal length of a trace line should be.
3) Branch Throughput: The currently accepted standard for multiple branch prediction is lim-ited to a throughput of three. There is no reason to assume that this number is optimal for trace cache fetching. Studies need to be done to see if there is any additional benefit from in-creased branch throughput.
4) Fill Issues: There are a variety of different methods of how a trace is collected for the trace cache. Specifying how to determine traces for the trace cache can have a significant effect on performance. This includes issues of how the beginning of a trace is specified, how and when instructions are committed to the fill buffer, and how to terminate a trace.
5) Partial Matches: A common situation that arises is when the fetch address matches the start
address of the trace but not all of the branch predictions match the path of the trace. In such a situation, it is still feasible for the trace cache to provide instructions to the issue buffer, up to the last valid branch where the prediction matches the taken path. This scheme results in addi-tional complexity, including the addiaddi-tional costs of storing intermediate basic block addresses.
6) Associativity: One of the problems of indexing traces within the trace caches by a start ad-dress is the fact that only one trace from a given adad-dress can be stored. An alternative method of storage is to increase the trace cache associativity, which could reduce thrashing effects from traces that start with the same address.
7) Sizing: Increasing the size of a trace cache can obviously have a deep impact on performance. However, there has been no research done as to how performance scales with trace cache size.
8) Replacement Policy: As with standard caches, there are several different methods of choosing which trace to replace when filling the cache. It is possible that the replacement algorithm chosen might affect overall trace cache performance.
All the above design issues can be applied to the general trace cache framework proposed by Ro-tenburg, in which the trace cache acts as a supplementary device to the instruction cache. There also exists the possibility of generalizing the instruction cache by completely replacing it with a trace cache. In this scheme, the trace cache acts as the main mechanism in the instruction fetch,
with a L2 cache used as the source for trace fills. The details of the viability of this scheme pres-ents another focus area for this thesis.
4.2 Long-Term Roadmap of Research
The research for this thesis can be broken down into a number of general steps which are summa-rized below:
1) Initial statistical gathering and infrastructure development. This includes writing a trace ana-lyzer to collect basic statistics such as average trace lengths, basic block sizes, branch frequen-cies, number of dynamic basic blocks in a trace, instruction cache hit rates, etc. for standard representative programs.
2) Judiciously selecting metrics suitable in characterizing performance, such as fetch IPC and trace cache miss rate.
3) Implementing a parameterizable trace cache simulator and doing extensive simulating on typi-cal workloads to determine performance improvement of the different trace cache designs over standard instruction fetch mechanisms.
4) Analyzing design issues and iterating refinements based on simulation results. The intent is to refine the original trace cache design as much as possible to maximize trace cache performance.
Chapter
5
Simulation Methodology
The research for this thesis is to be primarily simulation-based and entails the development of a trace-driven simulator in order to gather results and validate trace cache design. In this chapter, the simulation methodology such as the simulation environment, simulation model, performance metrics, and test workload are each discussed in turn.
5.1 Simulation Environment
The simulator development for this research was done under the Mips Technologies Incorporated (MTI) Architecture Simulation Environment. The Architecture Group at MTI is responsible for performance and behavioral simulation for MTI's microprocessor line. In addition, the group is
involved with investigation of general architectural innovations for next-generation processors. In order to facilitate the development of simulators, a well-developed simulation environment was created by the Architecture group. The simulation environment consists of 1) standard benchmark execution trace collections, 2) standard tools for running simulations, and 3) user-provided simu-lators. The trace cache simulator was developed using this infrastructure. The standard bench-mark trace collection is used as the source of simulator inputs, as discussed below under the test workload section. The trace cache simulator is trace-driven, in which an instruction input trace is fed to the simulator for statistics gathering (such as trace cache miss ratio, fetch bandwidth, over-all, etc.).
5.1.1 Trace-driven Simulation
The simulation tools run simulations by feeding benchmark execution traces to the simulators. Thus, this type of simulation is called trace-driven simulation. Trace-driven simulation is used over other forms or simulation (such as cycle simulation) for a number of reasons. These reasons
include: 1) trace-driven simulation is much faster, 2) representative traces for the SPEC bench-marks already existed, and 3) trace-driven simulation is architecture independent.
The data results collected from this study are all from trace-driven simulation. A distinction must be made between the input traces used in the simulation of the trace cache and the dynamic traces that the trace cache actually stores in the simulator. Trace-driven simulation refers not to the traces stored within the trace cache but to the benchmark application instruction streams that the simulator runs on in order to generate statistics.
There is a problem with trace-driven simulation, namely that incorrect speculation cannot be simulated, as traces represent the actual correct path of execution. This may result in some inaccu-racies in the model, as the cache structures do not see the contamination effects of fetching and executing wrongly speculated instructions. However, it is assumed that such effects are negligible and that trace-driven simulation is accurate enough for the purposes of this study.
5.2 Simulation Model
Since this research is focused on increasing instruction fetch bandwidth, the fetch engine of the mi-croprocessor is the primary module of interest and is modeled in detail. The trace cache and in-struction cache fetch mechanism, as described in the Trace Cache Mechanism chapter, is imple-mented under the simulation environment.
In order to isolate the performance effects of the fetch mechanism, it is assumed that the machine stalls for reasons only pertaining to the fetch mechanism and not from issues related to the instruc-tion queue or execuinstruc-tion backend. The fetch mechanism can stall on instrucinstruc-tion cache misses and incorrect branch predictions.
When using a real branch predictor, an incorrectly predicted branch results in a misprediction pen-alty. This penalty arises from the need to abort all instructions fetched after the misprediction point. Since the simulator only deals with the fetch portion of the machine (i.e., the execution backend of the processor is not simulated), this mispredict penalty must be approximated. In order to simplify the development of the machine model, all the details of the instruction issue queue and execute engine are abstracted away. For the simulations that involve real branch prediction, the mispredict penalty is simply assumed to be six cycles [2]. This means that instructions following an incorrectly predicted branch will not be fetched until six cycles after the branch is fetched. In
effect, the mispredict penalty embodies all the effects of a mispredicted branch, including aborting the trace and flushing instructions from the instruction queues, etc.
Although the misprediction penalty determination is very simple, it provides an effective way of approximating the effect of branch prediction accuracy on trace cache performance. Using an av-erage misprediction penalty gives a rough estimate on how mispredicted branches affect fetch IPC
and is deemed sufficiently accurate for the purposes of this research.
5.3 Performance Metric
The primary performance metric used for this research is fetch IPC (instructions per cycle) from the fetch mechanism. The fetch IPC represents the number of instructions that can be fetched by either the trace cache or primary instruction cache and gives a basic performance gauge of the trace cache and its improvement over using just an instruction cache.
Other metrics of interest include the trace cache miss rate, the miss rate per instruction, and the instruction miss rate. The trace cache miss rate indicates the percentage of attempted trace cache accesses that result in a trace cache miss. The instruction miss rate represents the trace cache miss rate normalized by the number of instructions fetched. The misses/instruction is usually used as the traditional performance metric for caches. Finally, one can measure the miss instruction ratio, or the percentage of instructions fetched not supplied by the trace cache. One goal of this research is to reduce these trace cache miss metrics to the lowest level possible.
5.4 Test Workload
In order to determine the performance of the trace cache fetch mechanism, a suite of programs rep-resentative of actual program behavior must be chosen to base performance measurements on. The SPEC benchmark suite is the most widely recognized and used benchmark suite in industry as well as academia, and thus will be used in this research as the primary benchmark source to gauge per-formance. The SPEC benchmark suite consists of eight integer benchmarks written in C, and ten floating point benchmarks written in Fortran. A brief description of each benchmark is provided in Table 5-1 below:
Benchmark Description SPEC95, INT
099.go Artificial Intelligence, plays the game of Go.
124.m88ksim Motorola 88K RISC CPU simulator, runs test program.
126.gcc New Version of GCC, the GNU C Compiler, builds SPARC code. 129.compress Compresses and uncompresses file in memory using Lempel-Ziv coding. 130.1i Lisp interpreter.
132.ijpeg Graphic compression and decompression. (JPEG)
134.perl Manipulate strings (anagrams) and prime numbers in Perl. 147.vortex A database program.
SPEC95, FP
101.tomcatv Tomcatv is a mesh generation program. 102.swim Shallow Water Model with 513 x 513 grid. 103.su2cor Quantum physics. Monte Carlo simulation.
104.hydro2d Astrophysics. Hydrodynamical Navier Stokes equations 107.mgrid Multi-grid solver in 3D potential field.
110O.applu Parabolic/elliptic partial differential equations. 125.turb3d Simulate isotropic, homogeneous turbulence in a cube.
141.apsi Solve weather conditions (temp., wind, velocity) and distribution of pollutants. 145.fpppp Quantum chemistry
#146.wave5 Plasma physics. Electromagnetic particle simulation.
Table 5-1: Description of SPEC95 Benchmarks
5.4.1 General Characteristics of SPEC95 Benchmarks
The integer programs represent the bottleneck in instruction fetching, resulting from an average basic block size of around 5. The dynamic basic blocks of the floating-point benchmarks are all significantly larger than the corresponding numbers for the integer benchmarks. This is because the floating-point benchmarks contain more scientific-based code and thus have large parallel loop structures to iterate computations. This is in contrast with the tighter, more complex looping be-havior of integer benchmarks. Among the integer benchmarks themselves, the most interesting ones to look at are 099.go and 126.gcc because they exhibit the most erratic behavior and stress the ability of the fetch mechanism to fetch instructions.
5.4.2 Trace Generation
The benchmarks in the SPEC95 suite range from between 25 billion to 90 billion instructions, making it virtually impossible to run the simulator through the complete inputs given the computa-tion resources. Thus, it is necessary to generate a set of reasonable length instruccomputa-tion traces that
are still representative of the original benchmarks. There are two strategies for generating traces of reasonable size. The first involves using input sets that result in shorter benchmark run times. The second is to sample through the actual full trace at even intervals (such as recording 10 million in-structions, then skipping the next 90 million instructions and so on). The problem with the first approach is that reducing the problem size may significantly alter the program's behavior on the system. The problem with the second method is that making tradeoffs between accuracy and trace size is non-trivial.
Because it is paramount that the input traces encapsulate actual program behavior, the traces used for this research were created by sampling. The sampling strategy was tweaked for each applica-tion benchmark within the SPEC95 suite in order to capture the significant behavioral aspects of each program.
Profiling information for each benchmark was obtained by utilizing the R10000 hardware per-formance counters when running the benchmarks on a R10000 processor system. This profiling includes basic block, instruction, and instruction class distributions as well as data and instruction cache misses, branch mispredicts, and TLB misses.
Some benchmarks (specifically 099.go and 126.gcc) show dramatic changes in behavior through-out their program runs. For these benchmarks, an ordinary on/off sampling strategy is used. Spe-cial attention was given to the periods in the program runs that exhibited the most variation by taking more samples in those periods. For example, 126.gcc does not show any regular behavior for any of its inputs, so a number of the larger inputs were chosen and evenly sampled. In contrast, 099.go shows more drastic changes in the earlier parts of the program. Therefore, the benchmark was divided into 4 sections, with the earlier sections being smaller, and a specified number of 10-million instruction samples were evenly obtained from each section.
Other benchmarks have a cyclic pattern, with their periods comparable to trace lengths that a simulator could execute in reasonable amount of time (around 200 million instructions). For these benchmarks, one or more slices of 200 million instructions were taken consecutively so that one entire cycle of behavior is captured. The programs that exhibit cyclic behavior include the integer benchmarks 129.compress and 132.ijpeg and the FP benchmarks 147.vortex, 102.swim, 104.hydro2d, 107.mgrid, l 10.applu, 125.turbo3d, 146.wave5. For a couple of these benchmarks (namely 147.vortex and 146.wave5), the periods of their cyclic behavior was larger than 200M
instructions. For 147.vortex, sampling was done in chunks around the interesting areas whereas for 146.wave5, the behavior was captured over two trace slices.
Finally, some benchmarks do not exhibit any sort of pattern but have different periods of varying behavior. In this case, each period is sampled by different strategies such as in variable length chunks, or on/off sampling, etc. Benchmarks that exhibit such behavior include 124.m88ksim,
130.1i, 134.perl, 101.tomcatv,103.su2cor, 141.apsi, and 145.fpppp.
By applying a sampling strategy in this way, only about one billion instructions were needed to generate the sampled traces which represent the entire 717 billion instruction run of the SPEC95 reference set. These traces were created by the MTI Architecture Group and are used as the source of instruction traces for this research. Since the trace samples represent less than 0.15% of the actual benchmark runs, it is important to verify that the sampled traces actually represent actual benchmark behavior. To provide an independent check on how representative the sampled traces are, the profile information for a complete program run was compared to the behavior of the sam-pled traces. Since the profile results for the samsam-pled trace matched the distributions for the actual program run, there is some assurance that the samples are accurate representations of actual code execution. Table 5-2 lists the benchmarks traces that are used in this study.
Integer Number of Traces Floating Point Number of Traces
Benchmarks (-200M Inst. each) Benchmarks (-200M Inst. each)
099.go 2 101.tomcatv 3 124.m88ksim 2 102.swim 1 126.gcc 2 103.su2cor 3 129.compress 2 104.hydro2d 2 130.1i 3 107.mgrid 1 132.ijpeg 3 110.applu 2 134.perl 2 125.turb3d 3 147.vortex 4 141.apsi 1 145.fpppp 3 146.wave5 3
Chapter 6
Simulation Results and Analysis
In this chapter, the general results of the thesis research are presented. Using the simulation meth-odology described in the previous chapter, the effects of various parameters on trace cache per-formance and efficiency are explored. The results section starts by presenting the simulation re-sults for a conventional instruction fetching mechanism, as compared with a base trace cache de-sign. Different aspects of the trace cache design are then explored in turn. The section concludes with the effects of using a real branch predictor.
6.1 Instruction Cache Results
As a base method of comparison, the trace cache performance results are compared to a conven-tional instruction cache fetch mechanism. Table 6-1 summarizes the instruction cache parameters used as the comparison base:
Primary Instruction Cache
Size 128KB
Block Size 64B
Associativity 2
Replacement LRU
Miss Penalty 10 cycles
Table 6-1: Instruction Cache Parameters
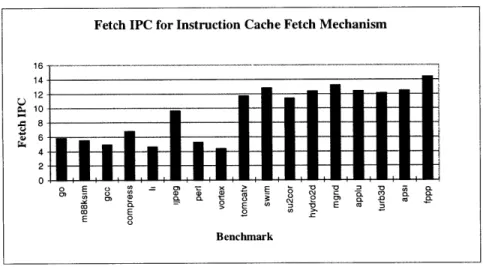
For these simulations, the maximum fetch bandwidth is set at 16 instructions/cycle. The resulting fetch IPC values when just using an instruction cache are show in Figure 6-1.
Figure 6-1: Fetch IPC for Instruction Cache Fetch Mechanism
From the figure, we notice several things immediately. For the integer benchmarks (first 8 bench-marks), the average fetch IPC out of the instruction cache is comparable to the average basic block size of the benchmark that was run. This is indicative of the fact that the basic block size is the limiting factor in the fetch IPC, as the instruction cache can only fetch up to one basic block at a time. This would mean for most common non-scientific applications, the bandwidth ceiling is lim-ited to an average of 5-6 instructions per cycle, regardless of the parallelism of functional units that might exist.
The fetch IPC values for the floating-point benchmarks are much higher than the corresponding values for the integer benchmarks. Since the branch frequencies are much smaller for these benchmarks than the integer benchmarks, the instruction cache can fetch more instructions in a
given cycle. This results in fetch IPC values that are much closer to the maximum fetch limit.
In the next section, we will see that by simply adding a trace cache in conjunction with the instruc-tion cache, we can significantly improve the fetch IPC and hence overall performance of the
micro-processor.
6.2 Base Trace Cache
The results derived above for the instruction cache fetch mechanism are first compared to that of the most basic trace cache design. For initial measurements, the original trace cache model from Rotenburg's design is used, as described in his paper [1]. This basic trace cache design has the following parameters:
Base Trace Cache Model Trace Entries 64
Trace Length 16 Instructions Max. # Brs. 3
Associativity 1 (direct-mapped) Overall Size 4 Kbytes
Table 6-2: Base Trace Cache Design
For these simulations, the maximum fetch rate for the simulator is equal to the trace cache line size, which is equal to 16 instructions in this case. Also, in order to isolate the effects of the trace cache itself, perfect branch prediction is assumed for the present. The results of the simulation runs are shown in Figure 6-2:
Figure 6-2: Fetch IPC for Base Trace Cache Fetch Mechanism
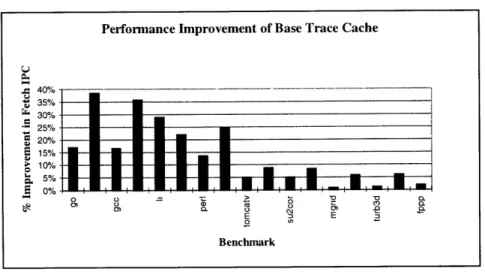
From the fetch IPC results for the basic trace cache design, we see immediately that augmenting the instruction cache with a small trace cache results in considerable fetch performance improve-ments. Figure 6-3 summaries the performance improvement of the trace cache fetch mechanism over a traditional instruction cache fetch device:
Fetch IPC for Base Trace Cache Fetch Mechanism
16 14 12 10 -8 b 4 2 - 0) X > o
~
V 0 a) E3 8)- C 0. 0.0 2 a -2 wl ( - E co W >1m Benchmark Benchmark v , , 0 U 0) 0 TcacheFigure 6-3: Performance Improvement of Base Trace Cache
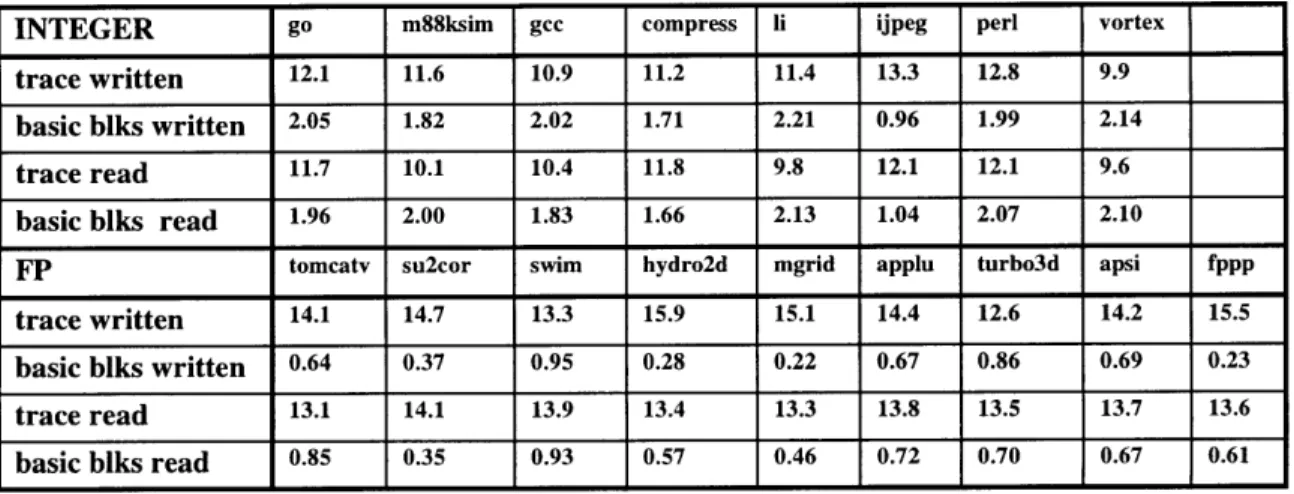
From Figure 6-3, it is apparent that the trace cache improves the performance of the integer benchmarks much more than the point benchmarks. In fact, a number of the floating-point benchmarks do not improve much at all. The reason is the trace cache only removes the limitation of fetching a single basic block. For the integer benchmarks, a basic block is only 5-6 instructions in length on average, so fetch IPC improves dramatically. However, the average basic block size for the floating-point benchmarks is already larger than the maximum fetch limit (16 instructions), so only marginal improvements in the fetch IPC can be made. The statistics for the average trace that is written into the trace cache and the average trace that is actually read from the trace cache are summarized in Table 6-3.
The statistics give an gauge as to how the instruction traces are being utilized by the fetch mecha-nism. From the table, it seems that there is not too much variation between the traces that are written into the trace cache and what is actually used by the fetch mechanism. The lack of varia-tion is a good indicavaria-tion that the traces stored in the trace cache are being equitably utilized by the fetch mechanism. Were this not the case, such as if the trace cache only used short traces or traces containing only one or two basic blocks, then there would be a greater disparity between the writ-ten and read trace statistics.
Performance Improvement of Base Trace Cache
u , 40% -35% 30% 25% 20% 15% a 5%-a) . CO = . 0 E nE = Benchmark
INTEGER go m88ksim gcc compress ii ijpeg perl vortex
trace written 11.3 11.0 10.2 10.7 10.8 13.1 11.6 9.3
basic blks written 1.94 1.73 1.92 1.66 2.05 0.82 1.82 2.09
trace read 10.4 9.5 9.9 11.3 9.4 11.7 11.0 9.0
basic blks read 1.83 1.86 1.77 1.53 1.91 0.97 1.90 2.02
FP tomcatv su2cor swim hydro2d mgrid applu turbo3d apsi fppp
trace written 13.8 14.3 13.0 15.1 15.0 14.0 12.0 13.6 15.3
basic blks written 0.58 0.34 0.87 0.22 0.15 0.59 0.83 0.64 0.18
trace read 12.3 13.6 13.6 12.8 13.2 13.2 12.9 13.4 13.5
basic blks read 0.80 0.32 0.88 0.53 0.34 0.69 0.63 0.62 0.55
Table 6-3: Average Written/Read Trace Statistics
It is pleasantly surprising to note that the average trace lengths for the integer benchmarks are ac-tually on par with that of the floating-point benchmarks. This fact shows how effective a trace cache is in improving the fetch bandwidth of the integer benchmarks. However, the traces for the integer benchmarks contain, between 1.5 to 2 basic blocks on average. This is in contrast to the floating-point benchmarks, which only store on average around half of a basic block. This con-forms to expectations, as the floating-point benchmarks have much larger basic blocks. Sections 6.3-6.7 describe results for attempts to further improve these trace statistics.
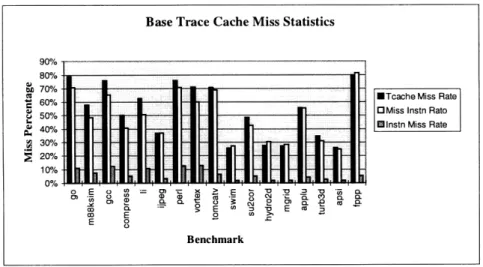
The final results of interest for the base trace cache design are the miss statistics. These trace cache miss rates are shown in Figure 6-4. The miss rates for the basic trace cache design are abysmal. For a majority of the benchmarks, more accesses occur from the instruction cache than from the trace cache. This is a noted problem with the implementation proposed by Rotenburg in his original paper. The corresponding instruction miss rates are an order of magnitude off from miss rates for current instruction caches.
Figure 6-4: Base Trace Cache Miss Statistics
One possible fetch mechanism design optimization is to have the trace cache completely replace the instruction cache as the primary fetching device, with a L2 cache used as a fill mechanism for the trace cache. However, it is not possible to realize such an implementation using the original trace cache design. The instruction miss rates are much too high, which would result in unacceptable performance losses given the miss penalty. Figure 6-5 shows the breakdown of the cause of a trace cache miss:
Trace Cache Miss Cause Breakdown
Benchmark OBr. Mismatch E Tag Mismatch Um 0 C.C + + 4 M
Figure 6-5: Trace Cache Miss Cause Breakdown
100% - 90%-t 80% 4J 70%1 60%1o 40%-o 30%- S201%-0% 0 E 00 E I ,-q I -g : :...: -- :-:, ::-: :: : i: --Ii -;--i ::i:::l c L-4- cl -el l E 0R '' ;r