HAL Id: hal-02323175
https://hal.archives-ouvertes.fr/hal-02323175
Submitted on 18 Nov 2020
HAL is a multi-disciplinary open access
archive for the deposit and dissemination of
sci-entific research documents, whether they are
pub-lished or not. The documents may come from
teaching and research institutions in France or
abroad, or from public or private research centers.
L’archive ouverte pluridisciplinaire HAL, est
destinée au dépôt et à la diffusion de documents
scientifiques de niveau recherche, publiés ou non,
émanant des établissements d’enseignement et de
recherche français ou étrangers, des laboratoires
publics ou privés.
A Versatile Method to Enhance the Operational Current
of Air-Stable Organic Gas Sensor for Monitoring of
Breath Ammonia in Hemodialysis Patients
Shang-Yu Yu, Tin-Wei Tung, Yu-Chih Lee, Chang-Chiang Chen, Hsiao-Wen
Zan, Hsin-Fei Meng, Chia-Jung Lu, Olivier Soppera
To cite this version:
Shang-Yu Yu, Tin-Wei Tung, Yu-Chih Lee, Chang-Chiang Chen, Hsiao-Wen Zan, et al.. A Versatile
Method to Enhance the Operational Current of Air-Stable Organic Gas Sensor for Monitoring of
Breath Ammonia in Hemodialysis Patients. ACS Sensors, American Chemical Society, 2019, 4 (4),
pp.1023-1031. �10.1021/acssensors.9b00223�. �hal-02323175�
A Versatile Method to Enhance the Operational Current of
Or-ganic Gas Sensor for Point of Care Monitoring of Breath
Am-monia in Hemodialysis Patients
Shang-Yu Yu
†,‡, Tin-Wei Tung
†, Yu-Chih Lee
§, Chang-Chiang Chen*
,∥,⊥, Hsiao-Wen Zan*
,†, Hsin-Fei
Meng*
,§, Chia-Jung Lu
#, and Olivier Soppera
‡†Department of Photonics, College of Electrical and Computer Engineering, §Institute of Physics, and ∥
Department of Bio-logical Science and Technology, National Chiao Tung University, 1001, Ta Hsueh Rd.,300 Hsinchu, Taiwan
‡
Université de Haute-Alsace, CNRS, IS2M UMR 7361, F-68100 Mulhouse, Université de Strasbourg, France
⊥
Department of Internal Medicine, Division of Nephrology, National Taiwan University Hospital Hsin-Chu Branch, 25, Ln. 442, Sec. 1, Jingguo Rd., 300 Hsinchu, Taiwan
#
Department of Chemistry, National Taiwan Normal University, 162, Heping East Rd., Section 1, 106 Taipei, Taiwan KEYWORDS : Ammonia, breath, current enhancement, gas sensor, hemodialysis, POC device, stable performance
ABSTRACT: Point-of-care (POC) application for monitoring of breath ammonia (BA) in hemodialysis patients have emerged as a
promising non-invasive health monitoring approach. In this context, many organic gas sensors have been reported for BA detection. However, one of the major challenges for its integration with portable POC application is to achieve long lifetime and high opera-tional current at low voltage. Herein, we propose a double active layer (DL) strategy that exploits an ultra-thin layer of Poly(3-hexylthiophene-2,5-diyl) (P3HT) to serve as a work function buffer, combined with an acceptor-donor polymer Poly[[4,8-bis[5-(2-ethylhexyl)-2-thienyl]benzo[1,2-b:4,5-b’]dithiophene-2,6-diyl][2-(2-ethyl-1-oxohexyl)thieno[3,4-b]thiophenediyl]] (PBDTTT-C-T) as a new sensing material. We show that the DL sensor exhibits a sustainable enhanced operational current of microampere level and a stable sensing response even with the presence of P3HT layer. This effect is carefully examined with different aspect, includ-ing vertical composition profile of DL configuration, lifetime testinclud-ing on different sensinclud-ing layer, morphological analysis, and the versatility of the DL strategy. Finally, we utilize the CT/P3HT-DL sensor to conduct a long-term tracing of BA concentration in two hemodialysis (HD) patients before and after HD, and correlate it with the blood urea nitrogen (BUN) levels. A good correlation coefficient of 0.96 is achieved. The result demonstrates the potential of this DL strategy to be used to integrate organic sensor in
POC devices.
To enable the development of personalized medicine in the clouds and point-of-care (POC) applications, numerous re-search studies focused on developing non-invasive detecting methods to monitor disease related signals from human breath, saliva, tear, sweat, etc.1-2 In particular, breath analysis is con-sidered as a promising approach due to the easy availability of breath and its potential association with several human diseas-es.3-4 Human breath can contain many biomarkers associated with various diseases, typically in the form of volatile gas molecules. For example, nitric oxide (NO), acetone (ACE), carbon monoxide (CO) and ammonia in breath are regarded as biomarkers for asthma, diabetes, lung related conditions, and kidney diseases, respectively.5-12 Among these biomarkers, breath ammonia attracts lots of attention because of the preva-lence of chronic kidney disease (CKD) which is 14.8 percent in the United States adult population, suggesting that about 30 million Americans may have CKD.13 Besides, the economic burden of dialysis and CKD is increasing worldwide.14 Am-monia, produced by the catabolism of protein, is converted into urea through the urea cycle in the liver. Then the urea is removed from the body by the kidneys.15 Because of impair-ment of elimination of urea, CKD patients have urea nitrogen
levels higher than normal range. Therefore, for patients with end stage renal disease, the removal of urea nitrogen mainly relies on dialysis treatment. Typically, to determine the level of nitrogen in the body and the adequacy of dialysis treatment, a blood test is performed to acquire blood urea nitrogen (BUN) level.16 However, the fluctuation of the BUN level is related to the nutrition intake. Higher dietary protein intake may lead to an increase in BUN level that becomes harmful, while the insufficient protein intake could result in malnutrition condi-tion. Therefore, a low-cost, easy-handled, and real-time moni-toring device is needed to monitor the health condition in the CKD and dialysis patient.
Many studies have revealed that the ammonia concentration in exhaled breath is highly related to the BUN level.11-12, 17-21 To date, several instruments for the detection of breath volatile organic compounds have been well established in the clinical trial, such as selected ion flow tube mass spectrometry, gas chromatography/mass spectrometry, and laser photoacoustic spectroscopy.21-23 However, even with high precision and selectivity of these instruments, some limitations in terms of size and cost impede the integration of these techniques into portable POC devices. In the past few years, some researches
(including our prior works) based on organic devices have been reported for breath ammonia (BA) detection.24-28 These studies demonstrated the possibility of organic-based sensors for low cost and miniaturized sensing devices. In 2013, Hib-bard et al. have shown that a polyaniline nanoparticle-based sensor integrated with a breath sampling system was capable of measuring human BA in the hemodialysis (HD) patients, and obtained a good correlation coefficient of 0.96 between BA and BUN levels.25 However, despite all the advantages of organic sensors, most of them suffer from lifetime issue caused by degradation under air ambiance, which restricts the usage to the single-use disposable sensor. In 2017, our team reported a Poly[(9,9-dioctylfluorenyl-2,7-diyl)-co-(4,4-(N-(4-sec-butylphenyl)diphenylamine)) (TFB) based sensor that exhibits a high sensitivity in part per billion (ppb) regime and a good storage lifetime in the air. The sensor was further uti-lized to measure the BA in HD patients. The correlation coef-ficient between natural logarithm of BA concentrations (ln(BA)) and natural logarithm of BUN level (ln(BUN)) was 0.82.27 Although an organic sensor with improved lifetime was demonstrated, the low operational current as a few tens of nanoampere of the sensors caused by the intrinsically low carrier mobility of organic materials makes it hardly compati-ble with low-cost read-out circuitry.2 Thus, to achieve long lifetime and high operational current in organic based sensor still remain in challenge.
In this work, we propose a new double active layer (DL) strategy to enhance the operational current of the organic sensor. Combined with an acceptor-donor polymer Poly[[4,8- bis[5-(2-ethylhexyl)-2-thienyl]benzo[1,2-b:4,5-b’]dithiophene-2,6-diyl][2-(2-ethyl-1-oxohexyl)thieno[3,4-b]thiophenediyl]] (PBDTTT-C-T) as a new sensing material, the DL sensor with a stable ammonia sensitivity and an enhanced operational current of microampere level is demonstrated. The sensor structure is based on numerous cylindrical nanopores.29 The DL strategy exploited an ultra-thin layer of Poly(3-hexylthiophene-2,5-diyl) (P3HT) to serve as a work function buffer for carrier transfer, and showed no substantial effect on sensing stability. The effect of this strategy was carefully investigated by several steps. The vertical composition profile was firstly confirmed by coupling UV-vis spectrophotometer and reactive ion etching. Then, a comparative study of the sensing performance and the surface morphology of different sensing layers were conducted to investigate the sensing be-havior overtime. Remarkably, by replacing the PBDTTT-C-T with TFB, we also show the high compatibility of our strategy to different organic sensing material. Finally, we examined the selectivity of PBDTTT-C-T/P3HT DL sensor and utilized the sensors to conduct a long-term tracing of BA concentration in two HD patients. A good correlation coefficient of 0.96 be-tween In(BA) and ln(BUN) was recorded, demonstrating an easy and feasible approach for integrating organic sensor in POC devices.
EXPERIMENTAL SECTION
Fabrication of the Ammonia Sensor. Figure 1(a) shows
the concept of cylindrical nanopore architecture of ammonia sensors. The cylindrical nanopore were fabricated via the colloid lithography method. Firstly, a pre-cleaned indium tin oxide (ITO) glass substrate with designed pattern was treated with oxygen plasma (100 W 600 s) to increase surface energy and form hydrophilic surface. A cross-linkable poly(4-vinylphenol) (PVP) layer (thickness ~ 300 nm) was then
spin-coated on the ITO substrate and annealed at 200 °C for 1 h. After annealing, a thin layer of P3HT was spin-coated onto PVP and annealed at 200 °C for 10 min. This P3HT layer served as a surface modification layer to ensure a good adhe-sion of negatively charged polystyrene (PS) nano-spheres (Fluka, 200 nm diameter).30 To form monolayer PS nano-spheres which served as a shadow mask for Al electrode depo-sition, the substrate was immersed into PS solution (10 wt% in ethanol) for 90 s and dipped into boiling isopropanol (IPA) for 8 s to remove excess PS spheres. Then the substrate was dried immediately by nitrogen flow. After Al deposition, the PS nano-spheres were then peeled off with 3M Scotch Tape to obtain porous top electrode with the thickness of 60 nm. The porous top electrode further served as another shadow mask for subsequent oxygen plasma etching. During etching pro-cess, the PVP in the area not covered by the top electrode was removed, thus forming the cylindrical nanopore structure. Finally, three different types of active layer were deposited onto the structure and annealed at different temperatures, enabling the conduction of vertical current. For sidewall single layer (SL) sensors, PBDTTT-C-T (0.9 wt% in chlorobenzene), TFB (0.7 wt% toluene), or P3HT (1.5 wt% in chlorobenzene) was deposited on the structure by blade-coating (PBDTTT-C-T and (PBDTTT-C-TFB)or by spin-coating (P3H(PBDTTT-C-T) and annealed at 80°C for 10 min, 200°C for 10 min, and 180°C for 40 min, respec-tively. The molecular structure of PBDTTT-C-T and P3HT are shown in Figure 1(b). The thickness of PBDTTT-C-T and P3HT single sensing layer was around 41 nm and 35 nm, respectively. For sidewall double layer (DL) sensors, P3HT (0.5 wt% in chlorobenzene) was spin-coated onto the structure and annealed at 200°C for 10 min prior to the deposition of PBDTTT-C-T and TFB, forming a thin layer (thickness ~ 13 nm) as work function buffer. For blended layer sensors, the weight ratio between PBDTTT-C-T and P3HT was fixed at 5:1 (0.9 wt% in chlorobenzene). The blending layer was blade-coated on the structure and annealed at 80°C for 10 min. After fabrication, all sensors were stored under air atmosphere, covered by Al foils to prevent the photo-induced degradation. Figure 1(c) shows the cross-section image of PBDTTT-C-T DL sensors by scanning electron microscope (SEM). It can be observed that the active layer wraps well around the structure, increasing the surface to volume ratio to achieve ppb-range sensitivity.
Figure 1. (a) The schematic drawing of device structure and con-cept of sidewall single layer and double layer sensors. (b) The molecular structure of PBDTTT-CT and P3HT. (c)SEM cross-section image of PBDTTT-CT DL sensor.
Thin Film Characterization. The properties of organic
sensing layers were characterized by UV-vis spectrophotome-ter and the atomic force microscopy (AFM). The sensing materials were deposited on plain glass with the same condi-tions as those on cylindrical nanopore structure. The absorp-tion spectra of organic thin films were recorded by UV-vis spectrophotometer (Agilent Technologies Cary 50). To further verify the vertical composition profile of the double layer film, the film was etched incrementally by reactive ion etching and subsequently recorded the absorption spectrum. The reactive ion etching (SYSKEY) with gas flow of 40 sccm and RF generator power of 30W was used. The thickness of films was confirmed by microfigure profilometer (Kosaka Laboratory Ltd., ET200) before and after each etching steps. The surface morphologies of organic thin films were investigated by using AFM (Picoplus 5500 Agilent) in resonant mode. Si3N4 tips
with a typical resonance frequency of 285 kHz (stiffness 42 N/m) were used. The thin film of sensing material was formed on the top of PVP film to provide a same surface condition as on cylindrical nanopore structure.
Ammonia Measurement System. The schematic and
pic-ture of ammonia sensing system are shown in Figure 2(a),(b). The system comprised a desiccation cylinder (sodium hydrox-ide (NaOH)) to provhydrox-ide a steady relative humidity (RH) around 10% and eliminate the interference from ambiance RH variation, a sensing chamber where the sensors are mounted, an electric source measurement unit (Keysight U2722A USB modular) to apply operational voltage on sensor and read out electric signal, a rotameter to control the flow at 500 cc/min, a pump to provide a constant air flow, and a humidity measure-ment unit to confirm the RH value during experimeasure-ments. To evaluate the sensing performance, the target gas was intro-duced into the system automatically by step-motor. The con-centration of target gas was determined by the injection speed of step-motor and background air flow.27 However, the meas-uring time of each target gas was fixed at 30 s and the opera-tional voltage of all sensors was fixed at 5V. Therefore, a comparable calibration curve between different sensors can be created by plotting response versus ammonia concentration. The response was calculated by ΔI/I0 x 100.
Figure 2. Ammonia measurement system. (a) The schematic drawing of measurement system. The blue arrows illustrate the gas flow direction. (b) Picture of measurement system indicating relative position of all components.
Measurement of Breath Ammonia in HD Patients. We
recruited two stable patients on long-term HD treatment, three times per week for four to five hours per HD session. BA
concentrations and BUN levels were checked before and after HD every one to two months. Total three times of pre- and post-hemodialysis measurements of BA and BUN levels were performed in HD center at National Taiwan University Hospi-tal Hsin-Chu Branch. For breath sample collection, a sample bag (Taiwan ISO Biotec. Co.,Ltd.) that can seal by a gas valve was used. Firstly, after fasting for at least four hours, the pa-tient blew directly into the sample bag and sealed the valve. Next, the breath sample was filtered through a NaOH tube to remove most water molecular. Finally, the breath sample was introduced into the measurement system with a fixed measur-ing time of 30 s. The whole collection and measurement pro-cess was completed within a few minutes. The BA of patients were examined pre- and post-hemodialysis by PBDTTT-C-T/P3HT DL sensors. The BUN measurements were performed immediately after BA measurements by the hospital laborato-ry.
RESULTS AND DISCUSSION
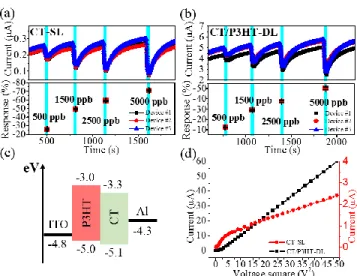
To study the mechanism of double active layer, the PBDTTT-C-T-based gas sensors were fabricated with SL and DL con-figuration of active layer. PBDTTT-C-T will be denoted as CT in the following part. Figure 3(a),(b) presents the real-time current measurements of CT-SL and CT/P3HT-DL sensors and their responses to different concentration of ammonia. For both configuration, three individual sensors were tested simul-taneously. The cyan region represents the time under ammonia exposure, which was set to 30 s; in other cases, the sensors was purged with constant dry air. The ammonia concentrations were 500 ppb, 1500 ppb, 2500 ppb, and 5000 ppb. From the real-time current measurement, it can be noticed that the cur-rent level of CT/P3HT-DL sensor is roughly 1 order larger than CT-SL sensor. Moreover, in both sensors, the current drops significantly when the sensors are exposed to ammonia. This phenomenon is usually explained by a redox reaction.31-32 For CT, a p-type organic material, the hole is major carrier in conjugated chain. When CT sensor is exposed to ammonia, a reducing agent, part of the major carriers in CT are trapped by ammonia’s lone electron pairs. The hole concentration in CT, thus, becomes lower and results in a decrease of current. By fixing the ammonia exposure time, the current variation ratio which is the current drop divided by the initial current can be defined as the sensing response. The average responses to different ammonia concentrations and standard deviation of three sensors were plotted in the lower part of figures. The sensing responses of CT-SL sensor to 500 ppb, 1500 ppb, 2500 ppb, and 5000 ppb were 25.8%, 49.2%, 58.9%, and -71.1%, respectively; In the other hand, those of CT/P3HT-DL sensor were -12.5%, -29.2%, -37.6%, -50.3%, respectively. Both sensors displayed a good sensitivity to ammonia. How-ever, the CT/P3HT-DL sensors exhibited a lower sensing response compared to CT-SL. This result can be attributed to the elevation of current level in CT/P3Ht-DL sensor, which decrease the relative current variation upon ammonia expo-sure. Additionally, the increase of current level can be as-cribed to the good matching of work function in DL configura-tion, as shown in Figure 3(c). The current was injected from the ITO electrode to the Al electrode. The work functions of ITO and Al are 4.8 eV and 4.3 eV, respectively. It is noted that the work function of ITO after oxygen plasma treatment can be slightly increased.33 The presence of P3HT with a HOMO level about 5 eV served as a buffer layer, favored the hole injection property between ITO and CT layer. An enlarged
current level can, hence, be expected. To confirm this assump-tion, I-V characteristic measurement was performed on both sensors. The current versus voltage square was plotted to verify the SCLC dominated conduction, shown in Figure 3(d). Although a linear dependence was observed
Figure 3. Real-time current measurement and corresponding ammonia sensing response of (a) CT-SL sensors and (b) CT/P3HT-DL sensor exposing to ammonia concentrations of 500 ppb, 1500 ppb, 2500 ppb, and 5000 ppb, sequentially. (c) Energy level diagram of CT/P3HT-DL sensor. (d) The dependence of current versus voltage square in both CT-SL and CT/P3HT-DL sensor.
in both curve, CT/P3HT-DL sensor showed a lower voltage requirement to reach SCLC regime. According to SCLC mechanism, this result indicated that the injection barrier of CT/P3HT-DL sensor is lower than those of CT-SL sensor, which was coincident with our assumption.34-35
To further investigate the sustainability of current enhance-ment and the effect on sensing stability overtime, the electrical properties and response of sensors were followed in a period of 15 days. Figure S1(a),(b) in the supporting information shows the I-V characteristic of CT-SL and CT/P3HT-DL sensor on different days. The current values of both sensors at 5 V were extracted and plotted over storage day, as shown in Figure 4(a). A similar evolution trend of current was observed. In the first week, the current of both sensors declined to a certain extent and then became stable. However, CT/P3HT-DL sensor displayed a constantly superior current level around 1 order to SL sensor. Moreover, the current is sustained around microampere level, confirming that the DL strategy can provide a sustainable current enhancement. Next, the stability of the sensors was examined by the evolution of cali-bration curves overtime. The calicali-bration curves were built up by plotting the response as a function of ammonia concentra-tion. The calibration curves of CT-SL, CT/P3HT-DL and P3HT-SL on different days are displayed in Figure 4(b)(c)(d), respectively. Although the calibration curve of CT-SL sensor declined slightly in the beginning of few days, it became sta-ble and retained at the certain level without deformation, demonstrating an excellent response stability and reliability overtime. Similarly, the calibration curve of CT/P3HT-DL sensor exhibited a good reproducibility after few days of aging. Contrarily, the calibration curve of P3HT-SL sensor decayed severely and deformed after storing under air ambient for only
2 days. After 7 days of storage, the P3HT-SL sensor shows almost no response to the
Figure 4. (a) The evolution trend of current value at 5 V over storage time for CT-SL sensors and CT/P3HT-DL sensor. The calibration curve of (b) CT-SL sensor, (c) CT/P3HT-DL sensor, and (d) P3HT sensor on different days, plotted as the sensing response as a function of ammonia concentration. All sensors were stored under air atmosphere and covered by Al foils.
ammonia. However, it is well known that P3HT degrade very fast under air environment.36-37 The results above indicating that the utilization of DL strategy can not only provide a sus-tainable current enhancing but also retain a similar sensing stability of SL sensor.
Interestingly, even with the presence of P3HT in DL con-figuration, the response stability of CT/P3HT-DL sensor was not significantly affected. To understand this effect, the verti-cal composition profile of DL configuration was firstly inves-tigated via UV-vis absorption spectroscopy coupled with incremental oxygen plasma etching. As shown in Figure 5(a), the pure P3HT film displays two absorption peaks at 540 and 610 nm. In the other hand, the pure CT film shows two ab-sorption peaks at 656 and 707 nm. For DL film, the abab-sorption spectrum corresponds to the superposition of P3HT and CT spectra. Following the intensity variation of these distinctive peaks enabled to verify the composition variation after oxygen plasma etching. The thickness of CT/P3HT-DL film was etched from 62 nm to 45 nm, and to 9 nm which is thinner than the original P3HT layer in the DL film. It can be ob-served that both P3HT and CT characteristic peaks presented in three conditions, indicating the presence of CT material even in the bottom part of the CT/P3HT-DL film. This results indicated that during the DL fabrication process, when the CT solution was blade-coated onto the thin P3HT layer, the P3HT layer was partially dissolved by the solution, forming a layer of the mixture of CT and P3HT. To confirm the composition of the upper part film, the CT absorption spectra was subtract-ed from the spectra of DL films, shown in Figure 5(b). The identical absorption spectra of both conditions revealed that the P3HT material in the DL film was intact during the first oxygen plasma etching treatment. According to the result above, the vertical composition profile of CT/P3HT-DL film can, therefore, be confirmed that the upper part of the film was enriched with CT material and the bottom part was consisted of the mixture of CT and P3HT.
Figure 5. (a) UV absorption spectra of pure P3HT film, pure CT film, the pristine CT/P3HT-DL film and those etched to different thickness. (b) The absorption spectra of CT/P3HT-DL films with the subtraction of CT spectra from its original spectra; the insert shows the schematic drawing of vertical composition profile of CT/P3HT-DL film.
Since the sable sensing property of CT/P3HT-DL sensor may be attributed to the intrinsic stability of CT material or the mixture of CT/P3HT, we therefore tested the blended CT/P3HT materials as sensing layer in the same structure for comparison. The blended CT/P3HT sensor was fabricated by coating the CT/P3HT solution onto the cylindrical nanopore structure, and the responses to different ammonia concentra-tion on different days were measured (Figure 6). As shown in Figure 6(a), the response of blended CT/P3HT sensor declined slightly in the first week and then became stable. The current level retained around 10-7 during storage. As plotting the re-sponses to different concentration of ammonia into the calibra-tion curve, an evolucalibra-tion trend of calibracalibra-tion curve over storage days similar to that of the CT-SL sensor can be observed in Figure 6(b). This results demonstrate that the blended CT/P3HT sensor can also exhibit a stable sensing property, which can be explained by the increase of organic-organic interaction in the blended materials.38-40 However, it is noted that the sable sensing response can, indeed, be achieved in the blended CT/P3HT sensor, but due to the lack of progressive matching of work function as in DL configuration, the opera-tional current enhancement was no longer seen in blending CT/P3HT sensor.
Figure 6. (a) Responses of the blending CT/P3HT sensor to 500 ppb, 1500 ppb, 2500 ppb, and 5000 ppb ammonia concentration on different days. (b) The calibration curve of the blended CT/P3HT sensor on different days.
Next, a morphological study of the organic thin films sur-faces was performed via AFM to investigate its effect on sens-ing stability. Figure 7 presents the AFM topography images of fresh CT, blending CT/P3HT, and P3HT samples and those after 15 days storage, respectively. In fresh samples, two types of morphology were observed. The CT and blended CT/P3HT films displayed a larger grain feature, while that of P3HT films was smaller and denser. Besides, from the phase-mode AFM images in Figure S2 in the Supporting Information, we
cannot observe any significant phase difference in the blend-ing film, indicatblend-ing that the two materials homogeneously distributed in the film at the nanoscale. This results revealed that the morphological property of the blended film was domi-nated by the property of CT material, which may contribute to the stable sensing response of the blending CT/P3HT sensor. Moreover, after 15 days storage, the surface roughness of all samples retained at same level, and no phase separation can be found in the blending film. We can thus confirm that the deg-radation of films is mainly through the route of chemical reac-tion instead of the structural modificareac-tion in the polymer it-self.37
Figure 7. AFM images of fresh (a) CT, (b) blended CT/P3HT, and (c) P3HT films on the top of PVP layer, and those after 15 days storage. The storage condition is as same as that of sensors. The obtained roughness values are mentioned in respective image.
After studying the effect of DL configuration, the versatility of this DL strategy was further tested by replacing the CT sensing layer with TFB material. The molecular structure of TFB and the energy level diagram of TFB/P3HT-DL sensor are shown in Figure S3 in the Supporting Information. The same effect of operational current enhancement was expected by work function matching. As shown in Figure 8(a), the TFB/P3HT-DL sensor exhibits a greater operational current than that of TFB-SL sensor. The same diminution of sensing response was also observed, which is caused by the elevation of current level. The responses to different ammonia concen-tration and the current level on different days were displayed in Figure 8(b). It was observed that the evolution trends of sensing response of the TFB/P3HT-DL sensor was similar to those of the CT/P3HT-DL sensor, and the operational current was also retained around microampere level during storage. This result demonstrates the potential versatility of the DL strategy to apply on different air stable sensing materials.
Figure 8. (a) Real-time current measurement and corresponding ammonia sensing response of TFB-SL and TFB/P3HT-DL sen-sors exposed to ammonia concentrations of 500 ppb, 1500 ppb,
and 2500 ppb, sequentially. (b) Responses of TFB/P3HT-DL sensors to different ammonia concentration on different days.
Finally, considering that the human breath is composed of various gaseous compound which may affect the ammonia detection precision and the requirement of wide detection range of exhaled ammonia concentration, good selectivity and wide detection range of the sensor are of paramount im-portance. We, therefore, measured the selectivity of the CT/P3HT-DL sensor by testing several biomarker related gases, including CO, NO, and ACE, as shown in Figure 9(a).5,
7, 9
The concentration of these gases was set at 500 ppb. Com-pared to ammonia, the sensor exhibited weaker response to CO (0.4%) and ACE (-0.9%). Although the sensor exhibited the response of 2.9% to 500 ppb NO, it is noted that the NO concentration in breath is normally lower than 30 ppb. For such concentration, the response is almost negligible in the CT/P3HT-DL sensor.41 Moreover, we also examined the de-tection range of the CT/P3HT-DL sensor. Figure 9(b) presents the calibration curve of the sensor with the detection range from 100 ppb to 5600 ppb. The response to 100 ppb, 500 ppb, 1000 ppb, 2800 ppb, and 5600 ppb ammonia was 0.52%, -6.74%, -11-21%, -23.81% and 31.81%, respectively. In gen-eral, the BA concentration in healthy individual and renal disease patient is ranging from 50 ppb to several ppm.42-43 Therefore, the detection range of the CT/P3HT-DL sensor is suitable for BA detection. The good response stability, good selectivity, and wide detection range of the CT/P3HT-DL sensor make it reliable for the clinical experiment.
Figure 9. (a) Responses of the CT/P3HT-DL sensor to 500 ppb CO, NO, ACE, and ammonia. (b) The calibration curve of the CT/P3HT-DL sensor with a detection range from 100 ppb to 5600 ppb.
After examined the properties of the CT/P3HT-DL sensor, we utilized the sensor with our sensing system as a POC de-vice to conduct a long-term tracing of BA concentration in two HD patients and studied the correlation between BA concen-trations and BUN levels. For the long-term tracing of HD patient, each patient had their BUN levels and BA concentra-tions measured before and after hemodialysis for three occa-sions. The interval between each occasion was one to two months. The BUN levels and the BA concentrations of each patient in each occasion were shown in Figure 10(a). Before HD, the BUN levels were relatively high (>60 mg/dL). Also, the BUN levels of one patient between each occasion were fluctuating. It might indicate that the protein intake and BA metabolism of the patient were different from time to time. After HD, a significant reduction of BUN levels to less than 30 mg/dL was seen. In the other hands, the same reduction can also be observed in BA concentrations following HD. The pre- and post-hemodialysis BA concentrations were ranging from 1277 ppb to 7084 ppb, and 50 ppb to 596 ppb, respectively, of which the ranges were reasonable as shown in previous
stud-ies.18-19, 27 The sensor’s lower limit of the BA concentration detection was defined as 50 ppb. Subsequently, the significant correlation between the natural logarithm of BA concentra-tions and the natural logarithm of BUN level is shown in Fig-ure 10(b). Pearson correlation coefficient (r) was 0.96, p <0.001. This value was comparable with the r obtained by Killard et al. (from 0.86 to 0.96 in 11 patients) and with r2 of 0.95 obtained by Narasimhan et al.18, 25 This result demon-strated that with the long-term tracing of patients, the high correlation coefficient could be achieved.
Figure 10. (a) Pre- and post-hemodialysis BUN levels and BA concentrations in two HD patients. (b) Correlation between BUN and BA concentrations in two HD patients. The Pearson’s correla-tion coefficient (r) is 0.96 with p <0.001. ln BUN : natural loga-rithm of BUN level, ln(Breath NH3) : natural logaloga-rithm of BA concentration.
CONCLUSION
A new double layer (DL) strategy to enhance the operational current of the organic sensor was proposed. By the effect of DL approach, the CT/P3HT-DL sensor exhibited a greater operational current than that of CT-SL sensor, while the stable sensing response overtime was still retained even with the presence of P3HT material. The effect of DL strategy was carefully examined with different aspect, including vertical composition profile examining, lifetime testing on different sensing layer, and morphological analysis. Moreover, the high versatility of this strategy was also demonstrated by TFB/P3HT-DL sensor. Finally, with a good sensing selectivity and a capability of measuring ammonia from 100 ppb to 5600 ppb, the CT/P3HT-DL sensor was utilized for long-term trac-ing of BA concentration in HD patients, leadtrac-ing to a good correlation coefficient of 0.96 between ln(BA) and ln(BUN). These finding demonstrate the potential of this DL strategy to be used to integrate organic sensor in POC devices.
ASSOCIATED CONTENT
Supporting Information.
I-V characteristic of CT-SL and CT/P3HT-DL sensor on different days, the AFM phase images of fresh CT, blending CT/P3HT, and P3HT samples and those after 15 days storage, the molecular structure of TFB and energy level diagram of TFB/P3HT-DL sensor. This material is available free of charge via the Internet at http://pubs.acs.org.
AUTHOR INFORMATION
Corresponding Author
*E-mail: cck85515@yahoo.com.tw.
*E-mail: hsiaowen@mail.nctu.edu.tw Fax:+886-3-5737681. *E-mail: meng@mail.nctu.edu.tw.
Hsiao-Wen Zan: 0000-0002-7685-1245
Notes
The authors declare no competing financial interest. ACKNOWLEDGMENT
The authors would like to thank all the master students in NCTU organic semiconductor lab for their supports for the data collec-tion in the clinical trial. This work was supported by funding from Ministry of Science and Technology, Taiwan (Project 107-2218-E-009-008).
REFERENCES
(1) Mascini, M.; Tombelli, S., Biosensors for biomarkers in medical diagnostics. Biomarkers 2008, 13 (7-8), 637-657.
(2) Tricoli, A.; Neri, G., Miniaturized Bio-and Chemical-Sensors for Point-of-Care Monitoring of Chronic Kidney Diseases. Sensors 2018, 18 (4), 18.
(3) Kim, K. H.; Jahan, S. A.; Kabir, E., A review of breath analysis for diagnosis of human health. Trac-Trends Anal. Chem. 2012, 33, 1-8.
(4) Arasaradnam, R. P.; Covington, J. A.; Harmston, C.; Nwokolo, C. U., Review article: next generation diagnostic modalities in gastro-enterology - gas phase volatile compound biomarker detection. Ali-ment. Pharmacol. Ther. 2014, 39 (8), 780-789.
(5) Nagasaki, T.; Matsumoto, H.; Kanemitsu, Y.; Izuhara, K.; Tohda, Y.; Horiguchi, T.; Kita, H.; Tomii, K.; Fujimura, M.; Yoko-yama, A., et al., Using Exhaled Nitric Oxide and Serum Periostin as a Composite Marker to Identify, Severe/Steroid-Insensitive Asthma. Am. J. Respir. Crit. Care Med. 2014, 190 (12), 1449-1452.
(6) Honkoop, P. J.; Loijmans, R. J. B.; Termeer, E. H.; Snoeck-Stroband, J. B.; van den Hout, W. B.; Bakker, M. J.; Assendelft, W. J. J.; ter Riet, G.; Sterk, P. J.; Schermer, T. R. J., et al., Symptom- and fraction of exhaled nitric oxide-driven strategies for asthma control: A cluster-randomized trial in primary care. J. Allergy Clin. Immunol. 2015, 135 (3), 682-U158.
(7) Deng, C. H.; Zhang, J.; Yu, X. F.; Zhang, W.; Zhang, X. M., Determination of acetone in human breath by gas chromatography-mass spectrometry and solid-phase microextraction with on-fiber derivatization. J. Chromatogr. B 2004, 810 (2), 269-275.
(8) Turner, C.; Walton, C.; Hoashi, S.; Evans, M., Breath acetone concentration decreases with blood glucose concentration in type I diabetes mellitus patients during hypoglycaemic clamps. J. Breath Res. 2009, 3 (4), 6.
(9) Deveci, S. E.; Deveci, F.; Acik, Y.; Ozan, A. T., The measure-ment of exhaled carbon monoxide in healthy smokers and non-smokers. Respir. Med. 2004, 98 (6), 551-556.
(10) Lee, A.; Sanchez, T. R.; Shahriar, M. H.; Eunus, M.; Perzanowski, M.; Graziano, J., A cross-sectional study of exhaled carbon monoxide as a biomarker of recent household air pollution exposure. Environ. Res. 2015, 143, 107-111.
(11) Neri, G.; Lacquaniti, A.; Rizzo, G.; Donato, N.; Latino, M.; Buemi, M., Real-time monitoring of breath ammonia during haemo-dialysis: use of ion mobility spectrometry (IMS) and cavity ring-down spectroscopy (CRDS) techniques. Nephrol. Dial. Transplant. 2012, 27 (7), 2945-2952.
(12) Limeres, J.; Garcez, J. F.; Marinho, J. S.; Loureiro, A.; Diniz, M.; Diz, P., A breath ammonia analyser for monitoring patients with end-stage renal disease on haemodialysis. Br. J. Biomed. Sci. 2017, 74 (1), 24-29.
(13) Saran, R.; Robinson, B.; Abbott, K. C.; Agodoa, L. Y. C.; Bhave, N.; Bragg-Gresham, J.; Balkrishnan, R.; Dietrich, X.; Eckard, A.; Eggers, P. W., et al., US Renal Data System 2018 Annual Data Report: Epidemiology of Kidney Disease in the United States. Am J Kidney Dis. 2018, 71 (3), (suppl 1):Svii,S1-S672.
(14) Wang, V.; Vilme, H.; Maciejewski, M. L.; Boulware, L. E., The Economic Burden of Chronic Kidney Disease and End-Stage Renal Disease. Semin. Nephrol. 2016, 36 (4), 319-330.
(15) Berg, J. M.; Tymoczko, J. L.; Stryer, L., Biochemistry, 5th edition. W H Freeman: New York, 2002.
(16) Locatelli, F.; Buoncristiani, U.; Canaud, B.; Kohler, H.; Petitclerc, T.; Zucchelli, P., Dialysis dose and frequency. Nephrol. Dial. Transplant. 2005, 20 (2), 285-296.
(17) Wakabayashi, H.; Kuwabara, Y.; Murata, H.; Kobashi, K.; Watanabe, A., Measurement of the expiratory ammonia concentration and its clinical significance. Metab. Brain Dis. 1997, 12 (2), 161-169. (18) Narasimhan, L. R.; Goodman, W.; Patel, C. K. N., Correlation of breath ammonia with blood urea nitrogen and creatinine during hemodialysis. Proc. Natl. Acad. Sci. U.S.A. 2001, 98 (8), 4617-4621. (19) Endre, Z. H.; Pickering, J. W.; Storer, M. K.; Hu, W. P.; Moor-head, K. T.; Allardyce, R.; McGregor, D. O.; Scotter, J. M., Breath ammonia and trimethylamine allow real-time monitoring of haemodi-alysis efficacy. Physiol. Meas. 2011, 32 (1), 115-130.
(20) Popa, C.; Dutu, D. C. A.; Cernat, R.; Matei, C.; Bratu, A. M.; Banita, S.; Dumitras, D. C., Ethylene and ammonia traces measure-ments from the patients' breath with renal failure via LPAS method. Appl. Phys. B-Lasers Opt. 2011, 105 (3), 669-674.
(21) Davies, S.; Spanel, P.; Smith, D., Quantitative analysis of am-monia on the breath of patients in end-stage renal failure. Kidney Int. 1997, 52 (1), 223-228.
(22) Fan, G. T.; Yang, C. L.; Lin, C. H.; Chen, C. C.; Shih, C. H., Applications of Hadamard transform-gas chromatography/mass spectrometry to the detection of acetone in healthy human and diabe-tes mellitus patient breath. Talanta 2014, 120, 386-390.
(23) Hibbard, T.; Killard, A. J., Breath Ammonia Analysis: Clinical Application and Measurement. Crit. Rev. Anal. Chem. 2011, 41 (1), 21-35.
(24) Li, L. Q.; Gao, P.; Baumgarten, M.; Mullen, K.; Lu, N.; Fuchs, H.; Chi, L. F., High Performance Field-Effect Ammonia Sensors Based on a Structured Ultrathin Organic Semiconductor Film. Adv. Mater. 2013, 25 (25), 3419-3425.
(25) Hibbard, T.; Crowley, K.; Kelly, F.; Ward, F.; Holian, J.; Wat-son, A.; Killard, A. J., Point of Care Monitoring of Hemodialysis Patients with a Breath Ammonia Measurement Device Based on Printed Polyaniline Nanoparticle Sensors. Anal. Chem. 2013, 85 (24), 12158-12165.
(26) Setka, M.; Drbohlavova, J.; Hubalek, J., Nanostructured Polypyrrole-Based Ammonia and Volatile Organic Compound Sen-sors. Sensors 2017, 17 (3), 28.
(27) Chuang, M. Y.; Chen, C. C.; Zan, H. W.; Meng, H. F.; Lu, C. J., Organic Gas Sensor with an Improved Lifetime for Detecting Breath Ammonia in Hemodialysis Patients. ACS Sens. 2017, 2 (12), 1788-1795.
(28) Guntner, A. T.; Pineau, N. J.; Mochalski, P.; Wiesenhofer, H.; Agapiou, A.; Mayhew, C. A.; Pratsinis, S. E., Sniffing Entrapped Humans with Sensor Arrays. Anal. Chem. 2018, 90 (8), 4940-4945. (29) Chuang, M. Y.; Chen, J. N.; Zan, H. W.; Lu, C. J.; Meng, H. F., Modulated gas sensor based on vertical organic diode with blended channel for ppb-regime detection. Sens. Actuator B-Chem. 2016, 230, 223-230.
(30) Lin, H. C.; Zan, H. W.; Chao, Y. C.; Chang, M. Y.; Meng, H. F., Review of a solution-processed vertical organic transistor as a solid-state vacuum tube. Semicond. Sci. Technol. 2015, 30 (5), 14. (31) Tiwari, S.; Singh, A. K.; Joshi, L.; Chakrabarti, P.; Takashima, W.; Kaneto, K.; Prakash, R., Poly-3-hexylthiophene based organic field-effect transistor: Detection of low concentration of ammonia. Sens. Actuator B-Chem. 2012, 171, 962-968.
(32) Zhou, X.; Niu, K. F.; Wang, Z.; Huang, L. Z.; Chi, L. F., An ammonia detecting mechanism for organic transistors as revealed by their recovery processes. Nanoscale 2018, 10 (18), 8832-8839. (33) He, K. D.; Yang, X. L.; Yan, H.; Wu, Z. H.; Li, Z. B.; Zhong, S. F.; Ou, Q. R.; Liang, R. Q., Work function changes of plasma treated indium tin oxide. Org. Electron. 2014, 15 (8), 1731-1737.
(34) Dacuna, J.; Salleo, A., Modeling space-charge-limited currents in organic semiconductors: Extracting trap density and mobility. Phys. Rev. B 2011, 84 (19), 9.
(35) Nicolai, H. T.; Mandoc, M. M.; Blom, P. W. M., Electron traps in semiconducting polymers: Exponential versus Gaussian trap distri-bution. Phys. Rev. B 2011, 83 (19), 5.
(36) Sai, N.; Leung, K.; Zador, J.; Henkelman, G., First principles study of photo-oxidation degradation mechanisms in P3HT for organ-ic solar cells. Phys. Chem. Chem. Phys. 2014, 16 (17), 8092-8099. (37) Rashmi; Kapoor, A. K.; Kumar, U.; Balakrishnan, V. R.; Basu, P. K., Degradation process in organic thin film devices fabricated using P3HT. Pramana-J. Phys. 2007, 68 (3), 489-498.
(38) Zhong, H. L.; Smith, J.; Rossbauer, S.; White, A. J. P.; Anthopoulos, T. D.; Heeney, M., Air-Stable and High-Mobility n-Channel Organic Transistors Based on Small-Molecule/Polymer Semiconducting Blends. Adv. Mater. 2012, 24 (24), 3205-3211. (39) Huang, L. Z.; Wang, Z.; Zhu, X. F.; Chi, L. F., Electrical gas sensors based on structured organic ultra-thin films and nanocrystals on solid state substrates. Nanoscale Horiz. 2016, 1 (5), 383-393. (40) Kolesov, V. A.; Fuentes-Hernandez, C.; Chou, W. F.; Aizawa, N.; Larrain, F. A.; Wang, M.; Perrotta, A.; Choi, S.; Graham, S.; Bazan, G. C., et al., Solution-based electrical doping of semiconduct-ing polymer films over a limited depth. Nat. Mater. 2017, 16 (4), 474-+.
(41) Ratnawati; Morton, J.; Henry, R. L.; Thomas, P. S., Exhaled breath condensate nitrite/nitrate and pH in relation to pediatric asthma control and exhaled nitric oxide. Pediatr. Pulmonol. 2006, 41 (10), 929-936.
(42) Timmer, B.; Olthuis, W.; van den Berg, A., Ammonia sensors and their applications - a review. Sens. Actuator B-Chem. 2005, 107 (2), 666-677.
(43) Broza, Y. Y.; Vishinkin, R.; Barash, O.; Nakhleh, M. K.; Haick, H., Synergy between nanomaterials and volatile organic compounds for non-invasive medical evaluation. Chem. Soc. Rev. 2018, 47 (13), 4781-4859.
Authors are required to submit a graphic entry for the Table of Contents (TOC) that, in conjunction with the manuscript title, should give the reader a representative idea of one of the following: A key structure, reaction, equation, concept, or theorem, etc., that is discussed in the manuscript. Consult the journal’s Instructions for Authors for TOC graphic specifications.
Insert Table of Contents artwork here
0 2 4 6 8 10 12 14 16 10-9 10-8 10-7 10-6 10-5 10-4 CT-SL CT/P3HT-DL C ur re nt ( A )
Storage time (Day)
single layer (SL)
Double layer (DL)
2.5 3.0 3.5 4.0 4.5 5.0 3 4 5 6 7 8 9 10Patient #1 and #23 Pre- hemodialysisPost-hemodialysis r = 0.96, p<0.001 ln B re at h N H In BUN