Supporting information
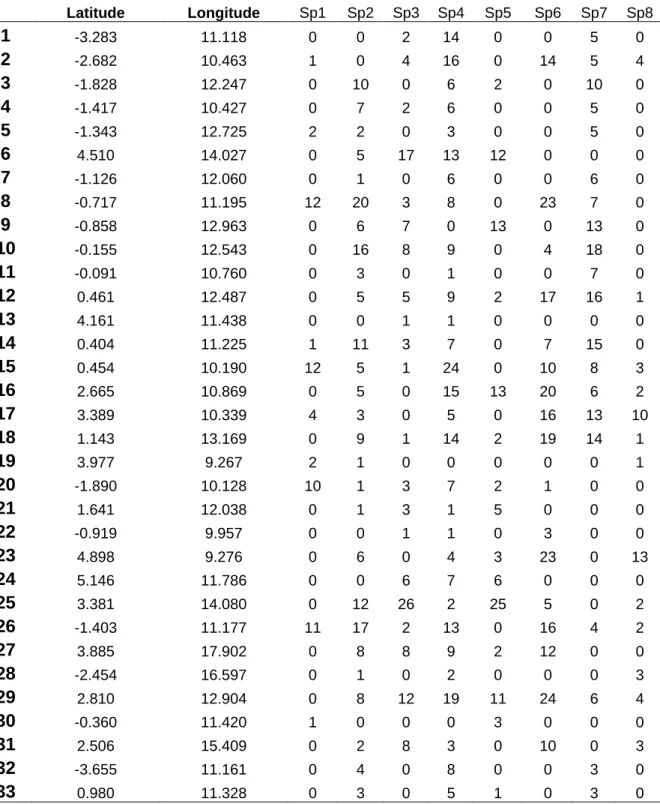
Table S1. List of localities, coordinates and numbers of individuals sampled for each species.
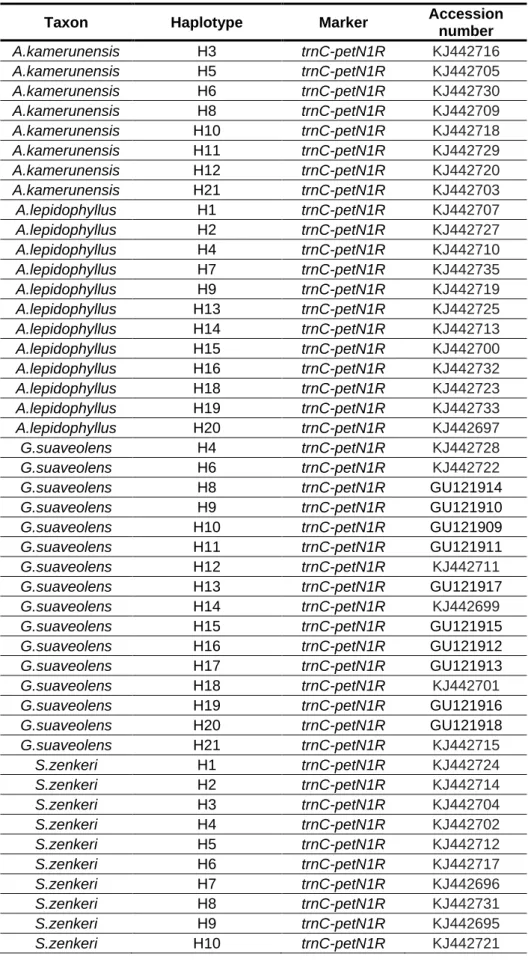
Table S2. Genbank accession number for each markers and species.
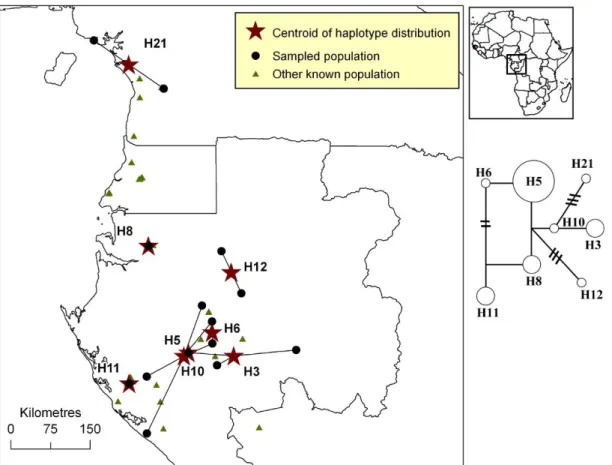
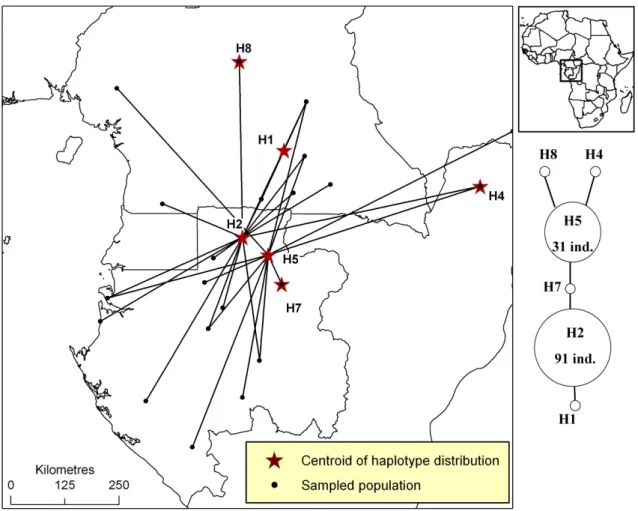
Figure S1. Distribution of plastid DNA haplotypes of Afrostyrax kamerunensis.
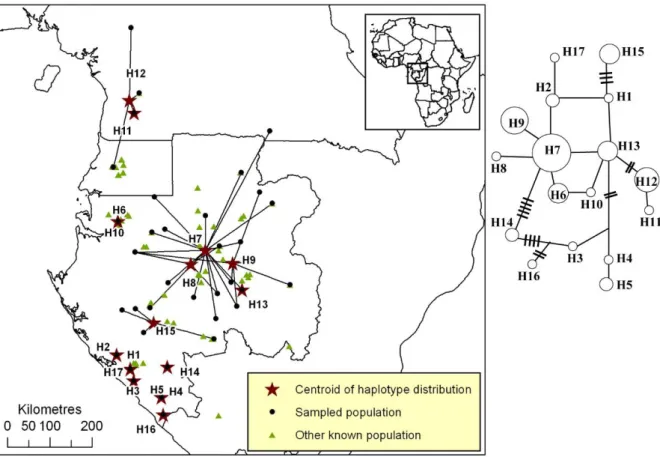
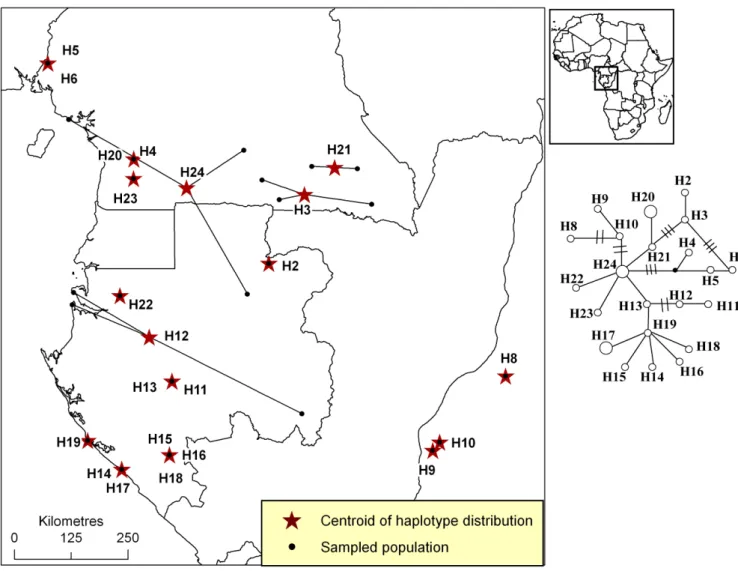
Figure S2. Distribution of plastid DNA haplotypes of Scorodophloeus zenkeri.
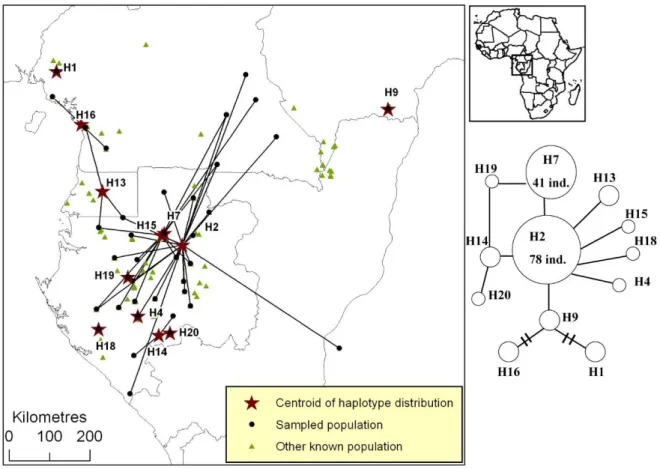
Figure S3. Distribution of plastid DNA haplotypes of Afrostyrax lepidophyllus.
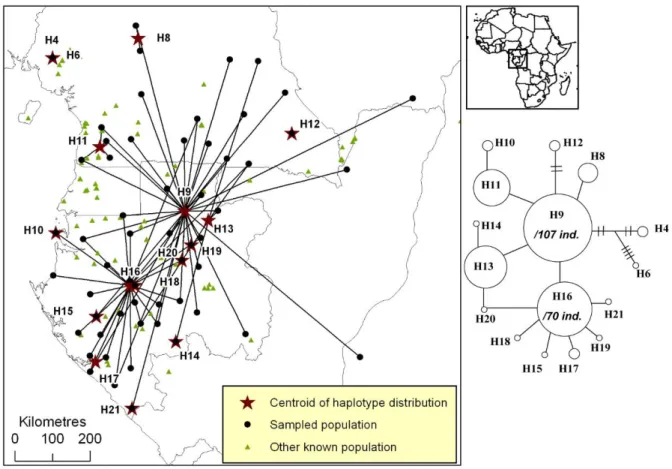
Figure S4. Distribution of plastid DNA haplotypes of Greenwayodendron suaveolens subsp. suaveolens var. suaveolens.
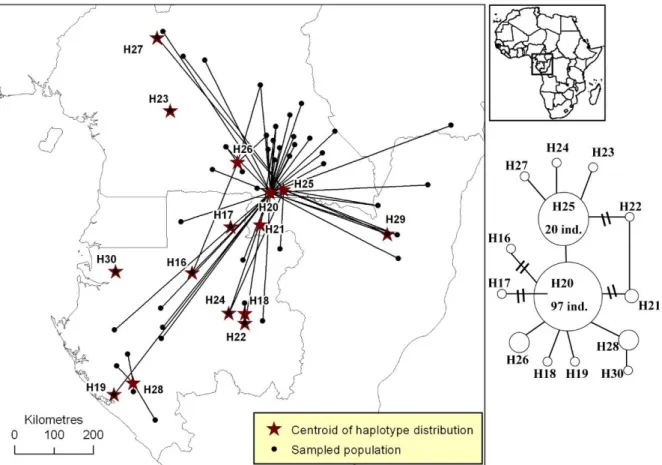
Figure S5. Distribution of plastid DNA haplotypes of Erythrophleum suaveolens.
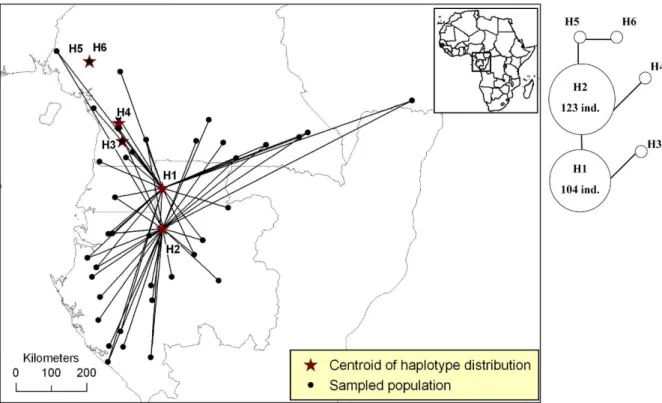
Figure S6. Distribution of plastid DNA haplotypes of Santiria trimera.
Figure S7. Distribution of plastid DNA haplotypes of Milicia excelsa.
Figure S8. Distribution of plastid DNA haplotypes of Symphonia globulifera.
Figure S9. Genetic distinctiveness of each tree species within each locality (for localities with at least 2 species sampled) in Atlantic Central Africa. Distinctiveness above or below average is based on standardized differentiation S.ij computed for each species among populations.
Each barplot represents, respectively, from left to right distinctiveness values for S. trimera, E. suaveolens, G. suaveolens, A. kamerunensis, A. lepidophyllus, S. zenkeri, S. globulifera and M. excelsa.
Table S1. List of localities, coordinates and numbers of individuals sampled for each species. Sp1: Afrostyrax kamerunensis, Sp2: Afrostyrax lepidophyllus Sp3: Erythrophleum
suaveolens, Sp4: Greenwayodendron suaveolens, Sp5: Milicia excelsa, Sp6: Santiria trimera, Sp7: Scorodophloeus zenkeri, Sp8: Symphonia globulifera.
Latitude Longitude Sp1 Sp2 Sp3 Sp4 Sp5 Sp6 Sp7 Sp8 1 -3.283 11.118 0 0 2 14 0 0 5 0 2 -2.682 10.463 1 0 4 16 0 14 5 4 3 -1.828 12.247 0 10 0 6 2 0 10 0 4 -1.417 10.427 0 7 2 6 0 0 5 0 5 -1.343 12.725 2 2 0 3 0 0 5 0 6 4.510 14.027 0 5 17 13 12 0 0 0 7 -1.126 12.060 0 1 0 6 0 0 6 0 8 -0.717 11.195 12 20 3 8 0 23 7 0 9 -0.858 12.963 0 6 7 0 13 0 13 0 10 -0.155 12.543 0 16 8 9 0 4 18 0 11 -0.091 10.760 0 3 0 1 0 0 7 0 12 0.461 12.487 0 5 5 9 2 17 16 1 13 4.161 11.438 0 0 1 1 0 0 0 0 14 0.404 11.225 1 11 3 7 0 7 15 0 15 0.454 10.190 12 5 1 24 0 10 8 3 16 2.665 10.869 0 5 0 15 13 20 6 2 17 3.389 10.339 4 3 0 5 0 16 13 10 18 1.143 13.169 0 9 1 14 2 19 14 1 19 3.977 9.267 2 1 0 0 0 0 0 1 20 -1.890 10.128 10 1 3 7 2 1 0 0 21 1.641 12.038 0 1 3 1 5 0 0 0 22 -0.919 9.957 0 0 1 1 0 3 0 0 23 4.898 9.276 0 6 0 4 3 23 0 13 24 5.146 11.786 0 0 6 7 6 0 0 0 25 3.381 14.080 0 12 26 2 25 5 0 2 26 -1.403 11.177 11 17 2 13 0 16 4 2 27 3.885 17.902 0 8 8 9 2 12 0 0 28 -2.454 16.597 0 1 0 2 0 0 0 3 29 2.810 12.904 0 8 12 19 11 24 6 4 30 -0.360 11.420 1 0 0 0 3 0 0 0 31 2.506 15.409 0 2 8 3 0 10 0 3 32 -3.655 11.161 0 4 0 8 0 0 3 0 33 0.980 11.328 0 3 0 5 1 0 3 0
34 -0.130 11.340 0 1 0 0 0 0 0 0 35 2.285 9.947 0 0 0 12 0 8 0 0 36 2.244 13.945 0 0 0 4 0 0 0 0 37 0.574 9.335 0 0 0 3 9 0 0 6 38 -1.860 13.870 0 0 0 1 0 0 0 1 39 -1.618 11.765 0 0 0 2 0 0 0 0 40 -0.261 9.732 0 0 0 2 1 8 0 0 41 -2.666 11.252 0 2 0 5 2 2 5 2 42 -2.934 10.537 0 0 0 0 0 0 1 0 43 4.558 10.472 0 0 0 0 0 4 1 0 44 1.600 10.100 0 0 0 0 0 2 1 0 45 -1.914 10.742 0 0 0 0 0 4 1 0 46 -1.119 17.914 0 0 0 0 0 0 0 1 47 -2.392 9.628 0 0 0 0 0 0 0 1 48 0.326 9.330 0 0 0 0 0 0 0 6 49 0.745 16.652 0 0 25 0 0 0 0 0 50 2.763 17.261 0 0 5 0 13 0 0 0
Table S2. Genbank accession numbers
Taxon Haplotype Marker Accession
number A.kamerunensis H3 trnC-petN1R KJ442716 A.kamerunensis H5 trnC-petN1R KJ442705 A.kamerunensis H6 trnC-petN1R KJ442730 A.kamerunensis H8 trnC-petN1R KJ442709 A.kamerunensis H10 trnC-petN1R KJ442718 A.kamerunensis H11 trnC-petN1R KJ442729 A.kamerunensis H12 trnC-petN1R KJ442720 A.kamerunensis H21 trnC-petN1R KJ442703 A.lepidophyllus H1 trnC-petN1R KJ442707 A.lepidophyllus H2 trnC-petN1R KJ442727 A.lepidophyllus H4 trnC-petN1R KJ442710 A.lepidophyllus H7 trnC-petN1R KJ442735 A.lepidophyllus H9 trnC-petN1R KJ442719 A.lepidophyllus H13 trnC-petN1R KJ442725 A.lepidophyllus H14 trnC-petN1R KJ442713 A.lepidophyllus H15 trnC-petN1R KJ442700 A.lepidophyllus H16 trnC-petN1R KJ442732 A.lepidophyllus H18 trnC-petN1R KJ442723 A.lepidophyllus H19 trnC-petN1R KJ442733 A.lepidophyllus H20 trnC-petN1R KJ442697 G.suaveolens H4 trnC-petN1R KJ442728 G.suaveolens H6 trnC-petN1R KJ442722
G.suaveolens H8 trnC-petN1R GU121914
G.suaveolens H9 trnC-petN1R GU121910
G.suaveolens H10 trnC-petN1R GU121909
G.suaveolens H11 trnC-petN1R GU121911
G.suaveolens H12 trnC-petN1R KJ442711
G.suaveolens H13 trnC-petN1R GU121917
G.suaveolens H14 trnC-petN1R KJ442699
G.suaveolens H15 trnC-petN1R GU121915
G.suaveolens H16 trnC-petN1R GU121912
G.suaveolens H17 trnC-petN1R GU121913
G.suaveolens H18 trnC-petN1R KJ442701
G.suaveolens H19 trnC-petN1R GU121916
G.suaveolens H20 trnC-petN1R GU121918
G.suaveolens H21 trnC-petN1R KJ442715 S.zenkeri H1 trnC-petN1R KJ442724 S.zenkeri H2 trnC-petN1R KJ442714 S.zenkeri H3 trnC-petN1R KJ442704 S.zenkeri H4 trnC-petN1R KJ442702 S.zenkeri H5 trnC-petN1R KJ442712 S.zenkeri H6 trnC-petN1R KJ442717 S.zenkeri H7 trnC-petN1R KJ442696 S.zenkeri H8 trnC-petN1R KJ442731 S.zenkeri H9 trnC-petN1R KJ442695 S.zenkeri H10 trnC-petN1R KJ442721
S.zenkeri H11 trnC-petN1R KJ442736 S.zenkeri H12 trnC-petN1R KJ442708 S.zenkeri H13 trnC-petN1R KJ442706 S.zenkeri H14 trnC-petN1R KJ442694 S.zenkeri H15 trnC-petN1R KJ442698 S.zenkeri H16 trnC-petN1R KJ442734 S.zenkeri H17 trnC-petN1R KJ442726 E.suaveolens H16 trnC-petN1R JX840204 E.suaveolens H17 trnC-petN1R JX840195 E.suaveolens H18 trnC-petN1R JX840205.1 E.suaveolens H19 trnC-petN1R JX840206 E.suaveolens H20 trnC-petN1R JX840209 E.suaveolens H21 trnC-petN1R JX840196 E.suaveolens H22 trnC-petN1R JX840197.1 E.suaveolens H23 trnC-petN1R JX840198 E.suaveolens H24 trnC-petN1R JX840199 E.suaveolens H25 trnC-petN1R JX840208 E.suaveolens H26 trnC-petN1R JX840194 E.suaveolens H27 trnC-petN1R JX840200 E.suaveolens H28 trnC-petN1R JX840207 E.suaveolens H30 trnC-petN1R JX840202 S.trimera H1-H2-H3-H4 rbcL FN796551 S.trimera H1 rpl26-infA-rps8 FN796568 S.trimera H2-H5 rpl26-infA-rps8 FN796569 S.trimera H3 rpl26-infA-rps8 FN796570 S.trimera H4 rpl26-infA-rps8 FN796571 S.trimera H6 rpl26-infA-rps8 FN796572 S. globulifera H2 trnC-petN1R KF487898 S. globulifera H3 trnC-petN1R KF487913 S. globulifera H4 trnC-petN1R KF487931 S. globulifera H5 trnC-petN1R KF488049 S. globulifera H6 trnC-petN1R KF487914 S. globulifera H8 trnC-petN1R KF487922 S. globulifera H9 trnC-petN1R KF487936 S. globulifera H10 trnC-petN1R KF487934 S. globulifera H11 trnC-petN1R KF487894 S. globulifera H12 trnC-petN1R KF487900 S. globulifera H13 trnC-petN1R KF487912 S. globulifera H14 trnC-petN1R KF488056 S. globulifera H15 trnC-petN1R KF488043 S. globulifera H16 trnC-petN1R KF488042 S. globulifera H17 trnC-petN1R KF487939 S. globulifera H18 trnC-petN1R KF488055 S. globulifera H19 trnC-petN1R KF487941 S. globulifera H20 trnC-petN1R KF487924 S. globulifera H21 trnC-petN1R KF487902 S. globulifera H22 trnC-petN1R KF487895 S. globulifera H23 trnC-petN1R KF487907 S. globulifera H24 trnC-petN1R KF488047 M. excelsa H1-H2 trnC-petN1R HM543892.1
M. excelsa H4-H5-H7 trnC-petN1R HM543884.1 M. excelsa H8 trnC-petN1R HM543888.1 M. excelsa H1 psbA-trnH HM543948.1 M. excelsa H2-H7 psbA-trnH HM543949.1 M. excelsa H4 psbA-trnH HM543969.1 M. excelsa H5-H8 psbA-trnH HM544018.1
Figure S1. Distribution of pDNA haplotypes of Afrostyrax kamerunensis in Atlantic Central Africa. All populations that host a given haplotype are linked to the centroid of the
haplotype’s distribution (star). The phylogenetic network is based on one pDNA region (trnC-PetN1R inter-genic spacer). A simple link between haplotypes indicates one mutation event. Links with bars indicate more than one mutation event.
Figure S2. Distribution of pDNA haplotypes of Scorodophloeus zenkeri in Atlantic Central Africa. All populations that host a given haplotype are linked to the centroid of the
haplotype’s distribution (star). The phylogenetic network is based on one pDNA region (trnC-PetN1R inter-genic spacer). A simple link between haplotypes indicates one mutation event. Links with bars indicate more than one mutation event.
Figure S3. Distribution of pDNA haplotypes of Afrostyrax lepidophyllus in Atlantic Central Africa. All populations that host a given haplotype are linked to the centroid of the
haplotype’s distribution (star). The phylogenetic network is based on one pDNA region (trnC-PetN1R inter-genic spacer). A simple link between haplotypes indicates one mutation event. Links with bars indicate more than one mutation event.
Figure S4. Distribution of pDNA haplotypes of Greenwayodendron suaveolens
subsp.suaveolens var.suaveolens in Atlantic Central Africa. All populations that host a given haplotype are linked to the centroid of the haplotype’s distribution (star). The phylogenetic network is based on one pDNA region (trnC-PetN1R inter-genic spacer). A simple link between haplotypes indicates one mutation event. Links with bars indicate more than one mutation event.
Figure S5. Distribution of pDNA haplotypes of Erythrophleum suaveolens in Atlantic Central Africa. All populations that host a given haplotype are linked to the centroid of the
haplotype’s distribution (star). The phylogenetic network is based on one pDNA region (trnC-PetN1R inter-genic spacer). A simple link between haplotypes indicates one mutation event. Links with bars indicate more than one mutation event.
Figure S6. Distribution of pDNA haplotypes of Santiria trimera in Atlantic Central Africa. All populations that host a given haplotype are linked to the centroid of the haplotype’s distribution (star). The phylogenetic network is based on two pDNA regions (rpl26-infA-rps8 and part of the rbcL gene). Link between haplotypes indicate one mutation event.
Figure S7. Distribution of pDNA haplotypes of Milicia excelsa in Atlantic Central Africa. All populations that host a given haplotype are linked to the centroid of the haplotype’s
distributio (star). The phylogenetic network is based on two pDNA regions (trnC-PetN1R and psbA-trnH inter-genic spacers). Link between haplotypes indicate one mutation event.
Figure S8. Distribution of pDNA haplotypes of Symphonia globulifera in Atlantic Central Africa. All populations that host a given haplotype are linked to the centroid of the
haplotype’s distribution (star). The phylogenetic network is based on one pDNA region (trnC-PetN1R inter-genic spacer). A simple link between haplotypes indicates one mutation event. Links with bars indicate more than one mutation event.
Figure S9. Genetic distinctiveness of each tree species within each locality (for localities with at least 2 species sampled) in Atlantic Central Africa. Distinctiveness above or below average is based on standardized differentiation S.ij computed for each species among populations.
Each barplot represents, respectively, from left to right distinctiveness values for S. trimera, E. suaveolens, G. suaveolens, A. kamerunensis, A. lepidophyllus, S. zenkeri, S. globulifera and M. excelsa.