Publisher’s version / Version de l'éditeur:
Journal of the Acoustical Society of America, 41, 6, pp. 1496-1499, 1967-11-01
READ THESE TERMS AND CONDITIONS CAREFULLY BEFORE USING THIS WEBSITE. https://nrc-publications.canada.ca/eng/copyright
Vous avez des questions? Nous pouvons vous aider. Pour communiquer directement avec un auteur, consultez la
première page de la revue dans laquelle son article a été publié afin de trouver ses coordonnées. Si vous n’arrivez pas à les repérer, communiquez avec nous à [email protected].
Questions? Contact the NRC Publications Archive team at
[email protected]. If you wish to email the authors directly, please see the first page of the publication for their contact information.
NRC Publications Archive
Archives des publications du CNRC
This publication could be one of several versions: author’s original, accepted manuscript or the publisher’s version. / La version de cette publication peut être l’une des suivantes : la version prépublication de l’auteur, la version acceptée du manuscrit ou la version de l’éditeur.
Access and use of this website and the material on it are subject to the Terms and Conditions set forth at
Angular distribution of lower room modes
Donato, R. J.
https://publications-cnrc.canada.ca/fra/droits
L’accès à ce site Web et l’utilisation de son contenu sont assujettis aux conditions présentées dans le site LISEZ CES CONDITIONS ATTENTIVEMENT AVANT D’UTILISER CE SITE WEB.
NRC Publications Record / Notice d'Archives des publications de CNRC:
https://nrc-publications.canada.ca/eng/view/object/?id=1c1623f0-e1fc-4d66-984f-3395376900a6 https://publications-cnrc.canada.ca/fra/voir/objet/?id=1c1623f0-e1fc-4d66-984f-3395376900a6
Reprinted from TIIE JOURXAL OF T I L E ACOUSTICAL SOCIETY OF ALIERIC-4, Vo1. 41, Xo. 6, 1496-1499, June 1967
Copyright, 1967 by the Acoustical Society of America. Printed in U. S. A.
Angular Distribution of Lower Room Modes*
The angular distribution of the lower-frequency modes in a rectangular room is calculated for various room clin~ensions. ilpplying the results to reverberation-room measurements, it is shown that a san~ple placed with its surface normal to a long dimension of the rooin experiences the most diffuse held. Various methods are proposed to modify the esisting techniques of absorption measurement, where it usually happens that the sample is placed with its surface normal to the shortest asis, thus csperiencing the least diffuse held.
INTRODUCTION
A
REVERBERATION room is usually designed to be as small as possible, consistent with adequate simulation of a diffuse field a t the lowest frequa~cies. Normally, i t is required that there be a certain ininiinuin number of room modes in the lowest frequency band. This, while fixing the nunlber of discrete frequencies present in a given band, saqs nothing about how these modes are distributed with angle. Thus, it could happen that a specinleil being tzsted in such an enclosure re- ceives the bulli of its energy over a slnall range of angles. The ideal is a diffuse sound field, i.e., one in which all angles of incidence on the speci~nell are equally proba- ble. At high frequencies, this situation is approached, and Bolt1 shows that the calculated distribution more or less follows a sin0 law, where 0 is the angle measured from a perpendicular to a wall.Other criteria exist for the design of an ellclosure that might possibly be incompatible with one chosen for angular distribution. The room must have negligible redundancy of modes and the modes themselves should fall uniformly over the frequency band. Bolt2 and Sepmeyer3 have considered this problem for a. rectangu- lar room and have recoinnlended that the room dimen- sions be related to one another in certain ways. Taliing these ratios, we have investigated the angular distribu- tion of modes relative to each of the room axes. We *This paper is a contribution from the Division of Building Research, i\'ational Research Council, Canada, and is published with the approval of Ihe Director of the Division.
t Present address: IYater Iiesources Branch, Department of Energy, Mines and Resources, Ottana, Ca:~atla.
1 R. H. Bolt, J. Acoust. Soc. Anl. 11, 74-79 (1940). R. H. Bolt, J. Acoust. Soc. Am. 19, 79-90 (1947). 3 L. 'Mi. Sepn~eyer, J. Acoust. Soc. A ~ I . 37, 413-423 (1965).
have perfornled the calculation for the lowest three third-octave bands. Beyond the third band, the calcr- latioils become intractable by hand, and in any case the number of nlodes then approaches that required for the collditioil of random distribution to be approxi- mately satisfied.
The reverberation-room procedure for measuring ab- sorptioil of materials has beell established by long usage. Any modifications needed to malie the sound field in a test room more diffuse should therefore not involve radical departure from well-tried practice. For instance, i t is shown that a better distributioil of angle would bc obtained bq- mounting the test specimell perpendicular to a long diinension rather than on the floor (this assumes, as is generally the case, that the shortest room dimension is the height). T o mount a spcciinen against the vertical wall with the necessary nlinimuin distances from edges and corners might, in practice, be more difficult than simply placing the specinlei1 in the floor. Thus, alternative methods are discussed in which the distribution of sound in the room may be altered so that the present positioning can be retained.
I. NUMBER AND ANGLE O F M O D E S
T h e number of modes in a rectangular room falling within a frequency band Af is given by the formula
where c is the velocity of sound in air, f is the center frequency of the band, V is the volume of the room, A is the total wall area, and L=il(L,+L,+L,); L,, L,, L z being the room dinlensions. Equation 1 may be rc-
A N G U L A R D I S T R I B U T I O N O F L O W E R R O O M M O D E S written as
For a given volume, the sinallest number of modes occurs when A/V$ and L/Vi have minimum values. If
L,=pL,, L,= qL,, then the minirna occur when
p=
q= 1 ; thus, the worst shape is a perfect cube. If we require, after Sepmeyer, that there be a minimum of nine modes in the lowest third-octave band, thenThis differs slightly from the value 2.46X lo9 quoted by Sepmeyer. His value is presumed to be the more accurate one because of the approxinlate nature of Eq. 1 in expressing a discrete by acontinuous function; hence i t is used in our subsequent calculations.
The conditions for the existence of a mode is
when I, nt, n are integers (including zero). For conveni- ence, we define a dinlensionless parameter p given by
Then, if 8; is an angle of incidence measured from axis (i=x, y, or z), we have cosO,=pi/p, where the value p;
is obtained from Eq. 3 by putting the integers for axes different from
i
equal to zero. Thus11. CALCULATIONS AND FCESULTS
When applying the rule for nlinimum V we have chosen f = 5 0 H z as the center frequency of the lowest third-octave band, b u t the results are easily adapted to any other limiting frequency merely by scaling down the room dimensions; for example, if the lowest band is to be centered on 125 Hz, the room dimensions would be divided by 125/50. T h e analysis proceeds for two Sepmeyer roo111 ratios and the Bolt ratio for the first three one-third-octave bands. U7e merely fit maxiinunl and ininimum values for p corresponding to the limits
of the frequency band and find the sets of values of I, m, .rz that satisfy Eq. 3. Finally, Eq. 4 is used to calcu- late values for the angles.
Table I shows the miilimuin room dimensions, as- TABLE I . ~ i m e ~ ! s i o n s (in feet) for a room satisfying minimum contlit ions.
Dimension Recommenclecl room proportions (Sepmeyer I) (Bolt) (Sepmeyer 11)
1:0.82:0.72 1:0.79:0.63 1:0.69:0.43
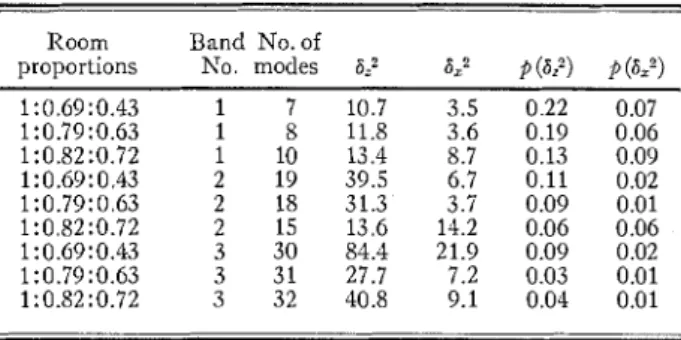
TABLE 11. Deviations and proportional deviations for three room-dimension ratios.
Room Band No. of
proportions No. modes 6,? as2 ~ ( 6 , ~ ) p(aZ2)
suming nine modes to exist a t the lowest oct centered on 50 Hz. I t can be noted that by actual count the number of modes in this band ranges from 7 to 10 for the rooms considered, even though the voluines are the same.
Table I1 contains a measure of how the actual angu- lar distribution departs from the ideal one of diV/dB= K sine. T h e parameter shown is defined by
where the angular range 0'-90' is split into 10' zones. The parameter 6? represents a true deviation, but may only be used for cornparisoil between bands when the number of modes is constant. T h e suffixes are used to denote the directions of the perpendicular. As a n alter- native, we can express deviations by ~(6"=6~/1\*~, where iV is the number of modes being considered. This is a more satisfactory form of presentation because i t involves proportionalities, and this now perinits us to compare the deviations in different bands. This fraction may also be defined by
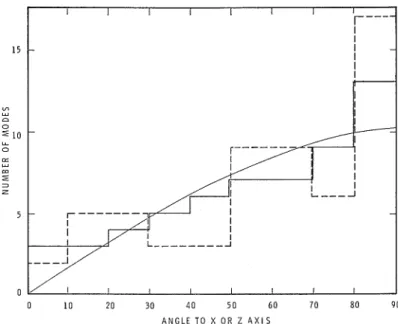
The calculated values are given in the last two columns of Tables 11. Both these parameters differ from the one used by Sepmeyer3 in which the ratio of M,,I, to lVideal is formed for each zone, squared, and then averaged. This parameter tends to overemphasize the contributions made by smaller zones, corresponding to small angles of incidence. From Table 11, we see t h a t 6"s usually smaller for a sample placed norinal t o the loilgest axis of the room (the x axis) ; in this position the sample expe- riences a more diffuse field than if i t were perpendicular t o the z axis. T h e evidence froin ~ ( 6 ~ ) values confirins t h a t of the values. Values for conditions norinal to the intermediate y axis fall between those shown in the Tables, but are not given. T h e Table also indicates that the Bolt ratio of 1:0.79:0.63 is probably the best one to use. I n Fig. 1, which summarizes the distributions for the first three third-octave bauds lumped together,
FIG. 1. Angular distribution of modes relative to x and z axes in first three frequency bands. -:
distribution perpendicular to x axis; - - -: distribu- bution perpendicular to z axis.
A N G L E T O X O R Z A X I S
the advantage of using the test sainple perpendicular to the longest axis is apparent
111. MODIFICATIONS T O EXISTING PROCEDURES
If, as is usual, the shortest dimension of the room is the vertical, the conclusions of the previous analysis suggest that absorption test specinleils should be inounted on an end wall. This is not always convenient, and we consider hlteruative nleasures that would iin- prove the distribution-especially when specimens are placed on the floor, perpendicular to the short dimen- sion. The most obvious method is to average the curve in some way so that energies in some angular ranges are diverted illto others. This is not as easy as i t may seem, for i t is never possible to inanipulate one range without n~odifyillg all the others.
0
0 10 2 0 30 4 0 5 0 6 0 70 8 0 9 0 A N G L E T O Z A X I S
One way to present a more uniformly diffuse field to a specimen would be to fragment the original specimen and arrange the new elements a t different angles with respect to the sound field. One procedure, fornlerly used, is to split the total specimen into three widely separated areas mounted on three mutually perpendicuiar sur- faces. This arrangement has the disadvantage that, for a given total area of material, the effect of edge dif- fraction is increased as coinpared to a single large speci- men. Diffraction effects could be reduced by increasing the size of the individual areas, b u t increasing the total absorbing area results in a still greater departure from diffuse field conditions.
I n this analysis, we evade the diffraction problem by considering essentially one absorbing area, and investi- ga.te the effect of tilting one portion slightly with respect
FIG. 2. Angular distribution of modes in first three frequency bands for slightly tilted absorbers. -:
two absorbers A (0°)+0.7A (10") ; - - -: three ab- sorbers A (0") +0.6A (10") +0.2A (20").
A N G U L A R D I S T R I B U T I O N O F L O W E R ROOiVI M O D E S to the remainder. Assunliilg an initial position in the
plane of the floor, we first tilt one section by 10'. Energy hitting the original area in the interval 10'-20' will then strike the tilted section in the range 0'-30'
(the range for a given contribution, depending on orien- tation relative to the direction of tilt). By varying the ratio of the two areas we call find, by statistical analysis, the ratio that gives the best approximation to the ideal distribution. This has been done for the room proportioil 1.0:0.79: 0.63. We consider the first three third-octaves, and for conveilience in calculation use as a criterion 602 calculated for the whole octave band.
T h e optimunl ratio of tilted to untilted portions is found to be 0.7, and this reduces 602 from 95 to 20. For the individual third-octave bands 62 becomes 3.1, 2.5, and 5.2, respectively, as compared with 11.8, 31.3, and 27.7 for the untilted case. Table I1 shows that these compare favorably also with the values of 62, corre- sponding to the end wall position for the specimen.
Obviously, the saine procedure might be extended further. By adding a third segment, tilted a t 20°, 6,,Z inay be reduced to 16. The optiinum ratio of areas is then found to be 1.0:0.6:0.2 for sections tilted a t angles of 0°, 10' and 20°, respectively. For the first three third- octaves, 62 now becoines 2.9, 1.2, and 4.8. Clearly, the first tilting operation is the most important, and further elaboration beyond the second is unwarranted.
IV. D I S C U S S I O N
T h e calculations of Sec. I11 were based on the modal distribution for a bare rectangular room. I t is of interest to consider, qualitatively a t least, the behavior of actual roonls and the effects of various special techniques that have been devised for reverberation rooms.
We can expect that the actual shape of a room, flat- ness of its surfaces, etc., will depart from the nominal condition, even when great care is taken in construction. As a result, illodes beyond the first few will probably not coilforin precisely to the predicted distribution, either in angle or in frequency. I n the lowest bands, the altera- tioils to the angular distribution may be small enough merely to shift individual modes slightly, and the theo- rectical ailalysis might apply reasonably well.
I n absorption measurements, another distorting effect is introduced by the presence of the absorptive specimen itself, which will alter the relative importance of modes, depending on their degree of involvemeilt with the specimens. A similar effect would result from the presence of absorptive patches introduced as part of the "en~pty" room, as has soinetimes been done. This, in effect, could be another nlethod of altering and perhaps iinproviilg the angular distribution. I t would have the uildesirable effect, however, of increasing the total room absorption.
A procedure in current vogue is to use a series of re- flecting panels, tilted with respect t o each other and t o the room boundaries. T h e effect of such a n arrangement will be similar to that of tilting portions of the specimen : part of the energy incident on a boundary from a given direction will be diverted to a different direction and, thus, the angular distribution a t the specimen will be altered. A few panels strategically located and oriented might suffice. Altenlatively, a large number of ran- donlly arranged panels may be expected to provide a n approach to the desired uniform distribution. The ro- tating vane frecluently used is a special case of a dif- fusing panel, which over a period of time is equivalent
to a series of different tilting arrangements.