XIX. COMMUNICATIONS BIOPHYSICS* Prof. M. Eden Prof. J. L. Hall II Prof. W. T. Peaket Prof. R. R. Pfeiffert Prof. W. A. Rosenblith Prof. W. M. Siebert Prof. T. F. Weissi Dr. J. S. Barlow$ Dr. A. W. B. Cunningham Dr. E. Giberman** Dr. R. D. Hall Dr. N. Y-s. Kiangt Dr. G. P. Moore Dr. R. Rojas Dr. R. H. Wendt
R. S. Bair
G. J. Burnett
A. W. Clay
E. G. Duffin
J. A. Anderson R. M. Brown S. K. Burns R. R. Capranica R. J. Clayton H. S. Colburn A. H. Crist N. I. Durlach J. L. Elliot P. R. Gray J. J. Guinan, Jr. F. N. Jordan Patricia Kirkpatrick K. C. Koerbert D. Langbein S. Frischmuth L. Laurence L. Luconi P. McGaughy, Jr. P. L. Marcus R. G. Mark P. Mermelstein M. J. Murray M. Nahvi Ann M. O'Rourke Cynthia M. Pyle J. A. Rupf, Jr. M. B. Sachs J. J. Singer N. D. Strahm I. H. Thomae J. R. Welch M. L. Wiederhold G. E. Wien D. J. Mided J. T. Moter M. J. Murray A. A. WeinsteinA. MOTION OF MIDDLE-EAR BONES
Using stroboscopic illumination, we observed the motion of the ossicles through a microscope in anesthetized cats. With periodic acoustic stimuli amplitude measure-ments could be made with an accuracy of approximately 1/10 micron. The displacement amplitude was linearly related to sound pressure at the tympanic membrane up to rms pressures of at least 130 db re 0. 0002 microbar (Fig. XIX-1). In the linear range the predominant movement of the stapes was pistonlike. At higher sound pressures the stapes motion became more complex. At these high stimulus levels components of the motion were observed which were similar to the two kinds of "rocking" that have been observed in middle ears of cadavers by von B6k6sy.1 These components were small compared with the pistonlike movement for sound pressures in the linear range.
*This work was supported in part by the National Science Foundation (Grant GP-2495); in part by the National Institutes of Health (Grant MH-04737-04); and in part by the National Aeronautics and Space Administration (Grant NsG-496).
TAlso at Massachusetts Eye and Ear Infirmary, Boston, Massachusetts.
Research Associate in Communication Sciences from the Neurophysiological Lab-oratory of the Neurology Service of the Massachusetts General Hospital, Boston, Massachusetts.
(XIX. COMMUNICATIONS BIOPHYSICS)
AMPLITUDES NORMALIZED TO A STIMULL
i I I i
db PER DECADE LINE
100 110 120 130 140
SOUND PRESSURE LEVEL db re 0.0002 DYNES CM
2
Fig. XIX-1.
Peak-to-peak amplitude of a point on the body of the stapes versus sound-pressure level. Tone stimulus, 315 cps. Units on the vertical scale corre-spond to 0. 72 in the focal plane of the microscope, or to a calculated stapes move-ment of 1.0
p.
.02 0.0 I 0.2 0.5 1.0
STIMULUS FREQUENCY (KC
Fig. XIX-2.
Peak-to-peak amplitude and phase delay of the stapes movement. One unit on the amplitude scale corresponds to a measurement of 0. 42 p. in the focal plane of the microscope or to a calculated stapes movement of 0. 57 p., or to a
-7
volume displacement of 7 X 10 cc based on 2
an average footplate area 1. 26 mm
The amplitude and phase of the stapes displacement were measured as a function of
frequency for pure-tone stimuli. Results from one cat are shown in Fig. XIX-2. These
data are typical, except that the dips in the amplitude at 3 kc and 8 kc were not found in
all cats. Measurements of electric responses near the round window of the cochlea
indicate that the transmission of the middle ear is altered by the opening of the bulla
and bony septum which is necessary in order to see the stapes. This surgical procedure
changes the acoustic impedance of the middle-ear cavities with particularly striking
EVEL OF 120 d STIMULUS FREQUENCY ( K I I I I I I I I I i i I J I I I I I BEGINNING o BEGINNING co
AVEAGE MAXIMUM READIN(
MINIMUM READINC )2 MICROBAR
0.2 o i 4Y o 2 i e I I , .0 5.0
(XIX. COMMUNICATIONS BIOPHYSICS)
effect in the 4-kc region, so that these data cannot be considered to give an accurate description of the intact middle ear.
The techniques and results of this work are described in detail in a Master's thesis.2 J. J. Guinan, Jr., W. T. Peake
References
1. G. von B6k6sy, Experiments in Hearing (McGraw-Hill Book Company, Inc., New York, 1960), p. 113.
2. J. J. Guinan, Jr., Transfer Characteristic of the Cat's Middle Ear, S. M. Thesis, Department of Electrical Engineering, M. I. T., 1964.
B. RHYTHMIC FOREBRAIN POTENTIAL CORRELATED WITH CESSATION OF MOVEMENT IN THE RAT
A large rhythmic potential has been observed in sensory-motor cortex in the rat during periods of behavioral "freezing." This activity was studied1 in animals with elec-trodes chronically implanted in caudate nucleus and hippocampus, as well as in
neocor-tex. Subjects were trained to bar press in a conditioned emotional response situation, which included a special restraining apparatus. The emotional response was established by pairing an auditory conditioned stimulus with a shock unconditioned stimulus. The potential appeared only in the absence of the bar pressing, but the absence of bar pressing did not insure the occurrence of the potential. Visual monitoring showed that the potential is more highly correlated with periods of no movement than simply with the cessation of bar pressing. The large rhythmic potential was 9-10 cps and often reached amplitudes greater than 1 my peak to peak. The potential has been observed for periods as long as 1 min, but it often occurred in short bursts wherein it took on a spindling appearance. Complete control of the potential has not yet been achieved, but the work thus far has revealed at least some of the sources of variability.
R. J. Clayton
References
1. This report gives a summary of an S. M. Thesis submitted to the Department of Electrical Engineering, M. I. T., May 29, 1964.
C. COMPARISON OF AUDITORY NERVE DATA FOR BULLFROG AND GREEN FROG Single-unit activity in the eighth nerve of the green frog (Rana clamitans) has been studied1 and the results compared with those of Frishkopf and Goldstein2 for the bull-frog. Typical thresholds for single-unit responses to tone bursts are the same for both
(XIX. COMMUNICATIONS BIOPHYSICS)
species; the most sensitive units respond to intensities as low as -50 db re 1
Rbar.
No
unit in either species would respond to frequencies above 3000 cps. In both species the
majority of units falls into two categories: the simple or high-frequency units are a
relatively homogeneous group and show only excitatory characteristics; the complex or
low-frequency group contains units that respond to acoustic and/or vibratory stimuli and
their tone burst response can be inhibited by sound in a given spectral range.
As in the bullfrog, most of the complex units in the green frog have best frequencies
in the 200-400 cps range (Fig. XIX-3). The distribution of the best frequencies of simple
35 - 0 LOW-FREQUENCY GROUP
30
-
E HIGH-FREQUENCY GROUPvibraticn
132 198 296 444 667 1000
BEST FREQUENCY OF UNIT (CPS)
1500 2250
Fig. XIX-3.
Histogram showing the number of units with best frequencies in the
indicated intervals.
Data obtained from 11 green frogs.
units is, however, quite different for the two species. For the bullfrog, Frishkopf and
Goldstein found that the best frequencies for the simple units lie between 1000 cps and
2250 cps, with many units characterized by best frequencies above 1500 cps. In fact,
they define 1000 cps to be the lower bound of their high-frequency group. Best
frequen-cies for the high-frequency group in the green frog extend down to 650 cps, and most of
the units in this group have best frequencies between 700 cps and 1000 cps.
Another difference in the data obtained for the green frog and for the bullfrog is the
range of best frequencies for inhibition of the complex units.
Frishkopf and Goldstein
state that tuning curves for inhibition often show a minimum at 500 cps, with most
sen-sitive range for the inhibitory stimulus between 500 cps and 600 cps. They stated that
it may be significant that they found very few units with best excitatory frequencies in
(XIX.
COMMUNICATIONS BIOPHYSICS)
this range.
In contrast, the best inhibition frequency for complex units in the green frog
is most often 700 cps and always lies between 650 cps and 1200 cps, the range in which
most of the simple units of the green frog are most sensitive.
Approximately 10 units were found in the green frog which had very different
response characteristics from those described by Frishkopf and Goldstein.
These units
did not form a homogeneous group. Some of them responded with bursts of impulses
only at the turning on of a tone, at the turning off of a tone or at both the on and the off.
Other units responded to tone bursts with a decrease in spontaneous activity, i. e., they
were inhibited.
Finally, three units were found which responded to low-frequency tone
bursts with an increase in firing rate, and to high-frequency tone bursts with inhibition
of spontaneous activity.
M. B. Sachs
References
1.
M. B. Sachs, Characteristics of Primary Auditory Neurons in the Green Frog,
S. M. Thesis, Department of Electrical Engineering, Massachusetts Institute of
Tech-nology, March 1964.
2.
L. S. Frishkopf and M. H. Goldstein, Jr., Responses to acoustic stimuli from
single units in the eighth nerve of the bullfrog, J. Acoust. Soc. Am. 35, 1219-1228 (1963).
D.
RECENT STUDIES OF THE AUDITORY AND VOCAL BEHAVIOR
OF THE BULLFROG
A previous report1 described an "evoked-calling" technique for a behavioral study of
the vocal and auditory performance of the bullfrog. This report
2describes the methods
used to analyze and synthesize recorded bullfrog croaks,3 and includes a brief
descrip-tion of some results of evoked-calling experiments in which synthetic croaks were used.
1. Gross Properties of the Bullfrog's Mating Croak
A typical bullfrog mating croak lasts approximately 0. 8 second.
There may be
3-15 croaks in a single mating call, with approximately 0. 8-second silences separating
the individual croaks. The temporal envelope of a single croak generally shows rise and
fall times of ~150 msec. Each croak is a quasi-periodic sound, having a fundamental
frequency of ~100 cps. The harmonic structure is fairly simple, usually showing energy
concentrations in two frequency bands (formants), one centered around 250 cps, the other
lying in the vicinity of 1000-1500 cps.
2.
Development of a Model Croak
For the detailed analysis presented here, we chose a series of 5 croaks, all of which
were emitted by a single animal.
This particular call was chosen because it reliably
1500 1250 1000 750 500 250 I I I I I I I 0 250 500 750 1000 1250 1500 40 2 30-20 5
10
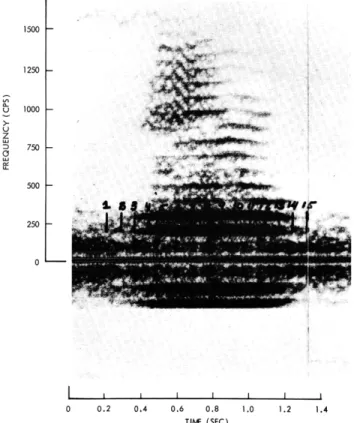
0 250 500 750 1000 1250 1500 I I I I I I I I 0 0.2 0,4 0.6 0.8 1.0 TIME (SEC)Fig. XIX-4.
Sonogram of a bull
1.2 1.4
lfrog croak.
0 10 i "/ 0 I I I L - I 0 250 500 750 1000 1250 1500Fig. XIX-5. Sections of a bullfrog croak. 35 30 25- 20-15 10 5 O) FUNDAMENTAL FREQUENCY= 95 cps I I I I I I I 0 I 2 3 4 5 6 7 8 9 10 11 12 13 HARMONIC NUMBER---,
Fig. XIX-6. Average spectrum of a bullfrog croak.
AMPLITUDE (db)
FREQUENCY (CPS)
(XIX. COMMUNICATIONS BIOPHYSICS)
20 M SEC/DIVISION
Fig. XIX-7. Representative waveform of a bullfrog croak.
evoked calling from our laboratory animals.
An example of a sonogram4 of a single frog croak is given in Fig. XIX-4. Here spec-tral amplitude is represented by the intensity of the markings. Figure XIX-5 shows sev-eral sections through the sonogram at the times shown by the numbers in Fig. XIX-4. By taking a large number of sections and averaging the amplitude of each harmonic over all sections, an "average spectrum" is obtained as shown in Fig. XIX-6. Clearly, the low-frequency formant dominates.
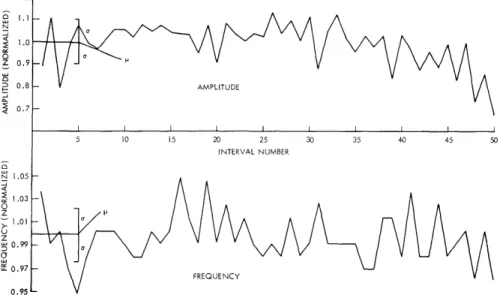
Figure XIX-7 shows the semiperiodic pulselike structure of a sample croak wave-form. The fundamental frequency (defined as the reciprocal of the interval between suc-cessive peaks) and the peak amplitude vary irregularly throughout the course of the croak. To study possible patterns in the frequency and amplitude variations, the croak waveform was recorded on chart paper with a pen recorder. The variations over a
1.2-1.0 Z 0.9 -S 0.8 - AMPLITUDE 0.7 -5 10 15 20 25 30 35 40 45 50 INTERVAL NUMBER N1.05S1.03 -1.01 Z 0.99 -0.97 FREQUENCY 0. 95
-Fig. XIX-8. Variations of fundamental frequency and amplitude over a single croak.
(XIX. COMMUNICATIONS BIOPHYSICS)
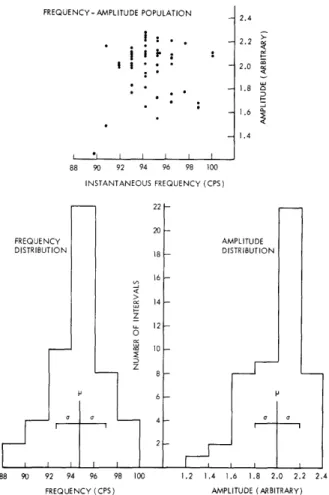
FREQUENCY- AMPLITUDE POPULATION
i :
I .I I 88 90 92 94 INSTANTANEOUS FREQUENCY DISTRIBUTION~ffiffi
88 90 92 94 96 98 FREQUENCY (CPS) I I I I 96 98 FREQUENCY 22 20 18 16 -2.4 2.2 2.0 1.8 0 1.4 AMPLITUDE DISTRIBUTION 1.2 1.4 1.6 1.8 2.0 2.2 2.4 AMPLITUDE (ARBITRARY)Fig. XIX-9.
Some statistics of croak variations.
single croak of fundamental frequency and amplitude as determined from such a record are plotted in Fig. XIX-8. We were unable to find in these plots either a pattern or cor-relation between the amplitude and frequency. Some distributions of these parameters are shown in Fig. XIX-9. In the model croak the irregularities in frequency and ampli-tude were represented as uncorrelated Gaussian processes, with means and standard deviations given by the average of those for all 5 croaks.
3. Synthesis Approximations to the Model Croak
Several preliminary behavioral experiments influenced our attempts to synthesize croaks. We had some reason to believe that the structure and location of the low-frequency formant (first formant) was critical in evoking calling from our laboratory
1,5
animals.5 We decided, therefore, to synthesize a close approximation to the first formant and to permit the amplitudes of higher frequency components to fall off mono-tonically, being careful to insure that the components in the range 1000-1500 cps were
down at least 30 db from those of the first-formant harmonics.
(XIX.
COMMUNICATIONS BIOPHYSICS)
750 - 500-250-Fig.
not m
made
Figs.
refer
In
our first attempts to synthesize
bullfrog croaks we used
POVO
6(POle
Analog of the Vocal
Organs),
a speech
analog device kindly made available by
the Speech Communication Group of the
Research Laboratory of Electronics. In
essence, POVO consists of cascaded
tuned circuits (resonators), whose
natu-ral frequencies may be chosen to
corre-spond to the center frequencies of the
formants to be synthesized. These tuned
i
circuits are excited by pulse trains of
I
i I I II
I
the desired
fundamental frequency. A
0 0.2 0.4 0.6 0.8 1.0 1.2 1.4
TIME (SEC)
single resonator of appropriate
band-width and center frequency excited by a
- 30
100-pps pulse train reproduces fairly
- 20
accurately the first-formant spectrum
-0 .
(first through sixth harmonics) of the
a
0model
croak. Using this arrangement,
I
1
I
we generated two sounds. The amplitude
500 250 0
FREQUENCY(CPS)
and repetition rate of the first sound
were modulated with white noise to
imi-XIX-10.
Sonogram and section from
synthesized croak Pl.
tate the irregularities described above.
The excitation of the second sound was
iodulated in any way.
The gross temporal characteristics of both sounds were
similar to those of a bullfrog croak.
The spectra of these sounds appear in
XIX-10 and XIX-11, where "P1" refers to the modulated sounds, and
"P2"
s to the other.
The sections in these figures were taken from the middles
of the sounds.
P1 sounds (to humans) much like a real bullfrog croak;
P2,
unsurprisingly, sounds
quite mechanical, and not very "froggy" at all. The laboratory animals called to both
of them, however, at a calling level comparable to that obtained when the natural
croaks were presented. Thus, imitating the irregularities of the natural bullfrog croak
is not necessary to evoke calling. This makes it possible to synthesize sounds in a
much more convenient way simply by superposing a few sinusoids corresponding in
fre-quency to the harmonic components of the first formant of the model croak. To do this,
we used a device constructed for lecture-demonstration purposes in the Department of
Electrical Engineering, M. I. T., which provides 10 sinusoids at each of the first 10
har-monics of a fixed fundamental frequency, which in all cases was chosen to be effectively
(XIX.
COMMUNICATIONS BIOPHYSICS)
750
soo 250 I I I I I I I 0 0.2 0.4 0.6 0.8 1.0 1.2 1.4 TIME (SEC) - 30 o10 0 I I 500 250 0 FREQUENCY (CPS)Fig. XIX- 11.
Sonogram and section from
croak P2.
synthesized
100 cps. The relative phases and amplitudes of these sinusoids can be adjusted
inde-pendently.
This Fourier Synthesizer was used to generate two groups of sounds. The first group
consisted of three sounds, each reproducing the amplitude relations of the first 5
har-monics of the model croak, but each having different phase relations among its
harmon-ics. The second group consisted of a number of sounds, each of which contained at most
3 harmonics, corresponding in frequency to the first-formant harmonics, but in each of
these cases the harmonic amplitudes were significantly different from those of the model
croak. Care was taken in all cases to insure that the amplitudes of the harmonics
out-side the first-formant range were down at least 50 db from those of the first-formant
components.
Figure XIX-12 gives a compendium of representative waveforms. Shown here are
one of the 5 model croaks, P1 and P2, and a Fourier-Synthesizer reproduction of the
model spectrum.
(XIX. COMMUNICATIONS BIOPHYSICS)
4. Evoked Calling to Synthesized Croaks
Calling from our laboratory bullfrogs was evoked by both POVO-generated sounds, P1 and P2. Fourier-synthesized croaks, in which only the low-frequency formant was present, evoked no calling. A representative spectrum of such a croak is shown in Fig. XIX-13. All harmonic components above 500 cps are down at least 55 db.
ACTUAL CROAK P 10 MSEC/DIVISION FOURIER-SYNTHESIZED CROAK
Fig. XIX-12.
O--5 -10 co S-15 LJ S-20 _ -25 0_ -30 S-35 -40I-45
Fig. XIX-13.
Summary of representative waveforms.
SYNTHESIZED BULLFROG MATING CROAK NO. IA
EVOKED CALLING LEVEL: 0% (64 DB SPL)
FUNDAMENTAL: 100 CPS
400 600 800 1000 1200 1400 1600 FREQUENCY (CPS)
1800
Harmonic amplitudes of a synthesized
low-frequency formant croak.
(XIX. COMMUNICATIONS BIOPHYSICS)
SYNTHESIZED BULLFROG MATING CROAK NO. I
O- EVOKED CALLING LEVEL: 100% (64 DB SPL) S-5-O FUNDAMENTAL: 100 CPS w -10 -J -20 -25 o -30 < -35 -40 -45 O 200 400 600 800 1000 1200 1400 1600 1800 FREQUENCY (CPS)
Fig. XIX-14. Harmonic amplitudes of a synthesized two-formant croak.
To initiate calling, energy corresponding to a high-frequency formant must be added. The synthesized croak whose spectrum is shown in Fig. XIX-14 has evoked calling com-parable to that of natural croaks. For this croak, the peak of the second formant was arbitrarily placed at 1400 cps and its amplitude, relative to that of the first formant, at -10 db. Presentation of just the high-frequency formant by highpass filtering has not evoked calling.
Calling on the part of our animals to the POVO-generated croaks P1 and P2, as well as to natural croaks, is contingent on the presence of energy in the range 1000-1500 cps. Calling to these sounds ceases if they are sharply lowpass-filtered at 500 cps. From these studies we have concluded that to initiate calling by our laboratory bullfrogs we must simultaneously present energy in the ranges 100-400 and 1000-1500 cps.
M. J. Murray, R. R. Capranica
References
1. R. R. Capranica, M. Sachs, and M. J. Murray, Auditory discrimination in the bullfrog, Quarterly Progress Report No. 71, Research Laboratory of Electronics,
M.I.T., October 15, 1963, pp. 245-265.
2. Further details will be found in M. J. Murray, Analysis and Synthesis of the Mating-Croak of the Bullfrog, S. B. Thesis, Department of Electrical Engineering, M. I.T., 1964.
3. A tape recording for analysis was kindly provided by Mr. C. M. Bogert, Curator of the Museum of Natural History, New York, N. Y.
4. G. Fant, Modern instruments and methods for acoustic studies of speech, Acta Polytech. Scand., Nucleonics, Series No. 1, Swedish Contributor No. 2, 1958.
5. R. R. Capranica, Auditory discrimination in the bullfrog, Proposal for Ph. D. Thesis, Department of Electrical Engineering, M. I. T., 1963.
6. K. N. Stevens, R. P. Bastide, and C. P. Smith, Electrical synthesizer of con-tinuous speech, J. Acoust. Soc. Am. 27, 207(A) (1955).
(XIX. COMMUNICATIONS BIOPHYSICS)
E. PSYCHOACOUSTICS OF BINAURAL UNMASKING AND ECHOLOCATION SYSTEMS OF BATS
Most of the results presented in this report were obtained by students in connection with thesis work. Specifically, the results described in section 1 were obtained by H. S. Colburn, those in section 2 by L. R. Rabiner and C. L. Laurence, those in sec-tion 3 by G. E. Wien, and those in secsec-tion 5 by A. W. W. Clay, Jr.
1. EXPERIMENT ON TIME-INTENSITY RELATIONS IN BINAURAL UNMASKING Variations in the binaural-masked threshold have been explored as a function of simultaneous shifts in interaural time delay and interaural amplitude ratio in the target signal. The purposes of this study were: (a) to fill an important gap in the data on bin-aural unmasking; (b) to test certain predictions of the equalization-and-cancellation (EC) modell; (c) to relate the topic of binaural unmasking to the topic of time-intensity trading.2 The target signal consisted of a 500-cps tone and the masking signal of broad-band Gaussian noise. The noise was presented at 90 db SPL and was identical in both ears. The combinations of interaural time delay
Ts
and interaural amplitude ratio as for the tone consisted of all pairs from the sets -rs = 0. 00, 0. 25, 0. 50, 0. 75, 1. 00 msec and a = 0, ±6, ±12, ±20, ±oo db. The results (averaged over various subjects and var-ious methods for obtaining the thresholds) for the values T = 0. 25 msec and T =0. 75 msec are shown in Fig. XIX-15.
In general, the data from this experiment were found to be consistent with the EC model. In particular, the apparently absurd prediction that the thresholds for the cases
3
(T s as) and (Ts, 1/a
)
are equal was substantiated within experimental error. Thecom-parison of these data with data on time-intensity trading will be made by using the pres-ent data to determine contours of constant threshold in the (Ts, as) plane and then
comparing these contours with the conventional published time-intensity contours. Inas-much as the new contours are based on a detection criterion and the conventional con-tours are based on a lateralization criterion, this comparison should be useful in
specifying in what manner the binaural unmasking phenomenon is related to the separa-tion of the noise and tone images within the head. For a detailed discussion of the work completed thus far, the reader is referred to the thesis of H. S. Colburn.4
2. EXPERIMENTS ON BINAURAL UNMASKING AS A FUNCTION OF INTERAURAL TIME DELAYS OR INTERAURAL PHASE SHIFTS IN THE MASKING NOISE
The binaural-masked threshold has been explored as a function of the interaural time delay or phase shift in the masking noise for a variety of tone frequencies. The purpose of these experiments was to extend the previous data of Jeffress, Blodgett, and Deatherage at 167 cps and 500 cps.5' 6 Such an extension was deemed to be important
Ts 2fTr 500 CPS 0.75 MSEC 3r /4 S 14dB S 12dB 10 dB ....- U--... RIGHT OFF f 500 CPS r = 0.25 MSEC 2Fr s= 4 14dB A -\ 10 dg B -20 -12 -6 0 6 12 20 O RIGHT OFF 20 LOG a
Fig. XIX-15. Variations in binaural-masked threshold as a function of interaural time delay Ts and interaural amplitude ratio as of the signal tone. The threshold for the case (as=1,
T=s=0)
is represented by 0 db. When as * 1,the threshold is defined by the signal level in the louder ear. The condi-tion Ts > 0 corresponds to the signal in the right ear leading the signal in the left ear. The condition as > 1 corresponds to the signal in the left ear being louder than the signal in the right ear. Data points are indicated by crosses. Dashed curves are theoretical curves derived from the EC model by choosing specific values (indicated on the curves) for the difference between the thresholds for the cases (as=l, T =0) and (as=l, Ts=1/2f). In this experiment, this value was actually 11. 5 db.
-14 F--
---
2- ---10 --0 1 - 00 LEFT OFFI
/ I \\ ---- 17--'(XIX. COMMUNICATIONS BIOPHYSICS)
because of the failure of the EC model to explain certain aspects of the previous data and because the previous data were relatively meager. One point of particular interest was the inability of the model to provide an adequate explanation of the fact that at 167 cps (where the noise delay Tn was varied over the interval 0 -
7n
< 3. O0 msec) the threshold was found to be independent of Tn in the region 0. 6 < Tn<
3. O0 msec. It was conjectured that the breakpoint Tn = 0. 6 msec at which the threshold curve changed its behavior was related to the time width of the head and the fact that presenting a stimulus in which Tn was greater than this width made extraordinary demands on the auditory system. Noconjecture was offered, however, as to why the threshold curve should remain flat after this breakpoint.
In the present time-delay experiment, binaural-masked thresholds were measured as a function of Tn for Tn in the region 0 < Tn < 10 msec and for tone frequencies of 167, 297, 500, 694, and 1040 cps. In the phase-shift experiment, binaural-masked thresholds were measured as a function of the interaural phase shift in the noise for phase shifts in the region 0-180' and for tone frequencies of 200 and 400 cps. In both experiments, the
noise was broadband Gaussian noise with an over-all power level of approximately
f 94 CPS 90 db SPL, and the interaural amplitude
ratios for the tone and noise were
main
-- o o tained at unity. (In general, phase-shifted
o 0 0 0
-4- 0
noise
and time-shifted noise cannot be-2 o 0 o 0 equated; however,
if
one assumesrea-osonable values for the width of the
crit-ical band, for the present discussion these
0.72 1.44 2.16 2.88 3.60 4.32 two experiments can be grouped together.)
T (MSEC)
(a) The average results of the time-delay
experiment for the frequencies f = 694 cps
f-6 297 CPS and f = 297 cps are shown
in
Fig. XIX-16.0-4o o o The implications (with respect to the
-2 - 0
flattening
problem)of
theseexperiments
O a can be summarized roughly as follows:
tI I I ,
1
,
(i) for frequencies f > 500 cps, there is0 1.68 3.36 5.04 6.72
T, (MSEc)
no flattening; (ii)
for 167< f -
400cps,
(b) the flattening is very pronounced; (iii) for frequencies at which the flattening occurs, Fig. XIX-16. the regions of n over which the threshold Variations in binaural-masked threshold remains flat are given approximately by as a function of the interaural delay n n/f + h )/f-h (n an integer), of the noise. The threshold for the case n
T = 0 is represented by 0 db. where h is ~0. 6 msec. In addition to n
(XIX. COMMUNICATIONS BIOPHYSICS)
helping specify the flattening phenomenon, the time-delay experiment has served, along
with recent experiments by Langford and Jeffress,
7to specify other characteristics of the
threshold curve. For example, as a result of all of these experiments, it is now well
estab-lished that the threshold dependence on Tn has the general form of a damped periodic
function for which the period is equal to the period of the tone. It also appears that the
degree of damping can be predicted from the value of the critical bandwidth.
8The
phase-shift experiment, on the other hand, has served to relate the difference between the
thresh-olds for the cases "signal in phase-noise out of phase" and "signal out of phase-noise in
phase" to the flattening phenomenon. For further details the reader is referred to the
theses of L. R. Rabiner
9and C. L. Laurence, 10and the work of Durlach1 and Jeffress.
5 - 73.
PRELIMINARY EXPERIMENT ON ADAPTATION TO MAGNIFIED
INTER-AURAL TIME DELAYS
In many psychoacoustic experiments involving time parameters, the data appear to
undergo a change in character when the time parameter is of the order of the time width,
h, of the head. An example of such a "critical point" has already been cited above in
connection with binaural unmasking. A second example (probably closely related) is
furnished when one stimulates the two ears with broadband noise signals differing only
in time delay,
T,and asks the subject to report on the position of the subjective image
inside his head. The image occurs in the center of the head for
-= 0 and progressively
moves across to the leading ear as
Tincreases to h. As
Tincreases beyond h,
how-ever, the image tends to remain "locked" at the leading ear. A third example is found
in the study of localization cues for tone stimuli. Letting T denote the period of the
tone, one finds that for T > h, the dominant interaural cue is the interaural time delay,
whereas for T < h, the dominant interaural cue is the interaural intensity difference.
In each of these cases, the fact that the critical point is roughly equal to the time
width of the head appears to be more than a coincidence.
One wonders, in fact, if the
processing mechanisms in the auditory system were not developed in a manner that takes
specific account of the head width. This leads one to conjecture that there might be a
close correlation between the head width and the critical points for various head widths.
One way of exploring this question is to see if a given subject can be adapted to an
arti-ficially large head width (which has the effect of magnifying the interaural time delays)
and determine whether or not these critical points are shifted accordingly.
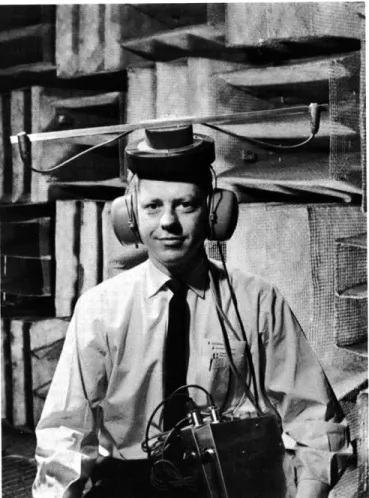
The specific experiment that was attempted was styled after that of R. Held in which
subjects were fitted with pseudophones that rotated the interaural axis in the horizontal
plane.11 In the present experiment, pseudophones were constructed which had the effect
of expanding the interaural distance by a factor of three and reducing the interaural
atten-uation caused by head shadowing. A photograph of this apparatus is shown in Fig. XIX-17.
The tests performed on the subjects (before and after "adaptation training" 12) consisted
(XIX.
COMMUNICATIONS BIOPHYSICS)
of localization tests and binaural unmasking tests at frequencies in the interval
100-600 cps. The results on localization were somewhat ambiguous in that one subject showed
appreciable adaptation (even in the region where the interaural delay was substantially
greater than 0. 6 msec), while two other subjects showed only very minor adaptation.
The results on binaural unmasking showed no change attributable to the adaptation
training, i. e., the critical point that occurred at approximately
Tn=
h before training
occurred at almost the same point after training.
If the critical point in the masking
data had shifted, one could draw a relatively firm conclusion.
From the fact that it did
not shift, one can only conclude that either the head width is not related to the critical
point or the relevant processing mechanisms are "wired in" and cannot be changed by
learning or the equipment and/or the adaptation training were inadequate.
For further
details on this project, the reader is referred to the thesis by G. E. Wien.
1 3Fig. XIX-17.
Apparatus used for "head-stretching" experiment.
Signals are picked up by microphones at end of the
horizontal bar, amplified by circuitry in boxes, and
presented to subject through earphones (unseen)
con-tained in acoustical ear muffs.
(XIX. COMMUNICATIONS BIOPHYSICS)
4. THEORETICAL WORK ON BINAURAL UNMASKING
In addition to the experimental results outlined above, two theoretical results have been obtained.
1. The EC model has been extended to apply to data describing the variations in threshold as a function of the interaural correlation of the masking noise.14 The data considered are those of Robinson and Jeffress in which the correlation was controlled by varying the amount of independent noise fed to the two ears.15
2. As described in section Z, if the signal tone has a frequency f < 400 cps, the var-iation of the masked threshold with the interaural time delay Tr of the noise exhibits a
Ii 'I, '1, ,- '4, '-~' I'* f/f f/ f I
r'
3M 2 /kc tt B3 62' ( If ,I . \-(b)
Fig. XIX-18.
Myotis lucifugus intercepting a tossed mealworm in the presence of a
yew branch: (a) multiflash photograph; (b) line drawing traced from the
photograph. Four flashes are shown. Only the first three are reproduced
in the drawing.
(The letters refer to the objects and the numerical
sub-scripts to the time sequence.) At flash 3, the bat has caught the
meal-worm in its tail membrane.
In flashes 3 and 4, the bat is upside down
and is reaching into its tail membrane to grasp the mealworm with its
mouth. In flashes 2, 3, and 4, the bat and mealworm are within 1 ft of
the nearest part of the yew branch. (Photograph and drawing obtained
from F. A. Webster.)
(a)
(XIX. COMMUNICATIONS BIOPHYSICS)
flattening for certain regions of
Tn.
It has recently been observed that this flattening is
consistent with the EC model, provided that one augments the model with the hypothesis
that the stimuli undergo a time contraction when Tn is in the region of flattening. If, for
simplicity, we restrict the values of Tn to the region h - Tn -< 1/2f, this time contraction
is described by the transformation t
-
(h/Tn)t.
In addition to making the EC model
con-sistent with the available data, this hypothesis has been used to predict results for which
there are no available data. Experiments designed to test these predictions are now
under way. A brief description of this theoretical work can be found in an informal
mem-orandum.16
5.
RESULTS RELATED TO BAT-ECHOLOCATION SYSTEMS
This project, conducted in collaboration with F. A. Webster, 17 consisted of two parts:
(i) construction of an ultrasonic "scattering range" to measure the reflective properties
of targets; and (ii) preliminary experiments on the bat's ability to overcome "clutter."
1 8The scattering range was not only needed to measure the clutter situation faced by the
bat in part (ii) of this project but also as a general tool for the whole bat program. This
range has been completed and appears to be adequate for measuring the ultrasonic
scat-tering properties of moths, fruit flies, mealworms, etc.
In order to facilitate the
anal-ysis of the behavioral results on target discrimination by Myotis lucifugus, 19 comparative
measurements have been made on mealworms and various types of spheres. The results
of the clutter experiments, although very preliminary, indicate that the bat may transmit
special signals when faced with extreme clutter situations. A picture of a Myotis
pur-suing and catching a mealworm in a background of "yew clutter" is shown in Fig. XIX-18.
For further details on this work, the reader is referred to the thesis by A. W. W.
Clay, Jr.,20 to Webster and Durlach,19 and to the publications of D. R. Griffin and
F. A. Webster.Zl
N. I. Durlach
Footnotes and References
1. N. I. Durlach, Equalization and cancellation theory of binaural masking-level
differences, J. Acoust. Soc. Am. 35, 1206-1218 (1963).
2.
See, for example, G. Moushegian and L. A. Jeffress, Role of interaural time
and intensity differences in the lateralization of low-frequency tones, J. Acoust. Soc.
Am. 31, 1441-1445 (1959).
3.
By symmetry, one would expect that the thresholds for the cases
(T
s,
a
s)
and
(-Ts,
1/as)
would be equal and the thresholds for the cases (-T s , as) and (Ts,1/as)
wouldbe equal. The experimental results show that the thresholds for all four cases are equal.
4.
H. S. Colburn, Time-Intensity Relations for Binaural Masking, S. M. Thesis,
Department of Electrical Engineering,
M.
I. T., May 1964.
(XIX. COMMUNICATIONS BIOPHYSICS)
5. L. A. Jeffress, H. C. Blodgett, and B. H. Deatherage, The masking of tones by white noise as a function of the interaural phases of both components. I. 500 cps, J. Acoust. Soc. Am. 24, 523-527 (1952).
6. L. A. Jeffress, H. C. Blodgett, and B. H. Deatherage, Masking and interaural phase. II. 167 cps, J. Acoust. Soc. Am. 34, 1124-1126 (1962).
7. L. A. Jeffress, private communication. (The results of the work of Langford and Jeffress are scheduled to appear in J. Acoust. Soc. Am., August 1964.)
8. For a prediction based on the EC model, see N. I. Durlach, J. Acoust. Soc. Am. 35, 1206 (1963), Fig. 8; see also Langford and Jeffress, J. Acoust. Soc. Am. in press.
9. L. R. Rabiner, Binaural Masking - The Effects of Interaural Delay of the Noise on the Detection of Tones, S. M. Thesis, Department of Electrical Engineering, M. I. T., May 1964.
10. C. L. Laurence, Studies of Masking Noise Phase Delays in Binaural Masking Level Differences, S. B. Thesis, Department of Physics, M. I. T., May 1964.
11. R. Held, Trained Shifts in Binaural Direction Finding, Ph. D. Thesis, Harvard University, 1952.
12. "Adaptation training" consisted primarily of actively moving about in the ane-choic chamber while wearing the hat, with various acoustical stimuli being presented through loudspeakers.
13. G. E. Wien, A Preliminary Investigation of the Effect of Head vVidth on Binaural Hearing, S. M. Thesis, Department of Electrical Engineering, M. I. T., May 1964.
14. N. I. Durlach, Note on binaural masking-level differences as a function of the interaural correlation of the masking noise (J. Acoust. Soc. Am. in press).
15. D. E. Robinson and L. A. Jeffress, Effect of varying the interaural noise cor-relation on the detectability of tonal signals, J. Acoust. Soc. Am. 35, 1947-1952 (1963). 16. N. I. Durlach, Time Contraction - A Possible Solution to the 'Flattening Prob-lem' in Binaural Masking (unpublished, May 1964).
17. F. A. Webster is the principle investigator for the "Bat-Echolocation Project," Sensory Systems Laboratory, Cambridge, Massachusttes.
18. "Clutter" is defined as interference from unwanted echos.
19. See F. A. Webster and N. I. Durlach, Echolocation Systems of the Bat - Prog-ress Report on Experimental Studies Conducted at F. A. Webster's Laboratory (1 Novem-ber 1961-1 SeptemNovem-ber 1962), Report 41G-3, Lincoln Laboratory, M. I. T., August 1963.
20. A. W. W. Clay, Jr., The Effects of Clutter on the Echolocation System of Bats, S. B. Thesis, Department of Electrical Engineering, M. I. T., May 1964.
21. See, for example, D. R. Griffin, Listening in the Dark (Yale University Press, New Haven, 1958); F. A. Webster, Acoustical Control of Airborne Interceptions by
Bats, Proc. International Congress on Technology and Blindness, American Foundation for the Blind, 1963.