HAL Id: hal-01474894
https://hal.archives-ouvertes.fr/hal-01474894
Submitted on 23 Feb 2017
HAL is a multi-disciplinary open access
archive for the deposit and dissemination of
sci-entific research documents, whether they are
pub-lished or not. The documents may come from
teaching and research institutions in France or
abroad, or from public or private research centers.
L’archive ouverte pluridisciplinaire HAL, est
destinée au dépôt et à la diffusion de documents
scientifiques de niveau recherche, publiés ou non,
émanant des établissements d’enseignement et de
recherche français ou étrangers, des laboratoires
publics ou privés.
Sinusoidal modelling for ecoacoustics
Patrice Guyot, Alice Eldridge, Ying Chen Eyre-Walker, Alison Johnston,
Thomas Pellegrini, Mika Peck
To cite this version:
Patrice Guyot, Alice Eldridge, Ying Chen Eyre-Walker, Alison Johnston, Thomas Pellegrini, et al..
Sinusoidal modelling for ecoacoustics. Annual conference Interspeech (INTERSPEECH 2016), Sep
2016, San Francisco, United States. pp. 2602-2606. �hal-01474894�
O
pen
A
rchive
T
OULOUSE
A
rchive
O
uverte (
OATAO
)
OATAO is an open access repository that collects the work of Toulouse researchers and
makes it freely available over the web where possible.
This is an author-deposited version published in :
http://oatao.univ-toulouse.fr/
Eprints ID : 17162
The contribution was presented at INTERSPEECH 2016 :
http://www.interspeech2016.org
To cite this version :
Guyot, Patrice and Eldridge, Alice and Chen
Eyre-Walker, Ying and Johnston, Alison and Pellegrini, Thomas and Peck,
Mika Sinusoidal modelling for ecoacoustics. (2016) In: Annual
conference Interspeech (INTERSPEECH 2016), 9 January 2016 - 12
September 2016 (San Francisco, United States).
Any correspondence concerning this service should be sent to the repository
administrator: [email protected]
Sinusoidal modelling for ecoacoustics
Patrice Guyot
1, Alice Eldridge
2,
Ying Chen Eyre-Walker
1, Alison Johnston
3, Thomas Pellegrini
4, Mika Peck
11
School of Life Sciences, University of Sussex, Brighton, United Kingdom.
2
Sussex Humanities Lab/ Music, University of Sussex, Brighton, United Kingdom.
3
British Trust for Ornithology, Thetford, United Kingdom.
4
Universit´e de Toulouse, UPS, IRIT, Toulouse, France
[email protected], [email protected], [email protected], [email protected], [email protected], [email protected]
Abstract
Biodiversity assessment is a central and urgent task, neces-sary to monitoring the changes to ecological systems and under-standing the factors which drive these changes. Technological advances are providing new approaches to monitoring, which are particularly useful in remote regions. Situated within the framework of the emerging field of ecoacoustics, there is grow-ing interest in the possibility of extractgrow-ing ecological informa-tion from digital recordings of the acoustic environment. Rather than focusing on identification of individual species, an increas-ing number of automated indices attempt to summarise acoustic activity at the community level, in order to provide a proxy for biodiversity. Originally designed for speech processing, sinu-soidal modelling has previously been used as a bioacoustic tool, for example to detect particular bird species. In this paper, we demonstrate the use of sinusoidal modelling as a proxy for bird abundance. Using data from acoustic surveys made during the breeding season in UK woodland, the number of extracted sinu-soidal tracks is shown to correlate with estimates of bird abun-dance made by expert ornithologists listening to the recordings. We also report ongoing work exploring a new approach to in-vestigate the composition of calls in spectro-temporal space that constitutes a promising new method for Ecoaoustic biodiversity assessment.
Index Terms: soundscape ecology, ecoacoustics, bird song, partial, sinusoidal, distribution, biodiversity monitoring
1. Introduction
Numerous multilateral initiatives, such as the Convention for Biological Diversity, aim to reduce the rate of loss of global biodiversity; traditional methods of biodiversity monitoring and assessment are impractical over the broad spatial extent and short time frame required to assess the rapid biodiversity change currently occurring. Based on the assumption that vocalising species are valid indicators of biodiversity (e.g. [1]), the emerg-ing discipline of ecoacoustics [2] promotes the possibility of rapid acoustic assessment as an effective and efficient diversity monitoring method.
Ecoacoustics is a theoretical and applied discipline that considers sound (the acoustic environment, or soundscape, as a material from which to infer ecological information and in-vestigates the ecology of populations and communities as well as the role of sound in animal ecology [3]. Ecoacoustic moni-toring methods aim to derive a proxy for the biodiversity of the
community from audio recordings made in situ, which can be an investigative tool for ecological research and a cost-effective monitoring tool for conservation biology. Based on the assump-tion that the structure of the acoustic environment reflects the structure of the population of vocalising animals, various auto-matic acoustic indices have been proposed. These tend to pro-vide statistical summaries of digital audio recordings in the time or frequency domain. In this paper we explore the utility of si-nusoidal modelling as a tool for ecoacoustic research.
Bird communities are good taxa to study using this method, because, like human speech, birds produce predominantly pitched, harmonic sounds, although some calls contain noise-like components. Sinusoidal modelling is a method developed for speech analysis that extracts a sum of time-frequency com-ponents and in previous bioacoustic research it has been suc-cessfully applied to the identification of specific bird calls [4]. In this paper we develop the use of sinusoidal modelling to sum-marise the acoustic activity of entire bird communities. Rather than focusing on detection of particular species, we are con-cerned with summarising the global distribution of the vocali-sations in the time-frequency domain; we describe new indices derived from sinusoidal modelling which may be useful indica-tors of biodiversity.
This paper is organized as follows: Section 2 contextualises our work by outlining some related research in ecoacoustics and sinusoidal modelling. Analysis methods are given in section 3 and our data collection and annotation in section 3.1. Experi-mental results are presented and discussed in sections 4 and 5.
2. Context
2.1. Theoretical and methodological foundations of ecoa-coustics
Whereas Bioacoustics focuses on the information transferred between individuals [5], ecoacoustics considers sound to be a core component and indicator of ecological processes and con-siders larger ecological units. Ecoacoustics has ultimate appli-cation in the analysis and monitoring of ecological communities and processes, and it is theoretically grounded in terms of the constraints on the evolution of animal signals. The Acoustic Adaptation Hypothesis (AAH) [6] assumes that the vocalisa-tions of signalling species adapt to the specific acoustic prop-erties of their habitats (ground morphology, vegetation struc-ture, atmospheric content etc.) as signals evolve to minimise attenuation and degradation. The Acoustic Niche Hypothesis
(ANH) [7] adds a sonic component to Hutchinson’s original concept of ecological niche [8] and is derived from the empir-ical observation that the calls of species in the same location tend to show spectro-temporal partitioning such that there is lit-tle overlap of signals. These processes are assumed to operate in tandem and to opposite effect: the AAH describes the impact of environmental degradation of signals; the ANH addresses the acoustic interference from conspecifics. Critically, both of these processes predict ecologically meaningful patterns in the global soundscape, but ecoacoustics currently lacks the tools necessary to investigate these spectro-temporal structures.
Existing ‘community’ indices [1, 9] are derived from rep-resentations of the acoustic signal in either the time or fre-quency domain. We suggest that this limits their potential to access and assess the acoustic patterns and processes occurring in time-frequency domain. Some indices analyse the acoustic environment, or soundscape, in terms of assumed differences produced by the sources (human-activity versus vocalisations of non-human species) in time [10] or frequency [11]. Oth-ers have adapted traditional biodivOth-ersity indices to calculate en-tropy measures in time or frequency domains [12].
2.2. Sinusoidal modelling
Acoustic events which contain harmonic signals (such as sounds made by birds) can be modelled by a sum of amplitude and frequency modulated sinusoids. Sinusoidal modelling was first demonstrated as an automatic analysis tool for the analysis of human speech in 1986 [13] and enabled a convincing resyn-thesis of speech waveforms.
The original algorithm consists of first picking peaks from each frame of a spectrogram, then linking peaks across frames to form partial tracks. More recent research has focused on re-ducing computational complexity [14] as well as the localiza-tion of superposed speech to improve speaker diarisalocaliza-tion [15].
Sinusoidal modelling has also been used as a bioacoustic tool for bird species recognition [16, 17, 18, 19, 20]. However, most of these approaches focus on few species [4] or analysing very clean recordings [16, 17, 18]. These approaches also have a heavy computational cost, for instance by considering all the spectral peaks at each frame time [13, 17, 19]. In this paper, we implement a computationally more efficient method and explore its utility as a community level index for ecoacoustic research.
3. Method
3.1. Data collection and annotationOur corpus consists of field recordings from an acoustic survey carried out over the bird breeding season in the UK (May - June 2015). In order to assess the methods in a range of environ-ments and with a range of avian communities, a stark habitat gradient was sampled from ancient woodland to farmed land. The Balmer site consists of large open fields of monoculture farmed land on the Sussex downs. The Knepp site is rewilded farmland which has been regenerating for 15 years and com-prises a series of small areas of grassland surrounded by mature hedges. The Plashett site is an ancient woodland.
A set of 15 autonomous recording devices were deployed for 3 consecutive days at each site and the vices were com-posed of SM2 and SM3 from Wildlife Acoustics1. The devices were located on a 250 meter grid and scheduled recordings were made for 1 minute every 15 minutes over the dawn chorus (from
1http://www.wildlifeacoustics.com/
one hour before sunrise until 2.5 hours after). We used record-ings from only one channel on each device, giving a total of 2025 1-minute mono files.
The full corpus was annotated by an expert ornithologist who identified species present and made minimum abundance estimates for each species within each 1 minute file by listening (repeatedly if necessarily) to each file. 10% of the corpus was validated by a second ornithologist. Results were compared us-ing Cohen’s kappa coefficient of inter-rater agreement (0.623). This gives us baseline values for the number of species (N 0) and a proxy for the total number of individuals (N N ). Estima-tion of the number of individuals is difficult from recordings as we cannot know if two different vocalizations were produced by the same animal. An abundance proxy was achieved by record-ing the maximum number of simultaneous vocalisations heard for each species. The abundance proxy,N N , therefore corre-sponds to the minimum number of individuals that vocalised during the recording.
3.2. Partial tracking
Our method develops the partial tracking methods used for su-perposed speech detection [14, 15] and comprises the same two step algorithm: peak selection and track formation.
3.2.1. Peak Selection
Peaks are picked from a spectrogram, created by a Fast Fourier Transform2 over each frame. To be robust to noises from technophony, we focus on the frequency range most widely used by birds, between 1.6 and 8 kHz. In this bandwidth, we select peaks above the amplitude thresholdampmin. As record-ings have been made in different sonic environments, the signal-to-noise ratio can vary dramatically across files. We therefore use an adaptive threshold set at the average amplitude of the spectrogram plus 10 dB (set experimentally). Finally, we ex-tract the 5 peaks with highest amplitude from each frame, de-scribed by a time, frequency, amplitude triple.
Figure 1: Linked peaks. In this example, only one on two cou-ple of peaks from consecutive time steps is linked to form a track (adapted from [21]).
3.2.2. Track Formation
In the second step, the sinusoidal segments are built by linking the selected peaks. The distance between each peakpiof the 2Sampling Rate: 48 kHz; Window size: 32 ms; Overlap: 16 ms;
framet, defined by a couple of frequency-amplitude, and each peakpj on an adjacent framet + 1, is calculated. If the dis-tancedi,jis less than a threshold, then the two peaks are linked (see [15] for more details about the distance).
Figure 1 illustrates the distance metric applied to two dif-ferent sets of peaks as over time. Peaks on the right are linked to form part of a track as the frequency-amplitude distance be-tween them falls below the threshold; the distance bebe-tween peaks on the left exceeds this threshold and no track is cre-ated. By linking peaks into tracks we assume they originate from the same source as it evolves over time. To further ensure meaningful tracks, we drop tracks less than a certain threshold, durationmin, set here to 10 frames.
3.3. New Indices based on Sinusoidal Modelling
The extracted tracks are assumed to reflect the vocalization of birds. In general bird song has less complex partial structure than human speech (i.e. the number of partial tracks approxi-mates the number of vocalisations). However, close groups of partials can appear in noisy parts such as wind or complex bird songs.
In order to mitigate bias of these clusters and to begin to explore time-frequency distribution of calls which other in-dices are insensitive to, we calculate measures of global time-frequency distribution of the tracked peaks as well as the to-tal number of tracksnt. qo and the concentration index (CI) are derived from a spatial analysis method [22] which was de-veloped to describe the geographic distribution of churches, by imposing a grid of quadrats on a given area.
• qo describes the patchiness of peak distribution across quadrats. The time-frequency zone of each frame is di-vided into quadrats. qois the proportion of quadrats oc-cupied by at least one peak.
• CI, the Concentration Index [22] describe the evenness of the distribution of peaks across quadrats. This is cal-culated as the ratio between the average distribution of peaks (m) and its variance s2
as shown in Equation 1. The CI approaches 1 for a random distribution, and in-creases as peaks are clustered in concentrated areas.
CI = s2/m (1) • nt, the number of tracks is computed with the constraint that no more than two simultaneous tracks are counted. This is done in order to avoid tracks coming from noise and complex bird songs, that are not relevant for the in-dividual count. It is therefore a conservative estimate of the number of vocalisations.
3.4. Acoustic indices
In order to compare our results with the state-of-the-art indices used in ecoacoustic research, we compute the most commonly used community level diversity indices:
• Acoustic Entropy Index (H) [23], the Shannon entropy index calculated on the average frequency bins. • Acoustic Eveness Index (AEI) [24], based on the
propor-tion of bins above a threshold.
• Acoustic Complexity Index (ACI) [10], that express the temporal variations of amplitude,
• and Bioacoustic Index (BI) [25] which captures the area under the mean spectrum, typically within the assumed range of biophony.
These indices are currently available from the seewave3and soundecology4 toolboxes. We computed them with our own python code5that includes a high pass filter at 300Hz to remove low frequency noise from traffic and other anthrophony. 3.5. Experiment
Thresholds for sinusoidal modelling were established experi-mentally on a small sample of files6; all indices were then com-puted on the whole corpus of 2025 files. In order to remove bias from wind, 344 files manually annotated as windy were dropped from theCI calculations. We used 720 quadtrats of 1s × 530Hz. Our python code is available online with some example files7.
4. Results
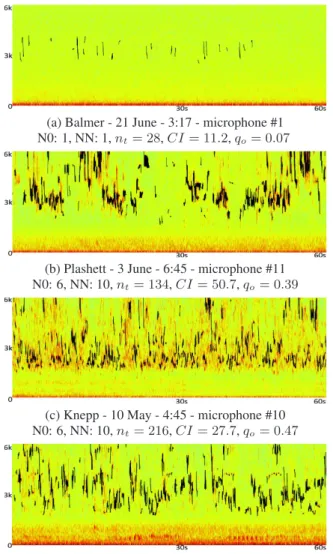
Figure 2 shows the output of our sinusoidal modelling for sam-ples across habitat types and with different species diversity and abundance values. We can observe a low frequency noise that is not captured by the sinusoidal modelling (e.g. planes, road). 4.1. Biodiversity indices
The correlation between the acoustic biodviersity indices with annotated values of number of speciesN 0 and abundance N N was tested with Spearman’s rank correlation coefficient (values near 0 suggest no correlation, values near 1 or -1 a positive or negative rank correlation). As shown in table 1, our new indices ntandq0show a stronger positive correlation with human mea-sures of biodiversity than any of the existing indices, which vary in strength and direction. The CI shows low correlation with both measures of biodiversity.
H AEI ACI BI nt qo CI N0 -0.49 0.64 0.54 0.62 0.69 0.67 0.19 NN -0.54 0.68 0.56 0.66 0.75 0.71 0.24 Table 1: Spearman’s Rank Correlation coefficients for auto-matic indices against annotated values of number of speciesN 0 and total abundanceN N .
4.2. Concentration Index
To investigate the CI further we explored the mean values for each site in table 2. The mean number of species (N 0) and in-dividuals (N N ) is lowest in the farmed site, Balmer, highest in the regenerating site, Knepp and at intermediate values for Plashett, the ancient woodland. The number of tracks,nt fol-lows this order, as also established by the positive correlation coefficients. In contrast the CI is lowest for Balmer and highest in Plashett, suggesting that this summary of the distribution of peaks is accessing other aspects of the acoustic environment.
3http://rug.mnhn.fr/seewave/
4http://ljvillanueva.github.io/soundecology/ 5http://tinyurl.com/jrs3whf
6In comparison to speech analysis, the main difference is the
appli-cation of relaxed condition on frequency with a higher threshold cf to
allow the tracking of bird songs with high frequency variation.
(a) Balmer - 21 June - 3:17 - microphone #1 N0: 1, NN: 1,nt= 28,CI = 11.2, qo= 0.07
(b) Plashett - 3 June - 6:45 - microphone #11 N0: 6, NN: 10,nt= 134,CI = 50.7, qo= 0.39
(c) Knepp - 10 May - 4:45 - microphone #10 N0: 6, NN: 10,nt= 216,CI = 27.7, qo= 0.47
(d) Knepp - 11 May - 5:45 - microphone #11 N0: 12, NN: 18,nt= 174,CI = 25.4, qo= 0.41 Figure 2: Spectrograms (0 to 6 kHz) for four 1 minute files across three habitat types. Sinusoidal models are superimposed on the spectrograms in black.
5. Discussion
These results suggest that sinusoidal modelling holds promise as a tool for ecoacoustic research in a number of ways. Ba-sic statistical information about the number and distribution of partials may serve as an effective proxy for the number of vo-calisations, and hence as abundance. Moreover, as a resynthe-sis method, it enables aural and algorithmic analyses of animal vocalisations separated from background noise. Although this may run counter to the ethos of soundscape ecology, this is a useful utility for the development and testing of automated in-dices.
5.1. Acoustic indices derived from sinusoidal modelling Basic summaries of the extracted partials (nt and qo) were shown to correlate more strongly with abundance counts than existing acoustic indices. It is likely that the tracked partials are representative of individual vocalisations, rather than individual birds and this deserves further research.
The development of new indices for use as proxies in bio-diversity assessment requires solid baseline data to validate
against. In this context, a major issue is the difficulty to ef-fectively estimate the number of individuals. For example in figure 2, the number of individuals in the noisy file (c) could be higher than in the file (b). Human annotation is inevitably sensitive to a number of factors that are difficult to control, such as number of listens, audio level, interpersonal differences in attention, and perceptual acuity.
5.2. Time frequency distribution
To begin to explore differences in time-frequency distribution, we used a Concentration Index derived from spatial analysis. CI is not associated with the estimated number of species or total abundance, and therefore obtains a poor correlation score with the valuesN 0 and N N (table 1). The difference of distribution can be observed for example in the figure 2 (b) and (c), where the number of estimated vocalizations are similar. The distribu-tion of tracks, as well as the distribudistribu-tion of the energy, seems sparser in the Plashett file. There could be a number of reasons for this including environmental, species and behavioural dif-ferences. For example, the denser woodland of Plashett may at-tenuate the call of distant birds, that are less filtered in the more open space of Knepp. So the acoustic community in Knepp is effectively sampled from a wider area.
The study of the distribution of calls echoes the Acoustic Niche Hypothesis [7] (ANH), that suggest the time-frequency distribution of calls is optimal to facilitate the inter- or intra-species communication. Our primary results on that topic sug-gest that the vocalization could be more concentrated in the an-cient woodland of Plashett, than in the Knepp regenerative land. The distribution of the vocalization could perhaps reflect the structure of vegetation at the site, which may be more random in a regenerative land, and more structured in the ancient wood-land. Further development with ecoacoustic metrics may bring more objective results in order to further assess these theories.
Balmer Knepp Plashett N0 2.8 6.2 4.9 NN 3.1 7.9 6.1 nt 47.3 148.3 125.5 CI 27 39 42
Table 2: Mean values ofN 0, N N , ntand CI for three sites.
6. Conclusion
In this paper, we presented an application of sinusoidal mod-elling for ecoacoustics. Our results, based on the number of tracks and the distribution of the peaks, show a 70% ranked correlation with the number of species, a stronger correlation than existing ecoacoustic indices. Further research is needed to establish the ecological relevance of CI, but the development of indices which access two dimensional time-frequency hold promise for the investigation of the distribution of bird calls and ecological hypotheses.
7. Acknowledgements
This research was funded by a Leverhulme Trust Research Project Grant. With thanks to Joseph Cooper for carrying out species identification.
8. References
[1] L. Lellouch, S. Pavoine, F. Jiguet, H. Glotin, and J. Sueur, “Mon-itoring temporal change of bird communities with dissimilarity acoustic indices.” Methods in Ecology and Evolution, vol. 4, pp. 495–505, 2014.
[2] J. Sueur and A. Farina, “Ecoacoustics: the eco-logical investigation and interpretation of environmental sound,” Biosemiotics, pp. 1–10, 2015. [Online]. Available: http://dx.doi.org/10.1007/s12304-015-9248-x
[3] B. Krause and A. Farina, “Using ecoacoustic methods to survey the impacts of climate change on biodiversity,” Biological
Con-servation, vol. 195, pp. 245 – 254, 2016.
[4] P. Galeotti and G. Pavan, “Individual recognition of male tawny owls (strix aluco) using spectrograms of their territorial calls,”
Ethology Ecology & Evolution, vol. 3, no. 2, pp. 113–126, 1991. [5] N. H. Fletcher, Animal bioacoustics. T. D. Rossing (Ed.),
Hand-book of acoustics. New York: Springer, 2007.
[6] E. S. Morton, “Ecological sources of selection on avian sounds,”
The American Naturalist, vol. 109, no. 965, pp. 17 – 34, 1975. [7] B. Krause, “The niche hypothesis, a hidden symphony of animal
sounds, the origins of musical expression and the health of habi-tats,” The Explorers journal, vol. Winter, pp. 156–160, 1993. [8] G. E. Hutchinson, “An introduction to population ecology.” 1978. [9] M. Towsey, J. Wimmer, I. Williamson, I., and P. Roe., “The use of acoustic indices to determine avian species richness in audio-recordings of the environment,” Ecological Informatics, 2013. [10] N. Pieretti, A. Farina, and D. Morri., “A new methodology to
infer the singing activity of an avian community: The acoustic complexity index (aci),” Ecological Indicators, vol. 11, no. 3, pp. 868–873, 2011.
[11] E. Kasten, S. Gage, J. Fox, and W. Joo., “The remote environ-mental assessment laboratory’s acoustic library: An archive for studying soundscape ecology,” Ecological Informatics, vol. 12, pp. 50–67, 2012.
[12] J. Sueur, A. Farina, A. Gasc, N. Pieretti, and S. Pavoine., “Acous-tic indices for biodiversity assessment and landscape investiga-tion,” Acta Acoustica United with Acoustica, vol. 100, pp. 772– 781, 2014.
[13] R. J. McAulay and T. F. Quatieri, “Speech analysis/synthesis based on a sinusoidal representation,” Acoustics, Speech and
Sig-nal Processing, IEEE Transactions on, vol. 34, no. 4, pp. 744– 754, 1986.
[14] T. Taniguchi, M. Tohyama, and K. Shirai, “Detection of speech and music based on spectral tracking,” Speech Communication, vol. 50, no. 7, pp. 547–563, 2008.
[15] M. Le Coz, J. Pinquier, and R. Andr´e-Obrecht, “Superposed speech localisation using frequency tracking,” in INTERSPEECH
2013 – 13thAnnual Conference of the International Speech
Com-munication Association, August 25-29, Lyon, France, Proceed-ings, 2013.
[16] A. H¨arm¨a, “Automatic identification of bird species based on si-nusoidal modeling of syllables,” in Acoustics, Speech, and Signal
Processing, 2003. Proceedings.(ICASSP’03). 2003 IEEE Interna-tional Conference on, vol. 5. IEEE, 2003, pp. V–545.
[17] Z. Chen and R. C. Maher, “Semi-automatic classification of bird vocalizations using spectral peak tracks,” The Journal of the
Acoustical Society of America, vol. 120, no. 5, pp. 2974–2984, 2006.
[18] P. Somervuo, A. H¨arm¨a, and S. Fagerlund, “Parametric represen-tations of bird sounds for automatic species recognition,” Audio,
Speech, and Language Processing, IEEE Transactions on, vol. 14, no. 6, pp. 2252–2263, 2006.
[19] J. R. Heller and J. D. Pinezich, “Automatic recognition of har-monic bird sounds using a frequency track extraction algorithm,”
The Journal of the Acoustical Society of America, vol. 124, no. 3, pp. 1830–1837, 2008.
[20] P. Jancovic, M. Kokuer, and M. Russell, “Bird species recognition from field recordings using hmm-based modelling of frequency tracks,” in Acoustics, Speech and Signal Processing (ICASSP),
2014 IEEE International Conference on. IEEE, 2014, pp. 8252– 8256.
[21] M. Le Coz, “Spectre de rythme et sources multiples: au cœur des contenus ethnomusicologiques et sonores,” Ph.D. dissertation, Toulouse 1, 2014.
[22] P. J. Taylor, Quantitative methods in geography: an introduction
to spatial analysis. Houghton Mifflin, 1977.
[23] J. Sueur, S. Pavoine, O. Hamerlynck, and S. Duvail, “Rapid acous-tic survey for biodiversity appraisal,” PLoS One, vol. 3, no. 12, p. e4065, 2008.
[24] L. Villanueva-Rivera, B. Pijanowski, J. Doucette, and B. Pekin., “A primer of acoustic analysis for landscape ecologists.”
Land-scape Ecology, vol. 26, pp. 1233–1246, 2011.
[25] N. Boelman, G. Asner, P. Hart, and R. Martin., “Multi-trophic in-vasion resistance in Hawaii: Bioacoustics, field surveys, and air-borne remote sensing,” Ecological Applications, vol. 17, no. 8, pp. 2137–2144, Dec 2007.
![Figure 1: Linked peaks. In this example, only one on two cou- cou-ple of peaks from consecutive time steps is linked to form a track (adapted from [21]).](https://thumb-eu.123doks.com/thumbv2/123doknet/14430520.515089/4.892.470.806.720.914/figure-linked-peaks-example-peaks-consecutive-linked-adapted.webp)