HAL Id: hal-01022073
https://hal.inria.fr/hal-01022073
Submitted on 10 Jul 2014HAL is a multi-disciplinary open access archive for the deposit and dissemination of sci-entific research documents, whether they are pub-lished or not. The documents may come from teaching and research institutions in France or abroad, or from public or private research centers.
L’archive ouverte pluridisciplinaire HAL, est destinée au dépôt et à la diffusion de documents scientifiques de niveau recherche, publiés ou non, émanant des établissements d’enseignement et de recherche français ou étrangers, des laboratoires publics ou privés.
Identification of inhomogeneous concrete cover by
non-contact ultrasonic method
Bogdan Piwakowski, Qiang Liu, Jean-Paul Balayssac, Géraldine Villain,
Vincent Garnier, Mariusz Kaczamrek, Radoslaw Drelich
To cite this version:
Bogdan Piwakowski, Qiang Liu, Jean-Paul Balayssac, Géraldine Villain, Vincent Garnier, et al.. Iden-tification of inhomogeneous concrete cover by non-contact ultrasonic method. EWSHM - 7th European Workshop on Structural Health Monitoring, IFFSTTAR, Inria, Université de Nantes, Jul 2014, Nantes, France. �hal-01022073�
I
DENTIFICATION OF INHOMOGENEOUS CONCRETE COVER BY NON
-CONTACT ULTRASONIC METHOD
B.Piwakowski1, Q.Liu1, J.-P. Balayssac 2
, G. Villain3, V. Garnier4, M. Kaczmarek5, R. Drelich5
1
Ecole Centrale de Lille (IEMN, TPIA UMR 8520 CNRS),Villeneuve d'Ascq Cedex, France,
2
Université de Toulouse, UPS, INSA, LMDC, 135 avenue de Rangueil, 31077 Toulouse, France
3
LUNAM Université, IFSTTAR, MACS, CS4, F-44344 Bouguenais Cedex, France
4
Aix Marseille Université, LCND, Laboratoire de Mécanique et d’AcoustiqueAvenue Gaston Berger, 13 625 Aix en Provence Cedex 1, France
5
Institute of Mechanics and Applied Computer Science, Kazimierz Wielki University, Bydgoszcz, Poland
bogdan.piwakowski@ec-lille.fr ABSTRACT
Concrete cover degradation is induced by aggressive agents in ambiance, chemicals, moisture, or temperature variations. Due to this degradation concrete becomes inhomogeneous and usually a thin surface layer appears with porosity and elastic modulus different than the properties of deeper sound concrete. Therefore the on-site nondestructive evaluation of concrete cover is important to monitor the integrity of concrete structures and prevent their irreversible damage.
In this paper the methodology applied by the classical technique used for ground structure recovery called Multichannel Analysis of Surface Waves (MASW) is used as the NDT tool to characterize the thickness and elastic modulus of concrete cover. The procedure consists in generation and reception of surface waves within the required frequency band, using the non-contact transducers which scan evaluated profiles. Then the phase velocity dispersion characteristic V(f) is extracted, and concrete cover is characterized using as the proposed velocity gradient. The dispersion characteristics are exploited by the inversion software in order to obtain the variation of shear wave velocity as a function of depth.
KEYWORDS : Concrete, ultrasonic NDT, surface waves, dispersion, inversion,
INTRODUCTION
The on-site non destructive evaluation of concrete cover is vital to monitor the integrity of concrete structures and prevent their irreversible damage. Various methods are available today for testing concrete structures. Among them, ultrasonic testing methods can be distinguished as they are non destructive and applicable on-site. The particularly useful for studies concrete cover are the ultrasonic methods which apply surface waves (SW), that propagate from the surface of examined material and penetrate the material within the depth close to the wavelength, [1]. In the case of a semi-infinite, homogeneous, isotropic and non absorbing elastic medium, the SW called the Rayleigh wave is characterized by constant and equal the phase velocity V and the group velocity Vg. However, mechanical loads and chemical attacks can degrade concrete starting from its surface. Concrete is thus rarely homogeneous and may be considered as a “layered” medium with mechanical properties which change with depth (or alternatively as a medium with wave velocity being a function of depth). Then, the phase and group velocity are not more equal, and the ordinary Rayleigh wave is replaced by dispersive pseudo-Rayleigh waves which are characterized by the
velocity dispersion V(f), [2]. If the dispersion characteristics V(f) is determined it can be used as the input for solving inverse problem in order to obtain the distribution of shear velocity as a function of depth Vs(d), [3].
In this paper the methodology applied by the classical technique used for ground structure recovery, called Multichannel Analysis of Surface Waves (MASW), [4], is considered as the NDT tool to characterize the concrete cover. The emission, reception and acquisition of SW is carrier out by the contact ultrasonic scanner, [2], illustrated in Fig. 1.a. The SW is generated by a non-contact emitter the position of which is fixed. In order to assure the SW generation, the inclination angle of the emitter is to be set close the second critical angle of transmission via air/concrete interface. The reception of SW along a straight line profile of length L, at N points, spaced by ∆x, takes place by the non-contact wideband (20-900 kHz) receiver, also inclined at critical angle. The receiver moves along the measured profile (Fig.1.b). The applied solution assures fully non-contact test which permits to avoid a modification of concrete surface by a coupling agent and a time consuming coupling procedure. Moreover, it enables quick, precise automatic measurements and scanner displacements. The B scan of SW pulses recorded for a single profile is illustrated in Fig. 1.c. The scanner can be used in laboratory and in outdoor conditions at any planar surface (wall, floor, ceiling), Fig. 1d. The recorded SW signals are used to determine dispersion characteristics
V(f) which is then explored in order to gain information concerning inhomogeneity of studied materials, i.e. the thickness of the cover layer and material parameters as functions of the inspected position.
Figure.1. (a) Automated non-contact scanner designed for the surface wave recording; (b) Acquisition geometry: the surface wave is recorded along a profile of length L, by means of moving receiver at N positions spaced of
∆x; c) B scan of recorded surface wave, d) Scanner in operation in outdoor conditions.
EWSHM 2014 - Nantes, France
1 DISPERSION CHARACTERISTIC OF INHOMOGENEOUS CONCRETE COVER AND ITS VELOCITY GRADIENT GV
Ultrasonic velocity in concrete depends on its composition (cement type, aggregate size, water/cement ratio, etc), porosity P and water content W. The concrete damage (degradation) starts at concrete/atmosphere interface and is caused by aggressive components included in air like CO2, moisture, acid rains, salts, and temperature changes. These factors influence porosity, water content, elastic modulus and cause the micro cracking as the result of carbonization. The above phenomena can be also stimulated by the way how the concrete was manufactured and the type of the formwork used. Our results obtained within the framework of SENSO project [5] show that for typical concrete structure with porosity P > 13% and water content W > 10%, the increase of P induces the velocity decrease, and the increase of W causes the wave velocity increase, [2]. Since all the factors act together, the final value of V is the result of their common influence. In order to simplify the problem in this paper we suppose that a studied concrete is composed of two layers: the surface layer (cover) with velocity Vs and of deep layer having velocity Vd. Taking into account the relation
between Vs and Vd three basic cases might be distinguished:
Case 1: Porosity P (including micro-cracks) is greater at the surface and W does not change much; consequently Vs is smaller than velocity of deep sound concrete: Vs<Vd.
Case 2: Water content W is greater at the surface than in deeper concrete and P remains constant; this results in Vs>Vd .
Case 3: Concrete is quasi homogenous and this means that V is quasi constant:
V ≈ Vs ≈ Vd ≈ constant.
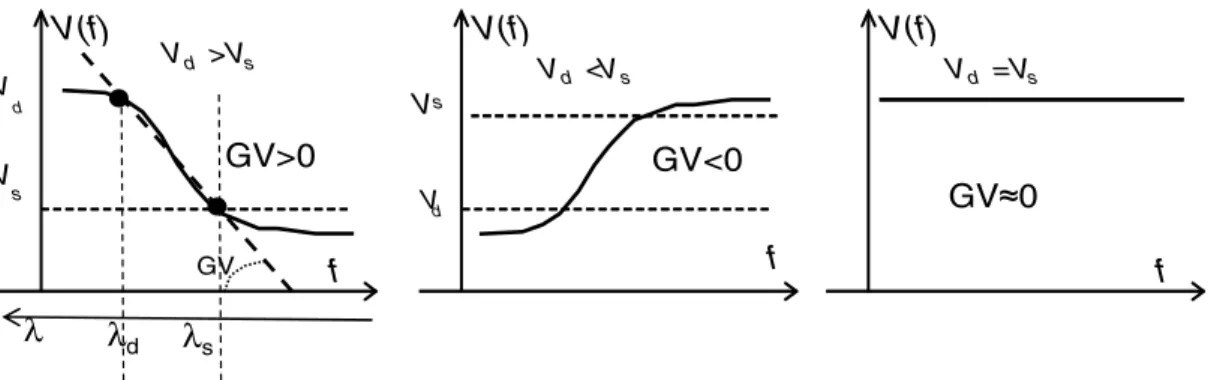
The above three cases result in specific shape of dispersion characteristics V(f), as illustrated in Fig. 1.
In order to quantify in a simple way the presence of the surface inhomogeneity the Velocity Gradient (GV) parameter is introduced. It is defined as a mean slope of dispersion V(λ=V/f) for
interval λs <λ< λd
=
(1)
where
λsand
λdcorrespond to wavelength in surface and deep layers.
Figure 2. Three basic shapes of dispersion characteristics V(f) and corresponding GV values
Thus the parameter GV expresses approximately the velocity variation
from the depth λsto λd. The wavelength limits λs =V(fmax)/fmax and λd = V(fmin)/fmin correspond to frequency band
[fmin, fmax], which is to be appropriately selected in order to assure that GV is determined with signal
to noise ratio sufficiently high. The band [fmin, fmax] depends in particular on the frequency
bandwidth of the applied emitter. In practice, because of aggregate size and intrinsic attenuation fmax
f V(f) V s V d V d >V s f V(f) V s V d V d <V s f V(f) V d =V s λd λs λ
●
●
GV GV>0 GV≈0 GV<0does not exceed 250 kHz. For concrete with homogeneous moisture content, when GV > 0 it indicates that the concrete is more degraded at its surface (the case just illustrated in Fig.1.c). In the opposite case, if GV < 0 this might indicate that the surface layer is stiffer than the deeper part due to for example carbonization effect.
Since the depth of penetration of surface waves is close to λ, the parameter GV defined as above
provides the information about variation of V as function of depth. The analysis of GV for the inspected materials permits easily check the presence of the inhomogeneity, quantify its level and to select the frequency range most suitable for further application of inversion procedure.
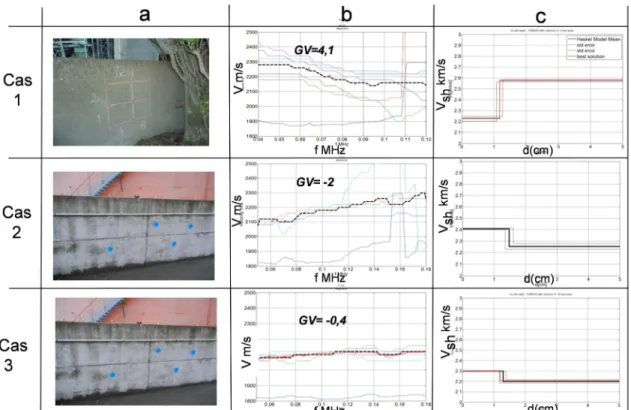
The procedure of characterization of concrete cover using the introduced above gradient analysis is illustrated in Figure 3. The three presented results were obtained during on site measurements (for details see next section). The column (b) of the Figure 1 shows the dispersion characteristics V(f) chosen in order to illustrate three cases defined previously. The column (c) provides the results of inversion, i.e shear wave velocity Vsh versus depth d. The inversion is performed using CLOUD
software, developed for laboratory studies, tested and validated on the model multilayered samples, [3,6]. The inversion procedure assumes the presence of two layers. The obtained results indicate that the structure of the concrete cover fits to the two layered model. In order to validate the above results, the depth of carbonization are compared with those obtained from the cores extracted from inspected walls and characterized using special protocol [7] developed within the frame of C2D2-ACDC project [8].
Case 1: GV> 0, corresponds to 65 years old (old) concrete displaying the clear signs of damage. The depth of carbonization found from the core samples is there about 29 mm and the inversion gives cover thickness d =11.8 mm. This suggests that the surface damage (micro cracks, porosity) dominates the effect of surface humidity and perhaps of carbonization (this latter may cause different effects)
Case 2: GV <0, corresponds to 10 years old (young) concrete of good quality. The negative value of GV suggests that carbonization and humidity may dominate. The depth of carbonization found from the core tests gives 3 - 4 mm, meanwhile the inversion technique indicates d =14 mm. This difference can be explained by e.g. deeper penetration of moisture than carbonization. This example indicates that finding the carbonization depth by using the inversion method (often the objective of interest) may be à priori not possible, except the instances when the influence of the phenomena on V(f) could be separated.
Case 3: GV≈0, is chosen in order to show the situation where V(f) is nearly constant (although on site obtaining V(f) constant is rarely met). The result is obtained for the same wall that was studied in Case 2, but the position is different. This shows that local variations of GV can be relatively strong.
The quantitative information for the three cases illustrated in Figure 3 are summarized in Table 1.
Table 1 Quantitative information for the three cases illustrated in Figure 3. Position Side GV λd=50mm, λs=20 mm m/s / mm Inversion results
Depth of carbonization from core tests mm d mm ∆d mm Vsurf m/s Vprof m/s Case 1 IV N A2 4.1 11.8 1.77 2225 2573 29 Case 2 III N J3 -2.05 14.8 2.5 2406 2254 3-4 Case 3 III N F3 -0.4 12.9 2.0 2300 2200 Not tested 3-4 mm in vicinity
EWSHM 2014 - Nantes, France
Figure 3. Procedure of concrete cover inspection using gradient velocity parameter: (a) Inspected concrete walls, (b) Dispersions characteristics V(f) illustrating three different cases of V(f) shape (c),
Inversion results showing the transversal velocity Vs as the function of depth d.
2 RESULTS: OUTDOOR INSPECTION OF TWO CONCRETE STRUCTURES
The inspection of concrete walls, carried out in the frame of French project “Analyse et
Capitalisation pour le Diagnostic des Constructions » (ACDC) [8] included the measurements at two sites with concrete of different age and exposition. These campaigns enabled us to create the complete data base of dispersions V(f) od inspected walls.
Each measurement area was assigned and coded by position of the elementary surface (its size was about 25x25cm) formed by the spaces between meshes of rebars. Dispersion V(f) was measured in each such area along five profiles and Vmesh(f) was found as their mean. Gradients GVmesh were then
found using formula (1), for each profile, taking λs = 20 mm et λp= 50mm (this corresponds to a
bandwidth about from fmin= 40 to fmax=110 kHz).
2.1 Site near Havre
This site is located in the thermal power station situated in the proximity of sea. Thus, the concrete suffers from the salt and hard very variable environmental conditions. The measurements were carried out for three concrete walls. Two walls, assigned I (single side) and IV (sides N and S) are 65 years old, another wall, assigned III (sides N et S) is 10 years old. (the symbols N and S indicate an exposition Nord and South respectively). The examples shown in Figure 3 just originate from this site.
Figure 4.a shows GVmesh obtained for all inspected walls. One can notice a great variability of GV
within the same wall. In order to obtain more representative global characteristic, the mean gradient
GVside was determined for each site (Fig.b). The analysis of the results indicates that old walls
display GV>0, thus suggesting that the concrete cover is not so stiff as the deeper concrete which may be related to higher porosity and micro cracks in the cover (case 1 from Figure 3). On the other
hand the younger wall III displays GV< 0, thus indicating opposite behavior, possibly higher influence of water content and limited effect of porosity (case 2 from Figure 3).
Figure4. (a) Site near Havre, gradients GV mesh over all inspected walls; (b) Site near Havre, Gradients
GV side for all inspected walls;- (c) Site near Marly, GV mesh over all inspected walls; (d) Site near Marly,
Gradients GV side for all inspected walls (the circles indicate the locations described in tables 1 and 2)
2.2 Site near Marly
This site is the express way bridge in the Nord of France, 35 years old and visually in good state. It includes 18 concrete piles, 60 cm thick. Four faces of two piles were examined;
two sites of pile assigned S, a priori most exposed to the climatic variations as sun, wind and rain, noted respectively as SAV and SAR,
two sites of pile ZBL, assigned as ZBL AV and ZBL AR, which constitute the central pile of this bridge, a priori less exposed to climatic variations.
Table 2. Characteristics of 3 sites denoted as ZBL AV
side mesh λ GV
p=50mm,λs=20 mm
m/s / mm
Inversion results Carbonization depth mm d mm ∆d mm Vsurf m/s Vprof m/s ZBL AV 2-4 -2.17 11.6 6.38 2840 2687 4.4 ZBL AV 6-5 -0.005 Inversion incertain if GV≈0 4.7 ZBL AV 7-5 -3.08 6.3 4.0 2760 2690 4.5
EWSHM 2014 - Nantes, France
The values of gradients (GV) for the sites are shown in cells (c ) and (d) of Figure 4. It is clearly visible that the gradients are considerably smaller than the gradients obtained for the site near Havre. Notice that certain areas display even gradient close to zero (GVmaille≈0), corresponding to
case 3 from Figures 2 and 3. The mean gradients GVface are also relatively very small, thus
indicating that all piles are rather in good state. For three sites, GVface are slightly negative just
indicating the influence of the moisture. Only one site for pile S, most exposed to environmental variations, displays GVface slightly positive and this could be interpreted as the first stage of the
porosity changes caused by damage.
Table 2 gives the results of identification of parameters by inversion method, particularly the carbonization depth (measured from core tests) for the three areas denoted by circles in Fig.4.c, These results can draw the following conclusions:
The carbonization of site ZBL AV is about 4.5 mm but the depth d obtained by inversion varies (12±6mm or 6±4mm). This confirms that it is impossible to interpret the negative gradient GV as to be directly linked with the carbonization depth,
Inversion for cases GV≈0 is rather impossible because if Vs = Vd , the depth d cannot be
evaluated. That is why, for small GV, the uncertainty of inverted ∆d becomes considerable. On the other hand, the inversion for small GV (i.e. small cover depth, of the order of several millimeters), requires SW with the wavelength comparable with d, which means higher frequencies (f > 400 kHz). Feasibility of such measuremts becomes doubtful because of high attenuation of waves in concrete.
CONCLUSION
1. The shape of dispersion characteristics of surface waves provides some information on the presence of inhomogeneous concrete cover and also on a type of its damage,
2. The parameter defined in this paper called velocity gradient GV enables to evaluate rapidly the presence of inhomogeneity, type of suspected damage and its range. Negative gradient might indicate that the porosity is smaller at the surface and / or that the concrete cover is more humid than its deep layers; the positive gradient could indicate that the porosity and micro cracking is higher at the surface (surface damage)
3. Taking into account the fact that velocity gradient is affected by numerous factors it seems to be impossible, at this stage of knowledge, to determine the type of the damage when using only the information included in parameters of SW. In order to distinguish the phenomena which contribute to modification of V(f) it seems be interesting to combine other methods, like electric and electromagnetic techniques, especially sensitive to water content in concrete [8].
4. The inversion method provides the global equivalent depth of concrete also without possibility to distinguish the type of its damage.
5. The inversion procedure for cases of very thin concrete cover is uncertain because this needs high frequencies which, in turn, are strongly attenuated in concrete. The minimum thickness which can be determined seems be close to 5 mm
6. The inversion provides, the shear wave velocity Vsh(d) as a function of depth. Completing the
data by the longitudinal wave velocity measured in the same frequency band as those used for inversion (obtained e.g. by another ultrasonic method) and by the concrete density, this enables to estimate the elastic modulus as the function of depth.
ACKNOWLEDGMENTS
This work was in part realized in the frame of a French research project (C2D2-ACDC) supported by the Ministry of Ecology and Sustainable Development (MEDDE).
REFERENCES
[1] 4. I.A. Viktorov, Rayleigh and Lamb Waves: Physical Theory and Application, Plenum Press, New York; 1966
[2] O. Abraham, B. Piwakowski, G. Villain, O. Durand, Non-contact, automated surface wave measurements for the mechanical characterization of concrete, Construction and Building Materials, Vol. 37, December 2012, pp 904-915
[3] .Piwakowski, P. Safinowski,M. Kaczmarek, Surface Wave Technique In Evaluation Of Concrete Cover: Data Processing And Identification Method, International Congress on Ultrasonics
ICU2011, Gdasnk, Poland, September 2011, published by AIP.
[4] Parc C.B., Xia J., Miller R,D., Multichannel analysis of surface waves (MASW), Geophysics, Vol. 64, 1998, pp 800-808
[5] J.P. Balayssac, S. Laurens, G. Arliguie, D. Breysse, V. Garnier, X. Dérobert, B. Piwakowski, Description of the general outlines of the French project SENSO-Quality assessment and limits of different NDT methods, Construction and Building Materials, Vol. 35, October 2012, pp. 131-138 [6] R. Drelich, B. Piwakowski , M. Kaczmarek, Identification of inhomogeneous cover layer by
non-contact ultrasonic method – studies for model material, Congrès Diagnobeton 2014, Toulouse, France, 19-20,mars, 2014
[7] Villain G., Sbartaï Z. M., Dérobert X., Garnier V., Balayssac J.-P., Durability diagnosis of a concrete structure in a tidal zone by combining NDT methods: laboratory tests and case study, Construction and Building Materials, Vol. 37, December 2012, p.893-903
[8] Garnier V., Martini D., Salin J., Fardeau V., Sbartaï Z.M, D Breysse, Piwakowski B, Villain G., Abraham O., Balayssac J.P., Non Destructive Testing of Concrete: Transfer from Laboratory to On-site Measurement, 7th European Workshop on Structural Health Monitoring EWSHM 2014, Nantes, France, 8-11 July, 2014
EWSHM 2014 - Nantes, France


![Dissociative ionization of neon clusters Ne[sub n], n=3 to 14: A realistic multisurface dynamical study](data:image/gif;base64,R0lGODlhAQABAIAAAP///wAAACH5BAEAAAAALAAAAAABAAEAAAICRAEAOw==)