HAL Id: hal-02972576
https://hal.archives-ouvertes.fr/hal-02972576
Submitted on 8 Nov 2020
HAL is a multi-disciplinary open access
archive for the deposit and dissemination of
sci-entific research documents, whether they are
pub-lished or not. The documents may come from
teaching and research institutions in France or
abroad, or from public or private research centers.
L’archive ouverte pluridisciplinaire HAL, est
destinée au dépôt et à la diffusion de documents
scientifiques de niveau recherche, publiés ou non,
émanant des établissements d’enseignement et de
recherche français ou étrangers, des laboratoires
publics ou privés.
COVIZ: A System for Visual Formation and Exploration
of Patient Cohorts
Cicero Pahins, Behrooz Omidvar-Tehrani, Sihem Amer-Yahia, Valérie Siroux,
Jean-Louis Pepin, Jean-Christian Borel, João Comba
To cite this version:
Cicero Pahins, Behrooz Omidvar-Tehrani, Sihem Amer-Yahia, Valérie Siroux, Jean-Louis Pepin, et al..
COVIZ: A System for Visual Formation and Exploration of Patient Cohorts. Proceedings of the VLDB
Endowment (PVLDB), VLDB Endowment, 2019, 12 (12), pp.1822-1825. �10.14778/3352063.3352075�.
�hal-02972576�
COVIZ: A System for Visual Formation and Exploration of
Patient Cohorts
C´ıcero A. L. Pahins
1, Behrooz Omidvar-Tehrani
2, Sihem Amer-Yahia
2, Val ´erie
Siroux
2,3, Jean-Louis Pepin
2,4, Jean-Christian Borel
5, Jo ˜ao L. D. Comba
11UFRGS (Brazil),2Univ. Grenoble Alpes, CNRS, LIG (France),3Institute for Advanced Biosciences and
Inserm (France),4
Grenoble University Hospital (France),5
AGIR- `a-Dom (France)
1{
cicero.pahins,comba
}@inf.ufrgs.br,
2,3,4firstname.lastname@univ-grenoble-alpes.fr,
5
j.borel@agiradom.com
ABSTRACT
We demonstrate COVIZ, an interactive system to visually form and explore patient cohorts. COVIZ seamlessly inte-grates visual cohort formation and exploration, making it a single destination for hypothesis generation. COVIZ is easy to use by medical experts and offers many features: (1) It provides the ability to isolate patient demographics (e.g., their age group and location), health markers (e.g., their body mass index), and treatments (e.g., Ventilation for res-piratory problems), and hence facilitates cohort formation; (2) It summarizes the evolution of treatments of a cohort into health trajectories, and lets medical experts explore those trajectories; (3) It guides them in examining differ-ent facets of a cohort and generating hypotheses for future analysis; (4) Finally, it provides the ability to compare the statistics and health trajectories of multiple cohorts at once. COVIZ relies on QDS, a novel data structure that encodes and indexes various data distributions to enable their effi-cient retrieval. Additionally, COVIZ visualizes air quality data in the regions where patients live to help with data interpretations. We demonstrate two key scenarios. In the ecological scenario, we show how COVIZ can be used to ex-plore patient data to generate hypotheses on the health evo-lution of cohorts. In the case cross-over scenario, we show how COVIZ can be used to generate hypotheses on cohort health and pollution data. A video demonstration of COVIZ is accessible via http://bit.ly/video-coviz.
PVLDB Reference Format:
C´ıcero A. L. Pahins et al.. COVIZ: A System for Visual For-mation and Exploration of Patient Cohorts. PVLDB, 12(12): xxxx-yyyy, 2019.
DOI: https://doi.org/10.14778/xxxxxxx.xxxxxxx
1.
INTRODUCTION
With the increasing availability of large-scale health-care data in various sectors (e.g., prognoses, treatments, hospi-talizations and compliances), medical experts need effective
This work is licensed under the Creative Commons Attribution-NonCommercial-NoDerivatives 4.0 International License. To view a copy of this license, visit http://creativecommons.org/licenses/by-nc-nd/4.0/. For any use beyond those covered by this license, obtain permission by emailing info@vldb.org. Copyright is held by the owner/author(s). Publication rights licensed to the VLDB Endowment.
Proceedings of the VLDB Endowment,Vol. 12, No. 12 ISSN 2150-8097.
DOI: https://doi.org/10.14778/xxxxxxx.xxxxxxx
data-driven methods to identify patient cohorts, examine and explain their health and its evolution, and compare co-horts. Medical cohort analysis exhibits the collective be-havior of patients, providing insights on the evolution of their health conditions and their reaction to treatments and to their environment [11]. Cohort analysis serves various goals such as augmenting treatment effectiveness, defining health campaigns and public policies, understanding patient satisfaction, and optimizing health-care spending and rev-enue [10]. The many facets that affect patients’ health re-quire to adopt an exploratory and holistic approach to its analysis. Medical experts do not necessarily know what to look for in the data, which cohorts are most insightful, and how to make sense of some observations. Cohort analysis can greatly benefit from a visual tool that helps them walk through their data to identify cohorts of interest and generate hypotheses. An essential aspect of that process is the ability to enrich observations with exogenous data that can be used to make sense of some phenomenon. For instance, analyz-ing data about patients sufferanalyz-ing from respiratory problems would benefit from visualizing air quality data in the regions where those patients live.
We propose to demonstrate COVIZ, a system that acts as a visual enabler for cohort formation and exploration. COVIZ lets medical experts form cohorts, obtain their var-ious statistics, examine their health condition and treat-ments, visualize how their health evolves over time, and compare cohorts. To do that, COVIZ relies on two principles: aggregated analytics and interactivity. Aggregated an-alytics refers to forming groups of patients (aka cohorts) in an exploratory fashion and observe their collective behav-ior. Cohorts can be formed with common demographics, health markers, and treatments. The visual interface helps medical experts examine different possibilities of forming co-horts, verifying members of coco-horts, and examining differ-ences in their health status. Interactivity requires fast iter-ations so that the train of thought of the analyst is not lost during the formation and exploration of cohorts. To ensure that, COVIZ relies on QDS [12], a novel data cube structure that encodes various distributions of health-care data and indexes them to enable their efficient retrieval. To the best of our knowledge, COVIZ is the first mixed-initiative visual analytics system that enables medical experts to form and explore cohorts.
Visual analytics has been recently applied to enrich differ-ent data analysis tasks. Zenvisage [13] enables visual query-ing of data, where experts need to express their needs in a
Visual cohort forma/on
Exogenous data
QDS index construc/on
Health-care data Visual cohort
explora/on
Figure 1: COVIZ architecture.
SQL-like language which operates on top of a visual algebra to show results. Vexus [1] provides native support for vi-sualizing and exploring groups of users. Vizdom [3] enables an interactive whiteboard to compose complex workflows of data analysis and statistics. It exploits approximation and partial refinement techniques to deliver visualizations inter-actively. Also SeeDB [14] and Voyager [17] are visualization recommendation tools that explore the space of visualiza-tions, and recommend interesting ones. While interactivity has been the focus of these systems, there has been less attention towards aggregated analytics (i.e., analysis of co-horts). COVIZ is a single destination system that visually enables the formation and exploration of medical cohorts without the burden of formalizing queries. As such, it can easily be used by medical experts to identify cohorts of in-terest and generate hypotheses on their health evolution and the impact of the environment.
2.
SYSTEM DESIGN
The overall architecture of COVIZ is illustrated in Fig-ure 1. Initially an index is built offline to boost online cohort formation and exploration. COVIZ displays health-care data and other exogenous data sources as separate layers over a geographical map. A set of filters is pro-vided in the visual interface to facilitate the visual forma-tion of cohorts. Once a cohort is formed, COVIZ provides a succinct representation of the cohort’s health trajectory which helps analysts comprehend the health evolution of cohort’s members and compare cohorts (i.e., cohort explo-ration). COVIZ is a web service whose front-end is imple-mented in the Angular framework and back-end in C++ (the index) and Python (cohort exploration). The implementa-tion of COVIZ is publicly available under GPL-3.0 license: http://bit.ly/code-coviz.
2.1
Datasets
Health-care data. We use a dataset from our medical partner which contains events of 56, 284 patients with res-piratory problems between the years 2000 and 2017. Pa-tient events are: treatment, compliance, etiology, fatigue marker, BMI marker, sleepiness marker, and hospitaliza-tion. The dataset has 1, 536, 516 records in the following schema hpatient id , lat , lon, date, marker , value, treatment durationsi. Each record reports the value of a marker (fa-tigue, BMI, and sleepiness) for a specific patient identified by patient id. Also treatment durations reports the duration of treatments (with a month-level precision) which co-occurred with the marker for the patient patient id. Examples of treatments are Aerosoltherapy (AERO) and Oxygenother-apy (OXY). Each patient is also associated with a set of demographics such as gender, age, and life status. Figure 3-A illustrates a visualization of health-care data where colors are mapped to the number of patients.
G Grenoble [6-6]* [7-7]* [1-2]* [3-3]* B C [7-7]* [0-0]* [1-2]* F U [3-3]* [6-6]* [4-5]* [0-0]* A M [4-5]* Lyon Paris L P 0 G A M 1 G B F 2 G B F 3 G C M 4 L A M 5 L A M 6 P B F 7 P C U M Male Female Unknown F U A 55-61 62-66 67-70 B C
Dimension 1: City Dimension 2: Age Dimension 3: Gender
[4-5]* [6-7]* [0-3]*
G L P
Dimension 1: City Dimension 2: Age Dimension 3: Gender
QDS index Data
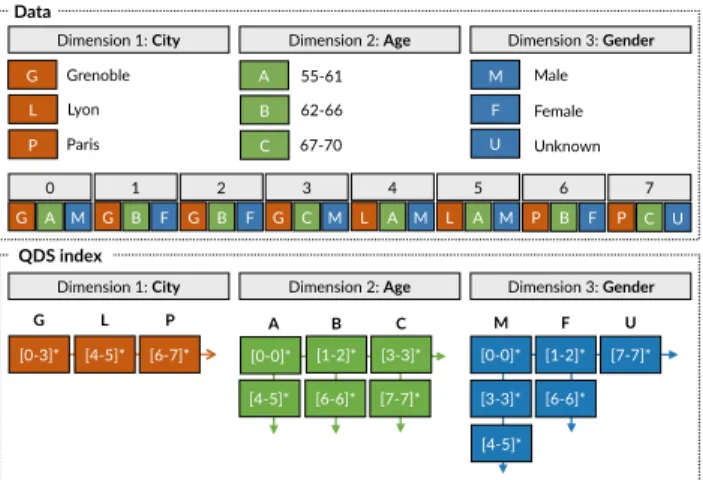
Figure 2: An instance of QDS indexing scheme for eight records and three dimensions. QDS stores at each pivot (marked with an asterisk) a payload that contains the representation of a distribution func-tion.
Pollution data. High air pollution levels can cause serious respiratory problems. We consider a dataset of air pollution as an exogenous resource to enable potential explanations of observations in the health status of the formed cohorts.1 The dataset contains values of different air pollutants (NO2, Ozone, PM2.5, and PM10) for all of France in the period of 2009 to 2013. The exposure models, developed in the con-text of a European project EU-FP7 SysCLAD [6], have a fine spatial resolution (1km × 1km) and temporal resolution (on a daily basis). The dataset has 2,671,128,000 records in the following schema hlat , lon, date, pollutant , valuei.
2.2
Cohort formation
A cohort denotes a set of patients with common predi-cates (i.e., demographics, health markers, and treatments). For instance in our data, the cohort of female patients in Grenoble contains 1, 531 members whose predicates are de-fined on “gender” and “city” dimensions. To form cohorts, experts should be able to add/remove filters on predicates and the visual interface should provide immediate insights on the changes. The final set of filters will constitute the cohort. Cohort formation is not a straight-forward task for medical experts as they often have a partial understanding of their data and their needs. Hence they need to iterate over several exploration steps to reach their cohort of in-terest. This requires interactive performance to ensure a latency under 100ms [7]. To achieve that, different index-ing schemes have been proposed, all of which pre-compute statistics for some pre-defined aggregations, such as count and average [9]. However most indexes store simple aggre-gations over individual data records. Hence they do not provide native support for cohorts and their detailed statis-tics. Moreover, the index structure should be adapted to the spatial aggregation of records.
COVIZ benefits from a new generation of data cube struc-tures designed to support visual and interactive cohort for-mation by supporting count queries used in heatmaps and
1The common attributes between the health-care data and
the pollution data are time and location. Any other ex-ogenous dataset with this commonality can be employed in COVIZ.
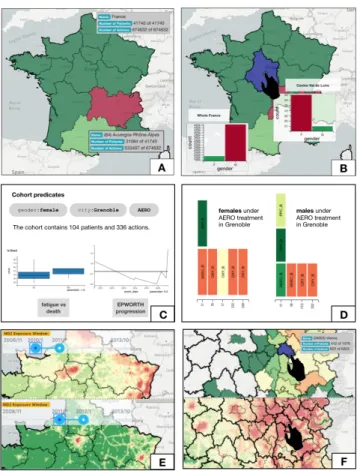
Figure 3: Tasks in COVIZ: cohort formation (A-B), cohort comparison (C-D), sensemaking with pollu-tion data (E-F).
histograms, e.g., “how many events occurred in a given re-gion on a given date?” [4, 16]. COVIZ integrates a new data cube structure called Quantile Data Structure (QDS) [12] which is an extension of HashedCubes [4] to improve ef-ficiency and support a variety of aggregation queries, such as variance and quantile aggregations. Unlike count queries, such aggregation queries incorporate the inherent data dis-tribution to provide more flexibility for cohort formation. At a high-level, QDS stores multi-dimensional data (spatial, temporal, and categorical) in an array ordered by a nested sorting in each dimension. The ordering allows the construc-tion of a multi-level index that keeps, for each dimension, a list of intervals (called pivots) that delimit a consecutive region in the array. QDS is illustrated in Figure 2.
We implement count queries and on-the-fly aggregations (which are materialized only at the execution time to save memory) by query algorithms that operate directly on the pivot lists. To enable quantile queries, QDS augments each entry in the pivot lists with a compressed representation of a distribution function based on a non-parametric distribu-tion modeling technique called t-digest [5]. We store such representation as a payload of numeric dimensions, which also support on-the-fly aggregations and merging of distri-bution functions. QDS supports the selection of predicates for cohort formation. On-the-fly aggregations build a data view which constitutes a cohort. Hence cohorts are directly indexed in QDS.
In COVIZ, aggregated values of cohorts are not limited to averages but distributions within different quantiles. For
instance, instead of indexing a single average value of BMI marker for the cohort of females under AERO treatment in Grenoble, QDS stores its quantiles. As a result, all aggrega-tions can be computed on-the-fly, such as average, quantile, max, and min. Our experiments in [4] shows that spatial extensions of PostgreSQL, SQLite, and MonetDB fail to ren-der an interactive performance for filtering and combining spatial, temporal, and categorical dimensions. QDS renders all kinds of filters with an average delay of 40ms, enabling exploratory cohort formation.
2.3
Cohort exploration
Once a cohort is formed, the medical expert expects to examine “what happened to its members” by exploring the cohort. This question relates to finding and conveying the health trajectory of a cohort in a human-understandable way. The cohort trajectory helps medical experts to gener-ate hypotheses on the health evolution of the cohort’s mem-bers. Obtaining a readable and succinct trajectory is chal-lenging because cohorts often consist of hundreds of patients whose medical events are of various types and occur at dif-ferent points in time. An ideal health trajectory should de-scribe an end-to-end storyline for the cohort and be limited to what matters the most in the cohort. In [11], we devel-oped an algorithm which iterates over all pairs of patients in the cohort to verify if there is a common match between their health trajectories. Given the sequential nature of medical events, matches are identified using Needleman-Wunsch se-quence matching algorithm. Highly frequent events will then be reported in the cohort trajectory. Moreover, cohorts can be compared using their trajectories. For instance, com-paring the cohorts of patients in urban and rural regions of France reveals similarities and differences between their health evolution. In a user study, we asked our medical ex-perts to evaluate the representativity, usefulness, and nov-elty of cohort exploration, and we obtained average scores of 4.03, 4.67, and 4.35, respectively [11].
3.
INTERFACE
We present different features of the COVIZ interface using a visualization-driven scenario (see Figure 3). We consider a medical expert who is interested to obtain insights by visual inspection of the health-care data. Typically, she needs first to acquire an overall understanding of the data. Then she seeks to form interesting cohorts and explore them. Last, she seeks to make sense of her observations by leveraging the pollution data.
Observing the big picture. QDS enables an immediate materialization of the big picture to depict general trends in the health-care data. This helps experts make more in-formed decisions when forming cohorts. Figure 3-A visual-izes this big picture for 41, 740 patients and 674, 632 of their events. One can easily notice that the geographical distribu-tion of the data is biased towards the Auvergne-Rhˆone-Alpes region, where the headquarters of our medical partner are lo-cated. A mouse-hover on this region reveals that it contains 31, 084 patients. Beyond the big picture, COVIZ provides histograms to examine distributions of different dimensions of patients’ health. Figure 3-B shows that while 90% of pa-tients are male in all of France, 80% of the sub-population in the region of Centre-Val de Loire is female. Histograms in COVIZ are inter-connected, i.e., a filter on one histogram updates all other statistics instantaneously.
Cohort formation. Visual filters can be used to form a cohort, e.g., “females under AERO treatment in Grenoble” (Figure 3-C). This example cohort contains 104 patients with 336 events. The system will then show a series of statistics for the selected cohort in an efficient manner. For instance, we observe in Figure 3-C that the higher values of the fatigue marker in the cohort relates to death. We also observe that the progression of the sleepiness marker decreased until late 2015 and then it increased again. Cohort exploration. Experts can examine the health evo-lution of cohort’s members using cohort trajectories. Fig-ure 3-D shows the cohort trajectory of females under AERO treatment in Grenoble (the x-axis is the timeline). The tra-jectory shows that the cohort’s members started their treat-ment with AERO and OXY. Then they had a series of OXY treatments in four consecutive months. Additionally, multi-ple cohorts can be formed and compared visually. Figure 3-D right shows the cohort trajectory of males under AERO treatment in Grenoble. We observe that both female and male cohorts received AERO right after their admission to the hospital.
Sensemaking with pollution data. COVIZ uses another instance of QDS for pollution data to enable an interac-tive exploration of that data over different regions and in different granularities. In Figure 3-E top, we set the time window (i.e., filtering the temporal dimension) to 2010-2011 and we immediately observe that the north-eastern region of France (r´egion Grand-Est), was highly polluted during that time (with the NO2 pollutant). However, we can also observe that this effect is temporary, as is shown in Figure 3-E bottom, where the volume of NO2 is noticeably lower in the period of 2011-2012. Pollution data can also be used to interpret some observations in the health data. For in-stance, Figure 3-F top shows that the variance of the sleepi-ness marker in the province of Vienne (south-east of France) is higher than usual in the year 2010. Figure 3-F bottom shows the pollution data layer on the same region and shows that Vienne was highly polluted then, potentially justifying heterogeneous values of the sleepiness marker. This process identifies a novel hypothesis (e.g. impact of air pollution on sleepiness) that is worth a future in-depth investigation.
4.
DEMONSTRATION SCENARIOS
We describe two scenarios that the demo attendees can perform on COVIZ during the demo session.
Ecological scenario. In ecological studies, the unit of ob-servation is a cohort and the aim is to analyze the collective behavior of cohort’s members. Measurements such as dis-ease rates and exposures are taken for a series of cohorts and then their relation is examined [2]. A common practice is to compare a pair of cohorts which differ only in one di-mension, referred to as contrast cohorts [15]. This enables medical experts to focus on that dimension and ignore the effect of confounding factors. Demo attendees will be able to test this feature and generate hypotheses on differences be-tween cohorts. For instance, they can verify the adoption of a specific treatment, e.g., OXY, for different genders. They form cohorts of males and females and filter treatments to keep only OXY. Then they can verify the distribution and variability of different markers for those two cohorts using different aggregation modes (average, variance, quantile). They can also compare their trajectories to check if there is
a significant difference between the times when the two co-horts received a treatment. Moreover, they can check other treatments which are administered by one cohort but not the other. These observations will enable them to generate hypotheses on the difference in treatment administration for contrast cohorts of interest.
Case cross-over scenario. In environmental epidemiol-ogy, a cohort is often compared with its past (usually 2 to 5 previous days) to determine its health evolution, called case cross-over study [8]. Demo attendees can form their cohort and investigate its health trajectory in different time windows. For each time window, they can also verify the amount of air pollution for different pollutants. Attendees will be able to generate hypotheses on the relationship be-tween pollution and the health evolution of their cohort.
5.
REFERENCES
[1] S. Amer-Yahia, B. Omidvar-Tehrani, J. Comba, V. Moreira, and F. C. Zegarra. Exploration of user groups in vexus. ICDE demo, 2018.
[2] D. Coggon, D. Barker, and G. Rose. Epidemiology for the uninitiated. BMJ Books, London, 5 edition, 2003. [3] A. Crotty, A. Galakatos, E. Zgraggen, C. Binnig, and
T. Kraska. Vizdom: interactive analytics through pen and touch. VLDB, 8(12):2024–2027, 2015.
[4] C. A. de Lara Pahins, S. A. Stephens, C. Scheidegger, and J. L. D. Comba. Hashedcubes: Simple, low memory, real-time visual exploration of big data. TVCG, 2017.
[5] T. Dunning and O. Ertl. Computing Extremely Accurate Quantiles Using t-Digests.
https://github.com/tdunning/t-digest. Accessed: 2018-07-18. [6] M. B. et. al. Chronic effects of air pollution on lung function
after lung transplantation in the systems prediction of chronic lung allograft dysfunction (sysclad) study. European
Respiratory Journal, 2016.
[7] J.-D. Fekete and R. Primet. Progressive analytics: A computation paradigm for exploratory data analysis. arXiv preprint arXiv:1607.05162, 2016.
[8] K. Y. Fung, D. Krewski, Y. Chen, R. Burnett, and S. Cakmak. Comparison of time series and case-crossover analyses of air pollution and hospital admission data. International journal of epidemiology, 2003.
[9] A. Gani, A. Siddiqa, S. Shamshirband, and F. Hanum. A survey on indexing techniques for big data: taxonomy and performance evaluation. Knowledge and information systems, 46(2):241–284, 2016.
[10] A. Munshi, V. Sharma, and S. Sharma. Lessons learned from cohort studies, and hospital-based studies and their
implications in precision medicine. In Progress and Challenges in Precision Medicine. Elsevier, 2017.
[11] B. Omidvar-Tehrani, S. Amer-Yahia, and L. Lakshmanan. Cohort representation and exploration. In DSAA. IEEE, 2018. [12] C. A. L. Pahins, N. Ferreira, and J. L. D. Comba. Real-time
exploration of large spatiotemporal datasets based on order statistics. TVCG, 2019.
[13] T. Siddiqui, A. Kim, J. Lee, K. Karahalios, and
A. Parameswaran. Effortless data exploration with zenvisage: an expressive and interactive visual analytics system. VLDB, 10(4):457–468, 2016.
[14] M. Vartak, S. Rahman, S. Madden, A. Parameswaran, and N. Polyzotis. Seedb: efficient data-driven visualization recommendations to support visual analytics. VLDB, 8(13):2182–2193, 2015.
[15] E. Von Elm, D. G. Altman, M. Egger, S. J. Pocock, P. C. Gøtzsche, J. P. Vandenbroucke, S. Initiative, et al. The strengthening the reporting of observational studies in epidemiology (strobe) statement: guidelines for reporting observational studies. PLoS medicine, 4(10):e296, 2007. [16] Z. Wang, N. Ferreira, Y. Wei, A. S. Bhaskar, and
C. Scheidegger. Gaussian Cubes: Real-Time Modeling for Visual Exploration of Large Multidimensional Datasets. TVCG, 2017.
[17] K. Wongsuphasawat, D. Moritz, A. Anand, J. Mackinlay, B. Howe, and J. Heer. Voyager: Exploratory analysis via faceted browsing of visualization recommendations. TVCG, 2016.