HAL Id: tel-02536191
https://hal.archives-ouvertes.fr/tel-02536191
Submitted on 9 Apr 2020HAL is a multi-disciplinary open access archive for the deposit and dissemination of sci-entific research documents, whether they are pub-lished or not. The documents may come from teaching and research institutions in France or abroad, or from public or private research centers.
L’archive ouverte pluridisciplinaire HAL, est destinée au dépôt et à la diffusion de documents scientifiques de niveau recherche, publiés ou non, émanant des établissements d’enseignement et de recherche français ou étrangers, des laboratoires publics ou privés.
Lambert Niyoyitungiye
To cite this version:
Lambert Niyoyitungiye. Limnological Study of Lake Tanganyika, Africa with Special Emphasis on Piscicultural Potentiality. Biodiversity and Ecology. Assam University Silchar (Inde), 2019. English. �tel-02536191�
“LIMNOLOGICAL STUDY OF LAKE
TANGANYIKA, AFRICA WITH SPECIAL
EMPHASIS ON PISCICULTURAL
POTENTIALITY”
A THESIS SUBMITTED TO ASSAM UNIVERSITY FOR
PARTIAL FULFILLMENT OF THE REQUIREMENT
FOR THE DEGREE OF DOCTOR OF PHILOSOPHY
IN LIFE SCIENCE AND BIOINFORMATICS
By
Lambert Niyoyitungiye
(Ph.D. Registration No.Ph.D/3038/2016)Department of Life Science and Bioinformatics
School of Life Sciences
Assam University
Silchar - 788011
India
Under the Supervision of Dr.Anirudha Giri
from Assam University, Silchar
&
Co-Supervision of Prof. Bhanu Prakash Mishra
from Mizoram University, Aizawl
i
Almighty and merciful God
&
My beloved parents with love
To
iv
vi
CONTENTS
Page Numbers CHAPTER-I INTRODUCTION ... 1-7
I.1 Background and Motivation of the Study ... 1
I.2 Objectives of the Study ... 7
CHAPTER-II REVIEW OF LITERATURE ... 8-46 II.1 Major African Lakes ... 8
II.1.1 Great Lakes ... 8
II.1.2 History of Geological formation of African lakes ... 10
II.2 Hydrographical Network of Burundi ... 11
II.2.1 Lake Tanganyika ... 13
II.2.1.1 Origin and evolution ... 13
II.2.1.2 Geographical Situation. ... 15
II.2.1.3 Watersheds of Lake Tanganyika... 18
II.2.1.4 Tributaries of Lake Tanganyika ... 20
II.2.1.4.1 Malagarazi River ... 20
II.2.1.4.2 Rusizi River ... 20
II.2.1.4.3 Other tributaries on Burundian coast ... 21
II.2.1.5 Climatic Conditions. ... 21
II.2.1.6 Biotope of Lake Tanganyika. ... 23
II.2.1.7 Biodiversity of Lake Tanganyika ... 24
II.2.1.7.1 General Considerations ... 24
II.2.1.7.2 Ichtyofauna of Lake Tanganyika ... 27
II.2.1.7.2.1 Cichlids Fish ... 27
II.2.1.7.2.2 Non-cichlids Fish ... 27
II.2.1.8 Fishing typology in Lake Tanganyika ... 27
II.2.1.8.1 Customary Fishing ... 29
II.2.1.8.2 Artisanal fishing ... 30
vii
II.2.1.9 Main threats of Lake Tanganyika ... 30
II.2.1.9.1 Pollution ... 30
II.2.1.9.1.1 General Considerations ... 30
II.2.1.9.1.2 Sedimentary Pollution ... 31
II.2.1.9.1.3 Urban and Industrial wastes ... 33
II.2.1.9.2 Overfishing and use of destructive gears ... 35
II.2.1.9.3 Increase of human population ... 36
II.2.1.9.4 Eutrophication ... 37
II.3 Brief overview on pisciculture concept ... 40
II.3.1 Definition and Background ... 40
II.3.2 Quality of water suitable for pisciculture ... 42
II.3.3 Standards of water quality required in fish culture ... 43
CHAPTER-III MATERIALS AND METHODS... 47-110 III.1 Study area description ... 47
III.1.1 Geographical situation ... 47
III.1.2 Climate ... 48
III.1.3 Morphology, geology and pedology ... 48
III.1.4 Hydrography ... 48
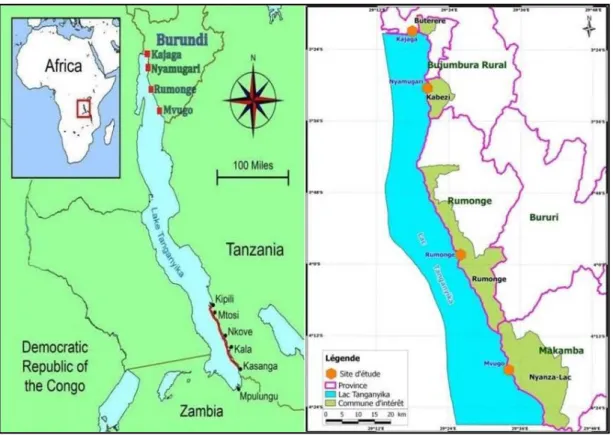
III.1.5 Description of the sampling stations ... 49
III.1.5.1 Kajaga site ... 50
III.1.5.2 Nyamugari site ... 50
III.1.5.3 Rumonge site ... 51
III.1.5.4 Mvugo site ... 52
III.2 Sampling, field data collection and Laboratory analysis ... 52
III.2.1 Physico-chemical analyses ... 52
III.2.1.1 Potential of Hydrogen ... 54
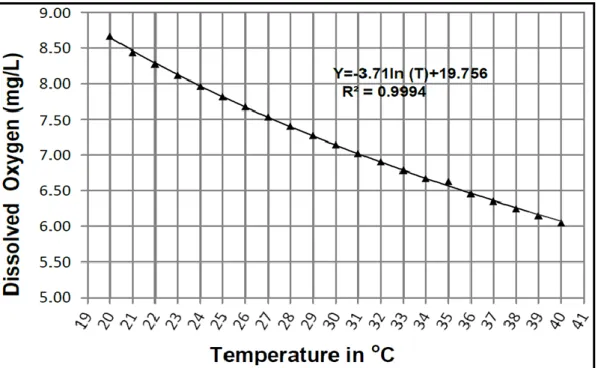
III.2.1.2 Temperature ... 55
III.2.1.3 Dissolved Oxygen and percent of Oxygen saturation ... 57
III.2.1.4 Electrical Conductivity... 58
viii
III.2.1.6 Turbidity ... 59
III.2.1.7 Chlorides Ions ... 60
III.2.1.8 Total Alkalinity ... 63
III.2.1.9 Total Hardness, Calcium hardness and Magnesium hardness ... 66
III.2.1.10 Chemical Oxygen Demand ... 69
III.2.1.11 Biochemical Oxygen Demand ... 72
III.2.1.12 Total Carbon, Total Organic Carbon and Total Nitrogen .... 76
III.2.1.13 Total Phosphorus ... 79
III.2.1.14 Heavy Metals ... 82
III.2.2 Biological analysis ... 88
III.2.2.1 Determination of Chlorophyll a ... 88
III.2.2.2 Bacteriological analysis ... 92
III.2.2.3 Sampling and taxonomic identification of fish species ... 95
III.2.2.4 Planktonic population analysis ... 97
III.2.2.5 Species biodiversity measurement ... 103
III.2.2.5.1 Alpha diversity ... 103
III.2.2.5.2 Beta diversity ... 107
III.3 Statistical Analysis ... 109
CHAPTER-IV EXPERIMENTAL FINDINGS ... 111-201 IV.1 Physico-chemical parameters ... 111
IV.1.1 Physical parameters ... 115
IV.1.2 Chemical parameters ... 118
IV.1.3 General considerations on correlation (r) between variables .. 131
IV.1.3.1 Pearson‟s correlation among physico-chemical variables ... ... 132
IV.1.3.2 Principal Components Analysis (PCA)... 135
IV.1.4 Effect of study stations on the variation of physico-chemical parameters ... 139
ix
IV.1.5.1 Trophic status ... 150
IV.1.5.2 Pollution status ... 156
IV.1.5.2.1 BOD and COD Status ... 157
IV.1.5.2.2 Use of Organic Pollution Index IPO and the Method of the Institute of Hygiene and Epidemiology. ... 159
IV.2 Biological characteristics ... 162
IV.2.1 Chlorophyll-a ... 163
IV.2.2 Bacteriological Characteristics ... 164
IV.2.3 Planktonic population analysis ... 166
IV.2.3.1 Phytoplanktons analysis ... 167
IV.2.3.2 Zooplanktons analysis ... 171
IV.2.3.3 Correspondence Factor Analysis ... 174
IV.2.3.4 Planktons in aquatic food chain ... 176
IV.2.3.5 Effect of physico-chemical attributes of water on the abundance of Planktonics communities. ... 177
IV.2.3.6 Planktonic species diversity analysis ... 180
IV.2.3.6.1 Alpha diversity study ... 180
IV.2.3.6.2 Beta diversity study ... 184
IV.2.4 Fish diversity in relation to pollution ... 186
IV.2.4.1 Taxonomic diversity of fish species in sampling stations .. 186
IV.2.4.2 Interaction between sampling stations, physico-chemical and biological parameters. ... 193
IV.2.4.2.1 Effect of change in physico-chemical and biological attributes of water on the abundance of fish species. ... 193
IV.2.4.2.2 Effect of pollutants on fish diversity, distribution and identification of pollution indicator fish. ... 195
IV.2.4.2.3 Similarity between fish species richness of sampling stations………198
IV.2.4.2.4 Effect of the sampling sites on the abundance of fish species……….……..…..……….200
x CHAPTER-V DISCUSSION ... 202-230 V.1 Physico-chemistry of waters ... 202 V.2 Biological community ... 222 V.2.1 Algal biomass ... 222 V.2.2 Bacterial community ... 223 V.2.3 Zooplanktons Population ... 225 V.2.4 Phytoplanktons Population ... 228
FINDINGS SUMMARY AND RECOMMENDATIONS……...…...231-239 BIBLIOGRAPHY...240-267 PUBLICATIONS...268-272 CONFERENCES ATTENDED...273-274 ANNEXURES...I-XXXI
xi
LIST OF TABLES
Page Numbers
Table 1: Major events of geological changes in Great Lakes Region. ... 10
Table 2: Burundian Lakes and their geographical locations. ... 13
Table 3: Physiographic statistics of Lake Tanganyika ... 16
Table 4: Distribution of the Waters of Lake Tanganyika per country ... 18
Table 5: Biodiversity components of Lake Tanganyika ... 26
Table 6: Fishing beaches of Lake Tanganyika on Burundian shoreline .... 28
Table 7: Pollution sources in Lake Tanganyika catchment ... 31
Table 8: Water quality required in pisciculture ... 43
Table 9 : Geographical location of the study sites. ... 50
Table 10: Analytical methods adopted to determine quality of lake water.53 Table 11: Influence of temperature on dissolved oxygen ... 55
Table 12: Maximum concentration of dissolved oxygen according to temperature ... 58
Table 13: Potential Matrix Modifiers for Graphite furnace AAS. ... 88
Table 14: Spatio-temporal variation in physical and chemical characteristics of water. ... 112
Table 15: Descriptive statistics of physico-chemical parameters and water quality required for pisciculture. ... 113
Table 16 : Average results of physico-chemical parameters in comparison to the Standards of water quality required for pisciculture. ... 114
Table 17: Desirable range of heavy metals dose recommended for pisciculture ... 129
Table 18: Strength of relationship between variables ... 131
Table 19: Correlation Coefficient (r) among physical and chemical parameters of Lake Tanganyika. ... 132
xii
Table 20: One-way ANOVA to assess the effect of the sampling sites on
the variation of physico-chemical variables. ... 140
Table 21 : Tukey's HSD multiple comparison test for the differences of pairwise averages values of the physico-chemical variables among the sampling stations ... 144
Table 22: Tukey's HSD showing Homogeneous subsets of the average values of the physico-chemical variables at sampling Stations ... 148
Table 23 : Carlson‟s trophic state index values for lakes classification in comparison with results obtained for Lake Tanganyika. ... 152
Table 24: Limit values for the trophic status of water according to international classification systems. ... 153
Table 25: Trophic status of the sampled sites water of Lake Tanganyika in comparison to international classification systems. ... 154
Table 26 :Trophic status of Lake Tanganyika. ... 154
Table 27: Pollution status of the sampled stations ... 159
Table 28: Limit classes of parameters used for IPO calculation... 160
Table 29: Limit Classes of used Parameters for IHE Calculation. ... 160
Table 30: Organic pollution status of the water at the sampling stations. 161 Table 31: Biological characteristics in comparison to the International Standards of water quality suitable for fish culture. ... 163
Table 32: Qualitative and quantitative results of phytoplankton population .. . ... 169
Table 33: Qualitative and quantitative results of zooplanktons population. ... ... 172
Table 34: Planktonic species diversity indices ... 181
Table 35: Correlation between zooplankton diversity indices ... 183
Table 36: Correlation between phytoplankton diversity indices... 183
Table 37: Jaccard‟s Similarity Index of Plankton species among sampling stations ... 185
xiii
Table 38: Sorensen‟s Similarity Index of Plankton Species among sampling
stations ... 186
Table 39: Fish species diversity at sampling sites ... 189 Table 40: Correlation between fish species abundance and
physico-chemical variables and planktons abundance. ... 193
Table 41: Identification and distribution of fish species based on
acclimation level to pollution. ... 196
Table 42: Pollution status of the sampling stations and Fish acclimation
level to pollution ... 197
Table 43: Similarity coefficient between fish species composition at
sampling stations ... 198
Table 44: ANOVA-I showing the effect of sampling sites on fish species
number ... 201
Table 45 : Tukey's HSD multiple comparison test for the differences of
pairwise averages amount of fish species among the sampling stations ... 201
Table 46: Tukey's HSD showing Homogeneous subsets of averages at
xiv
LIST OF FIGURES
Page Numbers
Figure 1: Map showing the African Great Lakes region ... 9
Figure 2: Map showing the hydrographical network of Burundi ... 12
Figure 3: Geographical situation of Lake Tanganyika ... 17
Figure 4: Map representing the watershed of Lake Tanganyika ... 19
Figure 5: Graphic representation of the thermal stratification of Lakes ... 22
Figure 6: Categories of life zones in lakes ... 24
Figure 7: Photo showing the lake sedimentary pollution further to rainy erosion ... 32
Figure 8: Sewage flowing into Lake Tanganyika from AFRITAN Company. ... 34
Figure 9: Algal blooms with green colour of Lake Tanganyika water ... 39
Figure 10: Encroachment by Eichhornia crassipes (water hyacinth) on the shores of Lake Tanganyika, in kibenga quarter. ... 39
Figure 11: Maps showing the study areas and sampling stations location ... .49
Figure 12: Measuring of physico-chemical parameters in the laboratory .. 54
Figure 13: Measuring of Temperature, pH, Electrical conductivity and Transparency on-spot ... 54
Figure 14: Evolution of dissolved oxygen as a function of temperature at 960 mbar according to Benson and Krause (1984). ... 56
Figure 15 :Graph illustrating TC calibration curve obtained with TOC-L/ASI-L ... 77
Figure 16: Graph illustrating TN calibration curve obtained with TOC-L/ASI-L ... 78
Figure 17: Graph illustrating TOC calibration curve obtained with TOC-L / ASI-L ... 78
xv
Figure 19: Basic components of a Graphite Furnace AAS ... 85
Figure 20: Microorganisms counting process ... 95
Figure 21: Group interview with local fishermen at Kajaga station.The big fish caught is named dinotopterus tanganicus (Isinga). ... 96
Figure 22: Planktons collection by filtering through a cloth net ... 97
Figure 23: Sedgwick-Rafter counting cell ... 102
Figure 24: Lackey‟s drop method Cell ... 102
Figure 25: Observation of Plankton cells under light microscope, OLYMPUS BX60. ... 102
Figure 26 : Spatio-temporal variation of Turbidity (A), Temperature (B), Transparency(C) and Total Dissolved Solids (D). ... 117
Figure 27 : Spatio-temporal variation of Oxygen Percent Saturation (A), Chemical Oxygen Demand (B) and Biochemical Oxygen Demand(C) ... 126
Figure 28: Spatio-temporal variation of pH (A), Total Alkalinity (B), Electrical Conductivity (C), Chloride (D), Total Hardness (E) and Calcium (F). ... 127
Figure 29 : Spatio-temporal variation of Magnesium (A), Iron (B), Total Carbon (C), Total Nitrogen (D), Total Phosphorus (E) and Dissolved Oxygen (F). ... 128
Figure 30: Spatio-temporal fluctuation of heavy metals concentration ... ... 130
Figure 31: Strength of relationship between variables ... 131
Figure 32: PCA Graph of Sampling sites observations ... 136
Figure 33: PCA Circle of correlations between physico-Chemical parameters ... 137
Figure 34: PCA biplot showing relation between sampling sites and Physico-chemical parameters. ... 138
Figure 35: Proliferation of aquatic plants in Lake Tanganyika, indicator of eutrophication. ... 155
xvi
Figure 37: Spatio-temporal variation of Chlorophyll-a content ... 164
Figure 38: Spatial variation of coliforms bacteria amount ... 166
Figure 39: Relative diversity index of phytoplankton families (A), species richness & Cumulative abundance of phytoplankton individuals (B), density of phytoplankton species (C) and individuals (D) by station and family ... 168
Figure 40: Relative diversity index of zooplankton families (A), species richness & Cumulative abundance of zooplankton individuals (B), density of zooplankton species (C) and individuals (D) by station and family. ... 173
Figure 41: CFA plot showing linkages between: (A) Sampling sites and phytoplanktons species; (B) Sampling sites and phytoplanktons families; (C) Sampling sites and zooplanktons species ;(D)Sampling sites and zooplanktons families. ... 175
Figure 42: Total abundance of plankton species at the sampling sites ... ... 177
Figure 43: Canonical Correlation Analysis (CCorA) bi-plot showing relationship between the environmental parameters and phytoplankton composition at sampling sites. ... 178
Figure 44: Canonical Correlation Analysis biplot showing relationship between the environmental parameters and zooplankton composition at sampling sites ... 179
Figure 45: Relative diversity index of families ... 188
Figure 46: Fish species distribution per orders ... 188
Figure 47: Species richness per sampling sites. ... 189
Figure 48: The fish species representing each family and order. ... 192
Figure 49: Diagrams showing different groups of Coliform bacteria ... 223
xvii ACRONYMS AND ABBREVIATIONS
°C : Degree Celsius
AAS : Atomic Absorption Spectrophotometry AFNOR : Association Française de Normalisation AFRITAN : African Tannery Company-
ANOVA-1 : One-way ANalysis Of Variance APHA : American Public Health Association
ASTM : American Society for Testing and Materials or American
Standards for Testing of Materials
BIS : Bureau of Indian Standards BOD : Biochemical Oxygen Demand BPW : Buffered Peptone water
CCorA : Canonical Correlation Analysis CFA : Correspondence Factor Analysis CFU : Colony Forming Units
Chl.a : Chlorophyll a
COD : Chemical Oxygen Demand CPUE : Catch per Unit Effort
CVRB : Comité de Valorisation de la Rivière Beauport DC : District of Columbia (Washington)
Defra : Department for Environment Food and Rural Affairs DO : Dissolved Oxygen
DRC : Democratic Republic of Congo EC : Electrical Conductivity
EDTA : Ethylene diamine tetra acetic acid
FAAS : Flame Atomic Absorption Spectroscopy FAO : Food and Agricultural Organisation
GFAAS : Graphite Furnace Atomic Absorption Spectrometry GFF : Glass Fiber Filters
HP : Horsepower
xviii
IBGE : Institut Bruxellois pour la Gestion de l'Environnement ICAR : Indian Council for Agricultural Research
IHE : Institut d‟Hygiène et d‟Epidémiologie IHE : Institute of Hygiene and Epidemiology IPO : Organic pollution index
ISI : Indian Statistical Institute
ISSN : International Standard Serial Number MBAS : Methylene Blue Active Substances
MDDEP : Ministère du Développement durable, de l'Environnement et
des Parcs
MDTEE : Ministère en charge du Développement Territorial, de l'Eau
et de l'Environnement
MINATTE : Ministère de l‟Aménagement du Territoire du Tourisme et de
l‟Environnement
NA : Not Applicable
NAS : National Academy of Science NEH : North Eastern Hill
NIST : National Institute of Standards and Technology (a unit of the
U.S. Commerce Department formerly known as the National Bureau of Standards)
NO.L-1 : Number of Organisms per Liter
NR : Not Recommended
NRAC : Northeastern Regional Aquaculture Center NTU : Nephelometric Turbidity Unit
OD : Optical Density
OECD : Organization for Economic Cooperation and Development OPI : Organic Pollution Index
p : p-value: Probability
PA : Phenolphthalein Alkalinity PCA : Plate Count Agar
PCA : Principal Component Analysis
PCRWR : Pakistan Council of Research in Water Resources pH : Potential of Hydrogen
xix Ppb : parts per billion
ppm : parts per million
RDC : Democratic Republic of Congo RN : Route Nationale
RSC : Residual Sodium Carbonate SAR : Sodium Adsorption Ratio SD : Standard Deviation SDD : Secchi disc depth
SPSS : Statistical Package for the Social Sciences SRAC : Southern Regional Aquaculture Centre SRS : Sum of Residues Squares
TA : Total alkalinity
TANESCO : Tanzania Electric Supply Company TC : Total Carbon
TDS : Total Dissolved Solids TN : Total Nitrogen
TOC : Total Organic Carbon TP : Total Phosphorus TSI : Trophic Status Indices TSS : Total Suspended solids U.S : United States
UNDP : United Nations Development Program
UNECE : United Nations Economic Commission for Europe USDA : United States Department of Agriculture
USEPA : United States Environmental Protection Agency USGA : United States Golf Association
US-NGA : United States National Geospatial-Intelligence Agency USRSL : United States Regional Salinity Laboratory
WHO : World Health Organization WWF : World Wide Fund
xx
Abstract
The water of Lake Tanganyika is subject to changes in physicochemical characteristics resulting in the deterioration of water quality to a great pace. The present investigation was carried out on Lake Tanganyika at 4 sampling sites and aimed to assess the water quality with reference to (i) its suitability for fish culture purposes, (ii) determining the trophic and pollution status of the sampled stations, (iii) assessing the qualitative and quantitative pattern of planktons diversity as fish food, (iv) establishing an inventory and taxonomic characterization of fish species diversity and (v) highlighting the effect of pollutants on the abundance and spatial distribution of fish species.
The physico-chemical and biological parameters of water samples were compared to desirable and acceptable international standards for fish culture and the results of comparative analysis indicated that the Lake has a high fish potential as the most important of the water quality parameters were suitable for fish culture. The investigation revealed the occurrence of 75 species belonging to 7different orders and 12 families in all sampling sites and among the different species recorded, those belonging to the order Perciformes and the family Cichlidae were most dominant.
The values of transparency, chlorophyll a and total phosphorus were indicative of eutrophication phenomenon. Besides, Kajaga and Nyamugari stations were found heavily polluted while Rumonge and Mvugo Stations were moderately polluted and for this purpose, three categories of fish species have been distinguished, depending on their adaptation level to pollution: polluosensitive species, polluotolerant species and polluoresistant species.
With respect to planktons community results, it was found that all the values obtained were within the permissible limits recommended in pisciculture and, the abundance and diversity of phytoplankton species were far greater than those of zooplankton species with 115species belonging to 7differet families for phytoplanktons against 10species belonging to 4families for zooplankton population in all sampling stations.
1
CHAPTER-I
INTRODUCTION
I.1 Background and Motivation of the Study
Life thrives in water and it is not surprising that the first life originated in
water where water was the principal external as well as internal medium for
the organisms. 71% of the earth is covered by water of which more than
95% is in gigantic oceans. The smallest amount of water is found in rivers
(0.00015%) and lakes (0.01%) and includes the most valuable freshwater
resources (Ramachandra et al., 2006). An aquatic ecosystem includes all
lotic systems such as rivers and streams and lentic systems like oceans,
lakes, bays, swamps, marshes and ponds along with the biota in them.
Aquatic habitats provide the entire gamut of services essential for
sustenance of life in it. Aquatic biodiversity is the rich and diverse spinning
through all the trophic levels from primary producer algae to tertiary
consumers large fishes. Aquatic food webs are complex with intermediaries
like zooplankton, small and medium fishes, aquatic insects and amphibians
among the most noted ones. In addition, a limited but diverse group of
aquatic plants do play important role in the functioning of the aquatic
ecosystems.
The quality and diversity of aquatic life forms depend upon the
physico-chemical characteristics of the water such as temperature, salinity,
oxygenation, flow velocity, light penetration, nature and abundance of
nutrients, and last but not the least, the quantity and sustenance of water.
2
environment quality. The indicators used are species abundance,
population density, age and size distribution and/or species composition.
The diversity of aquatic environments therefore offers a great diversity of
habitats which influences the biodiversity of these environments.
Aquatic ecosystems provide a variety of goods and services to
humans, giving them an irreplaceable economic value (Gleick,1993;
Costanza et al., 1997). Continental waters, as a source of livelihood, attract
dense colonization of human habitats around. Therefore, these habitats
require strict management practices to ensure their sustainability. Contrary
to this fact, the aquatic resources, particularly the freshwater ecosystems
across the world are facing serious pollution problems due to various
anthropogenic activities. The indiscriminate disposal of waste effluents,
population growth, the rise of industrialization and increasing use of
fertilizers and phytosanitary products in agriculture are among the major
causes of pollution of water reservoirs (Singh et al., 2004, Vega et al.,
1996, Sillanappa et al., 2004).
Among the fresh water resources, the lentic systems are most
vulnerable to anthropogenic activities as they act as sinks for sewage and
waste disposal while the lotic systems such as streams and rivers act as
drains for the removal of waste to the sea. Human economic activities are
undoubtedly the single most important cause of stress in aquatic
ecosystems (Vazquez and Favila, 1998; Dokulil et al., 2000; Tazi et al.,
2001). The distribution of organisms colonizing aquatic environments, as a
3
al., 1999), and anthropogenic disturbances have very strong repercussion
on aquatic biodiversity (Sweeney et al., 2004). The changes in
communities may be directly related to the introduction or disappearance of
species caused directly or indirectly by human activities (Malmqvist and
Rundle, 2002; Bollache et al., 2004). These activities, particularly in
developing countries, have caused the pollution of surface waters. The
degradation of aquatic environments adversely changing the physiology
and ecology of aquatic biota (Khanna and Ishaq, 2013), threaten the
balance in aquatic ecosystems (Noukeu et al., 2016). Freshwater fish are
one of the most threatened taxonomic groups (Darwall and Vie, 2005)
because of their high sensitivity to the quantitative and qualitative alteration
of their habitats (Laffaille et al., 2005; Kang et al., 2009; Sarkar et al.,
2008). It has been realized that anthropogenic activities have driven many
fish species to be endangered, reduced in abundance and diversity; and
more so, many species have become extinct (Pompeu and Alves,2003;
Pompeu and Alves,2005; Shukla and Singh, 2013; Mohite and
Samant,2013; Joshi, 2014).
Apart from anthropogenic activities, environmental factors also affect
the freshwater quality. Indeed, extensive evaporation of water from the
reservoir due to high temperature and low rain enhances the amount of
salts, heavy metals and other pollutants, which are conscientious factor for
the poor quality of the reservoir ecosystem (Arain et al., 2008). Among
environmental pollutants, metals are of particular concern, due to to their
4
(Miller et al., 2002). The major ions such as Ca2+, Mg2+, Na+, K+, Cl-, HCO3
-and CO3
2-are essential constituents of water and responsible for ionic
salinity as compared with other ions (Wetzel, 1983). As the healthy aquatic
ecosystem is depending on the physico-chemical and biological
characteristics (Venkatesharaju et al 2010), the water quality assessment is
essential to identify the magnitude and source of any pollution load. This
can provide significant information about the available resources for
supporting life in a given ecosystem. Therefore, water quality monitoring is
of immense importance for conservation of water resources for fisheries,
water supply and other activities. This involves analysis of
physico-chemical, biological and microbiological parameters of the water bodies.
The study of the various geological, physicochemical and biological
aspects of these water bodies comes under the scope of limnology. The term "Limnology"originates from Greek λίμνη = limne (lake) and λόγος = logos (study). Limnology is thus the science of continental waters (Dussart
B., 2004) (freshwaters or saltwaters, stagnating or moving waters, rivers,
wetlands, etc.) and was originally defined as oceanography of lakes and
sometimes incorrectly as the ecology of fresh waters. Francois-Alphonse
Forel (1841-1912) was the precursor to define limnology in its study on
Lake Leman. It is subdivided into physical limnology (temperature,
transparency, color, pH, turbidity, Total Dissolved Solids, etc.), chemical
limnology (Chemical Oxygen Demand, Dissolved Oxygen, Biochemical
5
(zooplankton, phytoplankton and bacterial population). Ramsar Convention
uses limnology to define and to characterize the wetlands which have an
international importance (Kar, 2007 & 2013). However, Limnology involves
a great deal of detailed field as well as laboratory studies to understand the
structural and functional aspects and problems associated with the aquatic
environment from a holistic point of view.
The current limnological study was carried out on Lake Tanganyika
at selected stations belonging to Burundian coast. Indeed, many decisions
in favor of Lake Tanganyika future have been taken at the time of the first
International Conference on Conservation and Biodiversity of Lake
Tanganyika, held in Burundi-Bujumbura in 1991, where regional and
international scientists were present to discuss about the wealth and
increasing threats of Lake Tanganyika (Cohen, 1991). Despite all these
initiatives, the lake is still subject to frequent fluctuations in the chemistry of
its water and to desiccation (Wetzel, 2001) due to sudden changes in
weather conditions. It is facing a serious pollution problem from various
sources, such as discharge of domestic sewage, population growth, rise of
industrialization, use of pesticides and chemical fertilizers in agriculture,
sedimentation and erosion resulting from deforestation. So, the surface
waters of Lake Tanganyika are highly polluted by different harmful
contaminants from human activities in large cities established on its
catchment areas. In the present study, water quality assessment with
reference to its eligibility for fish culture will be reviewed for raising
6
quality factors impacting on health of the water body and that are required
in optimum values to increase the fish yields to meet the growing demands
of a growing population across the four neighbouring countries when the
food resources are in depletion conditions. Furthermore, the assessment of
the current status of fish community structure in Lake Tanganyika and the
impact of the physico-chemical characteristics of water on the abundance,
diversity, spatial distribution, richness, trophic ecology of the fish species
will also be highlighted. The assessment of the water quality of Lake
Tanganyika will also help the government of the riparian countries to take
the measures for protecting the lake against the conditions that can
7 I.2 Objectives of the Study
The global objective of the present study is to assess the limnological
parameters (physical, chemical and biological characteristics) of Lake
Tanganyika at selected stations, with reference to its suitability for
pisciculture purposes. In concomitant to this, the specific objectives of the
study include:
1. To assess the water quality of Lake Tanganyika in comparison to the recommended Standards for water quality suitable for pisciculture.
2. To determine the trophic and pollution status of the waters at selected sampling sites
3. To assess the qualitative and quantitative structure of planktons diversity as fish food in Lake Tanganyika.
4. To establish an inventory and taxonomic characterization of all fish species found in the sampling sites.
5. To determine the influence of physico-chemical parameters (effect of pollutants) on the abundance and spatial distribution of fish species in the lake and hence, to identify the pollution indicator fish.
8
CHAPTER-II
REVIEW OF LITERATURE
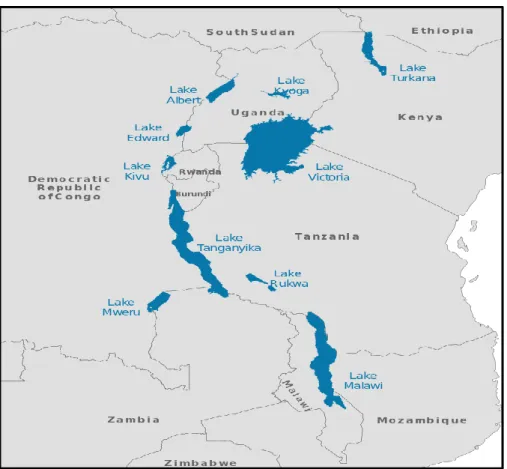
II.1 Major African Lakes II.1.1 Great Lakes
The African Great Lakes form a series of lakes constituting the part of the Rift
Valley lakes in and around the East African Rift. From north to south, the
Great Lakes of Africa are: Turkana, Albert, Edward, Victoria, Kivu,
Tanganyika, Rukwa, Mweru and Malawi. Lake Kyoga is part of the Great
Lakes network, but is not considered as great lake, because of its size.The
Rift fissure separated the African continent into two blocs: The African
block at the West and the Somalian block to the East. The lakes Turkana,
Albert, Edward, Kivu, Tanganyika, Rukwa and Malawi are the markings of
this fissure oriented from North West to the South East (Fermon, 2007).
Most of Africa's main lakes lie along a continental fault line called the East
African Rift Valley, which crosses the southeastern part of the continent,
creating both spectacular mountains like Kilimanjaro and a system of deep
lakes collectively called the Great Lakes of Africa. While not quite as large
as the North American Great Lakes system, the system nonetheless looms
significant in both the physical and economic geography of the continent
and that's not to mention its physical beauty and stature (Fermon, 2007).
Lake Albert, Lake Victoria and Lake Edward flow into the White Nile. Lake
Tanganyika and Lake Kivu both flow into the Congo River system, Lake
9
has no outlet. The Great lakes region is formed by five countries which are
the Democratic Republic of the Congo (D.R.C.), Burundi, Rwanda, Republic
of the Congo (Congo-Brazzaville) and Uganda. The African Great Lake
region is used in a narrow sense for the area lying between the north of Lake
Tanganyika, west of Lake Victoria, and lakes Kivu, Edward, and Albert
(Fermon, 2007). This area includes Burundi, Rwanda, the north-east of D.R.
Congo, Uganda and northwestern Kenya and Tanzania. It is used in a
broader sense to extend to all of Kenya and Tanzania, but not as far south
as Zambia, Malawi and Mozambique, or as far north as Ethiopia, although
these four countries are neighbors of Grand Lake (Fermon, 2007).
Figure 1: Map showing the African Great Lakes region
Source:https://upload.wikimedia.org/wikipedia/commons/thumb/1/17/Afric an_Great_Lakes.svg/220px-African_Great_Lakes.svg.png
10
II.1.2 History of Geological formation of African lakes
Twelve million years ago, a tectonic fracture occurred on the African
continent, giving rise to the Red Sea and large part of the lakes of East
Africa. From this fracture were born African lakes to the east, either by
filling in the gaps created (lakes Tanganyika and Malawi), or by filling pools
created by west and east cleft formations, as in the case of Lake Victoria.
These African lakes have lasted a long time, which is unusual in lacustrine
ecosystems. Although modern lakes have been formed by glaciation over
the last 12,000 years and have always been characterized by frequent
fluctuations in the chemical composition of water and desiccation (Wetzel,
1983), the African Great lakes have a long geological existence.
11 II.2 Hydrographical Network of Burundi
Burundi country is fed by a large network of rivers, marshes and lakes
occupying up to 10% of its surface area. The country's hydrographical
network is divided into two major river basins: the Nile basin with an area of
13,800 km² and the Congo River basin with an area of 14,034 km²
(Sinarinzi, 2005):
(i) The Congo basin consists of two sub-basins: (a) the sub-basin
located to the west of the Congo Nile ridge drained by Rusizi River
and its tributaries and by Lake Tanganyika, (b) the sub-basin
(ii) Kumoso located in the East of the country which is a tributary of
Maragarazi River and its tributaries. The waters of this basin are
collected by Lake Tanganyika and flow into Congo River through
Lukuga River, which is an overfall for Lake Tanganyika
(Nzigidahera, 2012).
(iii) The Nile Basin comprising of all the tributaries of Ruvubu and
Kanyaru Rivers that meet in the North-East of the Country forming
thus Kagera river which flows into Lake Victoria and then into the
Nile River. It should also be noted that Burundi is sheltering the
southernmost source of the Nile River, located in the south of the
country, precisely in Rutovu Commune, Bururi Province.
However, beside Lake Tanganyika, Burundi has a large number of natural
lakes to the north belonging to the Nile basin and located on the border of
12
and Constitute tourist curiosities, especially Lake Rwihinda named "Bird
Lake". Burundi has also artificial lakes for hydroelectric purposes. Among
all these lakes, only Lake Tanganyika is the subject of this study. The figure
2 shows the map illustrating the Burundi‟s hydrographical network while the
table 2 shows all the Lakes belonging to Burundian territory and their
geographical locations.
Figure 2: Map showing the hydrographical network of Burundi
13
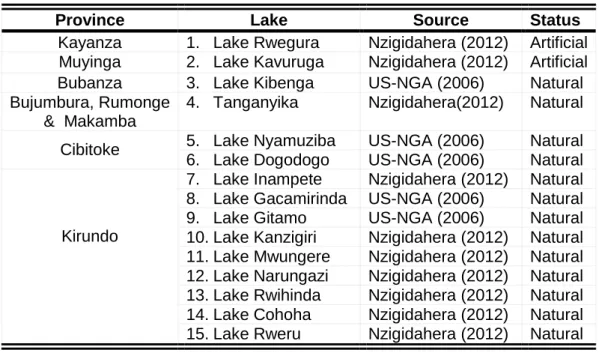
Table 2: Lakes belonging to Burundian territory and their geographical locations.
Province Lake Source Status
Kayanza 1. Lake Rwegura Nzigidahera (2012) Artificial Muyinga 2. Lake Kavuruga Nzigidahera (2012) Artificial Bubanza 3. Lake Kibenga US-NGA (2006) Natural Bujumbura, Rumonge
& Makamba
4. Tanganyika Nzigidahera(2012) Natural Cibitoke 5. Lake Nyamuziba US-NGA (2006) Natural 6. Lake Dogodogo US-NGA (2006) Natural
Kirundo
7. Lake Inampete Nzigidahera (2012) Natural 8. Lake Gacamirinda US-NGA (2006) Natural 9. Lake Gitamo US-NGA (2006) Natural 10. Lake Kanzigiri Nzigidahera (2012) Natural 11. Lake Mwungere Nzigidahera (2012) Natural 12. Lake Narungazi Nzigidahera (2012) Natural 13. Lake Rwihinda Nzigidahera (2012) Natural 14. Lake Cohoha Nzigidahera (2012) Natural 15. Lake Rweru Nzigidahera (2012) Natural
II.2.1 Lake Tanganyika II.2.1.1 Origin and evolution
Lake Tanganyika was formed about 12 million years ago and its history is
not definitively established. Richard And John Hanning Speke were the
first Europeans to discover the lake in 1858 and Burton who led the
expedition retains its original name, contrary to the practice in force at the
time.(Kar, 2013). It was in 1871, 10th November on the shores of Lake Tanganyika at Ujiji station that a historic meeting between David
Livingstone and Stanley took place. It was on this occasion that Stanley wrote the famous replica “Doctor Livingstone, i presume?‟‟ Lake Tanganyika has been formed since the Miocene 20 million years ago
(Coulter et al., 1991). Most of the modern lakes have been trained by
glaciation during the past 12,000 years and have experienced a history
14
The current version states that during the alpine folding, the African massif
was fractured and gave rise to the rift-valley which runs from the Red Sea
to the mouth of Zambezi (Nyakageni, 1985). Lake Tanganyika is the
longest, widest and oldest of the African Rift Lakes. According to Ntakimazi
(1992), the lake is estimated to be between 5 and 20 million years old and
for more than half that period; the lake was isolated from other
hydrographic networks. Based on sediment accumulation rates in the
basin, geologists estimate that Lake Tanganyika has existed about 12
million years (Scholz and Rosendahl, 1988; Cohen et al., 1993).
According to Brichard (1989), three successive phases seem to have
contributed to the evolution of Lake Tanganyika:
Phase I: During this phase, there would have been two lakes separated by a wall of 500 to 600 m in height;
Phase II: The two lakes would have merged and the depth would have increased up to 700m;
Phase III: The depth of the lake would have increased up to 900 m. At this time, Lake Tanganyika occupied a much larger area than today and
its northern shore was at least made up of volcanic barrages located in the
South of the current Lake Kivu. The collapse phenomena of the plain
bottom occurring at Pleistocene and climate changes were responsible for
the gradual shoreline exposure of most of the Rusizi plain. But the Rusizi
River itself is the result of events that took place much further in north.
Indeed, at a much later time, 8-12000 years, the eruption of the Virunga
15
drained the current basin of Lake Kivu to Lake Edward. The waters have
accumulated upstream of the created barrage forming the present Lake
Tanganyika. The increase of the level continued, the water excess ending
up overflowing to the south over an older volcanic barrage in Bukavu
Cyangugu region resulting in the formation of Ruzizi river.This evolution
has had significant consequences on the separation of species and this
story was reflected in the current biogeographical distribution of species.
Lake Tanganyika has two natural possibilities of water outflow: Evaporation
and Lukuga River emptying the water of the Lake to Congo River and is
powered by Rainfall, the waters from Lake Kivu via Ruzizi river, Malagarazi
river and others tributaries of its watershed.
II.2.1.2 Geographical Situation.
Located in the Lakes region of East Africa, Lake Tanganyika is housed in
the central part of Western graben, in south of Equator at 290 5' and 310 15'
of longitude East over a length ranging from 40 to 80 km and at 3°20' and
8°45' of latitude South over a length of 650 km (Moore, 1903). Lake
Tanganyika is surrounded by four countries sharing unequally 1,838km of
its entire perimeter (Hanek and al., 1993): Burundi in the North-East
controlling 159 km (9% of the coast), D R.C to the West with 795 km (43%
of the coast), Tanzania to the East and South-East with 669 km (36% of the
coast) and Zambia to the south with 215 km (12% of the coast). Seven
main towns and cities are established on the edge of Lake Tanganyika
16
.Bujumbura and Rumonge in Burundi, Kigoma in Tanzania and Mpulungu in Zambia. Lake Tanganyika is one of the largest lakes of Africa and
second biggest Lake Considering the area after Lake Victoria. It is also the
longest fresh water lake in the world and holds second position in terms of
volume and depth after Lake Baïkal (Wetzel, 1983 and Kar, 2013). In fact,
Lake Tanganyika has a volume of 18 900km3, covers an area of 34,000
km2 with a length of 677 km and a width of 72km and is spread on a
watershed of 231,000km2. Its altitude rises to 775m; its average depth
is 770m with a maximum of 1433m.
Table 3: Physiographic statistics of Lake Tanganyika (Coulter, 1994; Odada et al., 2004).
Physiographic characteristics Related Data
Riparian Counties Burundi, Congo,Tanzania
and Zambia
Altitude (surface) 773 m
Surface area 32,600 km2
Volume 18,880 km3
Maximum depth in southern basin 1 320 m Maximum depth in Northern basin 1,470 m
Average depth 570 m
Residence time 440 years
Drainage area 223,000 km2
Population in drainage area 10 million Population density in drainage area 45/km2
Length of lake 670 km
Width 12 à 90 Km
Length of shoreline 1,900 km
Latitude (South) 03°20‟ - 08°48‟
Longitude (Est) 29°03‟ - 31°12‟
Age Environ 12 million d‟années
Coastal perimeter 1 838 Km
Water Stratification Permanent
Depth of the oxygenated zone to the north
- 70 m Depth of the oxygenated
zone in the South
-200m
Salinity Environ 460 mg/litre
17
Figure 3: Geographical situation of Lake Tanganyika
Source: http://geocurrents.info/wp-content/uploads/2012/07/Lake-Tanganyika-Map.gif
18 II.2.1.3 Watersheds of Lake Tanganyika
Various factors make Lake Tanganyika an exceptionally rich and
interesting ecosystem. It is estimated that more than 10 million people are
living in Lake Tanganyika watershed in four riparian countries (Democratic
Republic of Congo (DRC), Burundi, Tanzania and Zambia). Most of the
waters of Lake Tanganyika extend over DRC with 45% of the lake's
surface, followed by Tanzania (41%), then Burundi (8%) and Zambia (6%)
(Capart, 1952). Lake Tanganyika, which is both the longest and second
deepest lake in the world, contains 17% of the world's fresh water, and
according to the same source, Lake Tanganyika's bottom shows:
The Northern basin (Bujumbura) including the mouth of Rusizi and the bay of Burton with a maximum depth of 450 m.
Kigoma Basin between Kungwe Peninsula and Kalemie Hill
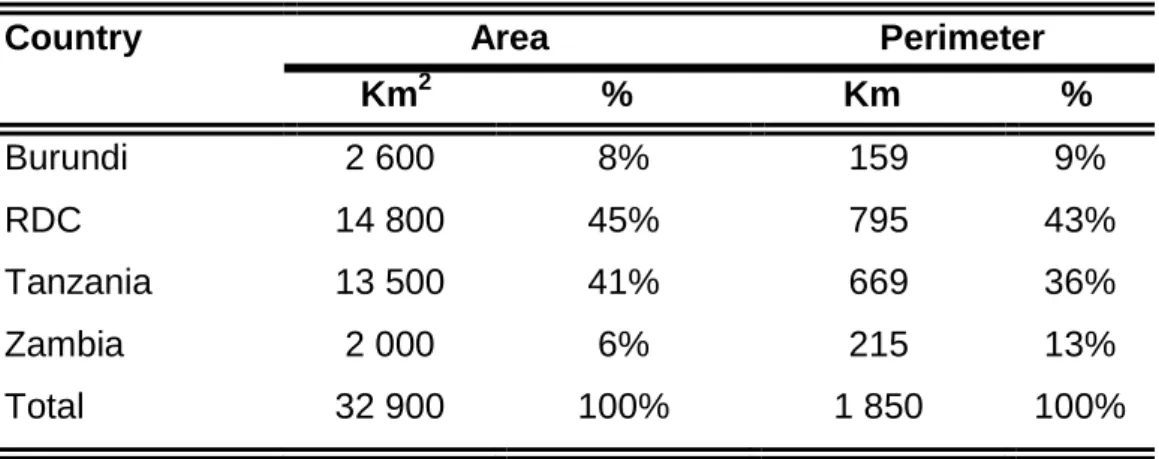
Zongwe basin which owns the deepest part of Kungwe up to Mpulungu. The table 4 shows how Lake Tanganyika waters are shared between four countries while the figure 4 shows the Watershed of Lake Tanganyika.
Table 4: Distribution of the Waters of Lake Tanganyika per country. Country Area Perimeter
Km2 % Km % Burundi 2 600 14 800 8% 159 9% RDC 45% 795 43% Tanzania 13 500 41% 669 36% Zambia 2 000 6% 215 13% Total 32 900 100% 1 850 100%
19
Figure 4: Map representing the watershed of Lake Tanganyika
Source:.http://www.globalnature.org/bausteine.net/i/21931/Map_LakeTanganyik aBasin.jpg?width=600
20 II.2.1.4 Tributaries of Lake Tanganyika
Lake Tanganyika is a reservoir estimated at 18,800 km3 of fresh water
(Coulter, 1991) and its waters join the Congo basin, then Atlantic Ocean
through Rukuga River. According to Nyakageni (1985), Lake Tanganyika is
powered by different rivers which have a high rainfall rate. The major
tributaries are Rusizi River which drains Lake Kivu located in the north and
Malagarazi River, which drains the west of Tanzania, located in the south
of Lake Victoria basin. Lukuga River is the only effluent that empties Lake
Tanganyika to Congo River then to Atlantic Ocean.
II.2.1.4.1 Malagarazi River
It drains more than half of the surface of the lake basin. With its numerous
tributaries, it gathers waters over an area of approximately 130,000 km2 to
the East of the lake (Patterson and Makin, 1997). Malagarazi forms the
border between Burundi and Tanzania over a distance of 156 km. The
main tributaries of the Malagarazi River in Burundi are: Rukoziri,
Nyakabonda, Mutsindozi, Ndanga, Nyamabuye, Muyovozi, Musasa and
Rumpungwe (Ngendakuriyo, 2008).
II.2.1.4.2 Rusizi River
Located to the western side of Burundi, Rusizi River is the way by which
Lake Kivu flows into Lake Tanganyika. During its passage over a length of
117km, Rusizi River gathers the waters from many tributaries such as:
Luvungi, Nyakagunda, Nyamagana, Muhira, Kajege, Kaburantwa,
21
II.2.1.4.3 Other tributaries on Burundian coast
Besides Malagarazi and Rusizi Rivers which are the major tributaries of the
lake, it is important to point out other tributaries across the Burundian coast
impacting on the water quality of the lake.These rivers are cited here from
north to south of the lake such as: Mutimbuzi, Kinyankongwe, Ntahangwa,
Muha, Kanyosha, Mugere, Karonge, Nyamusenyi, Nyaruhongoka,
Rukamba, Rugata, Ruzibazi, Cugaro, Kirasa, Buzimba, Buhinda, Shanga,
Ngonya, Kizuka, Munege, Kirasa, Dama, Mugerangabo, Murembwe (=
Siguvyaye + Jiji), Gasangu, Mukunde, Nyengwe, Kazirwe, Muguruka,
Kavungerezi and Rwaba.
II.2.1.5 Climatic Conditions
There are broadly two main seasons in the Lake Tanganyika: The rainy
season extending from October or November to May, characterized by light
winds, high humidity, heavy rainfall and frequent storms and the dry season
extending from June to September or October with moderate rainfall
accompanied by strong and steady winds from the south. The change of
seasons and wind speed result in southern and northern winds that
determine the dynamics of the intertropical convergence zone (Huttula et
al., 1997). These major climate patterns and particularly the winds, regulate
seasonal thermal regimes of Lake (Coulter, 1963; Spiegel & Coulter, 1991),
evaporation (Coulter & Spiegel, 1991), vertical mixing and movement of
water masses (Degens et al 1971). These hydro-physical phenomena are
22
productivity. Concerning the thermal conditions, Coulter et al. (1991)
indicate that Lake Tanganyika is a tropical lake, where the temperature is
greater than 25°C with an average difference rarely exceeding 3°C. The
same source indicates also that Lake Tanganyika has an intertropical
climate with annual precipitations covering almost 8months per year with a
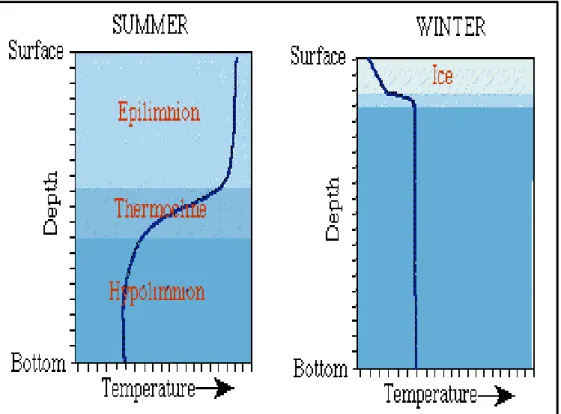
rainfall of 900 mm. There is a thermal stratification where a hot superficial
stratum called "epilimnion" is superposed on a deep stratum called
"hypolimnion" which is colder. Another stratum called "metalimnion" is
interposed between the epilimnion and the hypolimnion and is
characterized by a remarkable "thermocline". The figure 5 shows the
different thermal strata of lakes.
Figure 5: Graphic representation of the thermal stratification of Lakes
23
Indeed, the epilimnion has a temperature ranging from 25 to 27°C and its
thickness varies from 50 to 60m depending on the season in the northern
basin of the lake. The metalimnion is an intermediate stratum where the
temperature changes quickly from 26 to 23.5°C. The hypolimnion is the
deepest and the thickest stratum, with stable temperatures varying slightly
from 23 to 23.7°C.
II.2.1.6 Biotope of Lake Tanganyika
Regarding the physical and biological criteria associated to the depth and
to the profile of the lake, we can distinguish (Coulter, 1991):
A littoral zone made up of very varied habitats whose contours are
sometimes invisible. It is located between the surface and the depth of the
rooted plants with lower extension (0 to 10 m deep);
A pelagic or sub-littoral zone extending from the littoral limit up to the
depth limit of dissolved oxygen (Approximately 100m in the northern basin
and 200m in the Southern basin). It is a favourable area for planktons and
large biomass of fish.
A deep or profundal zone located under pelagic zone where the light
does not exist. It is therefore unsuitable zone for the aerobic life. It occupies
alone approximately 70% of the lacustrine basin. According to Poll (1958),
the estuarine and wetland biotopes are expansions of rivers, marshes and
wetlands around the lake. These are fluvial habitats belonging only to the
rivers and tributaries characterized by ecological conditions very different to
24
Figure 6: Categories of life zones in lakes
Source:https://image.pbs.org/poster_images/assets/lenticcommthu mb.jpg.resize.710x399.jpg.
II.2.1.7 Biodiversity of Lake Tanganyika II.2.1.7.1 General Considerations
Lake Tanganyika contains a remarkable fauna and till now, more than
1300species of organisms have been found in Lake Tanganyika, placing it
in second place in terms of diversity recorded in all lakes on earth (Cohen
and al., 1993). While all the African Great Lakes are home of several
species known world-wide as the cichlid fishes, LakeTanganyika in addition
25
than 145 species) and invertebrates including gastropods (more than 60
species), bivalves (over 15 species), ostracods (over 84 species),
decapods (over 15 species), copepods (more than 69species) and sponges
(more than 9 species) (Coulter, 1994).
Lake Tanganyika contains more than 1,300 species of plants and
animals and is one of the richest freshwater ecosystems in the world.
However, more than 600 of these species are endemic in the Lake
Tanganyika Basin. With its large number of species, including species,
genera and endemic families, it is clear that the lake contributes greatly to
the world's biodiversity. This wide biodiversity within a restricted area has
allowed for incredible genetic variation and a fascinating species evolution,
for example the "evolutionary plasticity" of Tanganyika jaw cichlids. Many
species that coexist over a long period of time in an almost closed
environment could be expected to illustrate interesting patterns of evolution
and behavior. Thus, with morphologically similar but genetically distinct
species, genetically similar but morphologically distinct species, species
with robust evolutionary armor in response to predation, diversified species
in the morphology of the jaws to exploit all available ecological niches and
species that have adopted complex strategies of reproductive and parental
behavior, including nest development, oral incubation, and reproductive
parasitism (Coulter, 1991) for a review of these and other topics.With its
many species with complex and derived patterns and behaviors, Lake
Tanganyika is a natural laboratory for research on ecological issues,
26
Lake Tanganyika are known worldwide, two species have attracted more
and more human interest: Sardines (Clupeidae) and Lates stappersii
dominate the biomass and are the target of industrial and artisanal
fisheries. Sardine species, as well as their related marine species, are
small, numerous, have a short life and are very successful whereas Lates
stappersii is a large predator. The table 5 shows the inventory of
biodiversity component of Lake Tanganyika.
Table 5: Biodiversity components of Lake Tanganyika (Coulter, 1994) Taxon Number of Species % of endemic species
Algae 759 - Aquatic Plants 81 - Protozoa 71 - Cnidarians 02 - Sponges 09 78 Bryozoans 06 33 Tapeworms 11 64 Roundworms 20 35 Segmented Worms 28 61 Towards Horsehair 09 - Thorny-Headed Worms 01 - Pentastomids 01 - Rotifers 70 07 Snails 91 75 Clams 15 60 Arachnids 46 37 Crustaceans 219 58 Insects 155 12
Fish (Cichlidae Family) 250 98
Fish (Non-Cichlids) 75 59 Amphibians 34 - Reptiles 29 07 Birds 171 - Mammals 03 - Total: 2156 -
27 II.2.1.7.2 Ichtyofauna of Lake Tanganyika II.2.1.7.2.1 Cichlids Fish
In Lake Tanganyika, the family of cichlids includes 187species of which 183
are endemic. This high endemicity is due to the fact that these cichlid
fish were able to adapt to the salinity, to geoclimatic and physico-chemical
changes (Baedle, 1962). According to Patterson and Makin (1997), the
number of cichlid fish of Lake Tanganyika in the early 19th century was
estimated at 79 species, of which Boulenger (1905) described 60species.
II.2.1.7.2.2 Non-cichlids Fish
In Lake Tanganyika basin, 21 non-cichlids fish families distributed in 51
different genera are discovered (De Vos and Snoeks, 1994). Among 145
species recorded, 61 species are endemic and the diversity of non-cichlid
fish is therefore close to that of cichlid fish, although the number of species
recorded for this family can be estimated significantly to 172species, of
which 167 are endemic (Coulter, 1999). The number of genera and species
varies slightly from what Coulter has reported as several genera have been
renamed in subsequent work and several new species have been
described (De Vos and Snoeks, 1994).
II.2.1.8 Fishing typology in Lake Tanganyika
Fishing plays a very important role in the Burundian economy and
represents a valuable source of animal protein for populations, especially
riparian populations (Evert, 1980). The main fishing beaches of Lake
28
Table 6: Fishing beaches of Lake Tanganyika on Burundian shoreline Fishing
beaches status
Fishing Beaches per Provinces
Bujumbura Rumonge Makamba
Official
1. Kajaga 1. Rumonge 1. Gasaba
2. Cadilac 2. Kagongo 2. Gifuruzi
3. Gitaza 3. Karonda 3. Kabonga
4. Kabezi 4. Kizuka 4. Muguruka
5. Kanyosha 5. Minago 5. Nyagatanga
6. Nyamugari 6. Mvugo
7. Magara
Unlawful
8. Cimental 6. Cugaro 7. Nyabigina
9. Gakombera 7. Gatare 8. Nyengwe
10. Gakungwe 8. Gatete 9. Rubindi
11. Gasange 9. Gikumu 12. Gatumba 10. Gisenyi 13. Gatumba-gaharawe 11. Kayengwe 14. Gatumba-kibero 12. Kigwena 15. Kibenga 13. Kinani 16. Kinindo 14. Makombe 17. Makombe 15. Murembwe 18. Migera 16. Nyacijima 19. Mwambuko 17. Shanga 20. Nyamusenyi 21. Nyaruhongoka 22. Rutunga 23. Ruziba Source: Author (2018)
Fish related activities occupy a large part of the population living on the
shores of Lake Tanganyika (Nahayo, 2010). According to the study carried
out by the Department of Water, Fisheries and Aquaculture in 2007, about
8000 Fishermen are employed in fishing sector and and more than 40,000
people work in related activities such as the construction of canoes, fish
processing and marketing. Commercial fishing activities are determined by
the phase of the moon. Although more than 50 different gears are identified
29
seines, gillnets and lines. Women are not involved in fishing and fishing
activities generally start in the evening and continue through the night and
catches are processed during the day.
II.2.1.8.1 Customary Fishing
The Customary Fishing is characterized by a cheaper investment and uses
a plank canoe having 3 to 5 meters in length with a limited number of
fishermen (Evert, 1980). In the customary fishing, the gears used are
varied and it is done during the day and night-time in quiet weather with or
without canoe (Breuil, 1995). The most commonly used equipments are: The landing net locally called "urusenga": used during night under the
lighting pressure of lamp near the coasts;
The dormant gill net locally called "amakira": net installed in the evening to be lifted the next morning near estuaries;
The beach seine: installed at a certain distance from the shore and drawn by several fishers toward the beach. Used during the day, it
captures almost all encircled fish;
The encircling gill net: used during the day in the fishing technique called the strike and locally called "umutimbo". The technique involves
circling the fishing area and hitting the water downstream of the net to
scare the fish.
30 II.2.1.8.2 Artisanal fishing
It is practiced in the northern part of the lake, especially by catamarans. A
typical catamaran unit consists of two mainly wooden hulls with lamps
(Hanek, 1994). The catamaran unit is equipped with 4 to 12 lamps, a plaice
net of 60 to 80 m in circumference and 4 to 8 fishermen and is propelled by
an engine of 15 to 20HP(horsepower).In this type of fishing, the target fish
are especially Clupeidae and Centropomidae which are pelagic (Rutozi,
1993).
II.2.1.8.3 Industrial fishing
It has been practiced since 1954. In 1980, purse seiners increased their
fishing effort up to 23 active units. It is a modern steel boat system from 15
to 18 meters equipped with a powerful diesel engine from 20 to 25 HP, a
winch, a purse seine having a length of 400 m and 100m vertical drop. This
system employs 20 to 30 fishermen and the nets are small meshs for
catching a mixture of clupeidae and louseflies (Durazzo, 1999).
II.2.1.9 Main threats of Lake Tanganyika II.2.1.9.1 Pollution
II.2.1.9.1.1 General Considerations
Pollution is a major threat to Lake Tanganyika‟s sustainability. Industrial and municipal Sewage are not currently treated before entering into the
lake and the governments of riparian countries do not have legislation to
prevent contamination of the lake. Pollutants include heavy metals, fuel and
31
J.,1997). The increase of deforestation has amplified the damage caused
by erosionleading tosedimentary deposition in the littoral zone (habitat for
organisms). Turbidity and changes in substrates can alter habitats,
disrupting food chain/web and primary productivity which reducing species
diversity (Cohen et al., 1993). The table7 shows the main Sources of
pollution in Lake Tanganyika watershed.
Table 7: Pollution sources in Lake Tanganyika catchment (Patterson and Makin, 1997).
Type of Pollution Sources
Industrial Sewage > 80 industries in Bujumbura, Burundi Sewage of urban households Bujumbura, Uvira, Kalemie, Kigoma,
Rumonge and Mpulungu Chlorides hydrocarbons,
pesticides, Heavy metals
Rusizi plain, Malagarasi plain Waters of the northern basin from industrial waste
Mercury Malagarasi river
residual ashes cement processing in Kalemie
nutrient elements associated with fertilizer
Rusizi plain, Malagarazi plain and other basins
organic waste ,sulfuric dioxide, Fuel and oil
sugar processing manufactory near Uvira city, Ports, lacustrine transport of commodities in all 4 countries
II.2.1.9.1.2 Sedimentary Pollution
Siltation is due to erosion in the drainage area further to increased
deforestation. In fact, the topsoil is transported to the lake, where it joins
chemical fertilizers and pesticides evacuated from the lake drainage area.
100% of the northern drainage area and approximately 50% of the central
areas have been cleared of their natural vegetation, leading to increased
erosion. Malagarasi and Rusizi Rivers provide an important part of waters
32
load in Lake. Siltation is the most damaging threat to the lake‟s biodiversity, especially siltation from the heavily-impacted smaller northern watersheds.
Large-scale deforestation and agricultural practices have resulted in a
dramatic increase in land erosion overhanging Lake Tanganyika. The
freshly eroded sediments entering into the lake affect adversely its
biodiversity, not only by decreasing species habitat, but also by making
certain essential nutrients more complex as trace elements.The studies
carried out by Cohen and al (1993) focused on the impact of increasing
river sediment supply on Lake Tanganyika's biodiversity. The impact of
eroded sediments entering into the lake can be observed on the figure 7.
Figure 7: Photo showing the lake sedimentary pollution further to rainy erosion. Source:
https://www.consoglobe.com/wp-content/uploads/2017/02/lac- tanganyika-GNF_River-Rusizi-flows-sediment-laden-into-Lake-Tanganyika-e1486394393582.jpg