HAL Id: tel-01391485
https://tel.archives-ouvertes.fr/tel-01391485
Submitted on 3 Nov 2016HAL is a multi-disciplinary open access archive for the deposit and dissemination of sci-entific research documents, whether they are pub-lished or not. The documents may come from teaching and research institutions in France or abroad, or from public or private research centers.
L’archive ouverte pluridisciplinaire HAL, est destinée au dépôt et à la diffusion de documents scientifiques de niveau recherche, publiés ou non, émanant des établissements d’enseignement et de recherche français ou étrangers, des laboratoires publics ou privés.
zebrafish larva
Adrien Jouary
To cite this version:
Adrien Jouary. Visually induced and spontaneous behavior in the zebrafish larva. Neurons and Cog-nition [q-bio.NC]. Université Pierre et Marie Curie - Paris VI, 2015. English. �NNT : 2015PA066605�. �tel-01391485�
THÈSE DE DOCTORAT DE
l’UNIVERSITÉ PIERRE ET MARIE CURIE
École doctorale Cerveau-Cognition-Comportement
Présentée par
Adrien Jouary
Pour obtenir le grade de
DOCTEUR de l’UNIVERSITÉ PIERRE ET MARIE CURIE
Sujet de la thèse :
Comportement moteur induit visuellement et
spontané chez la larve du poisson zèbre
Thèse soutenue le 9 octobre 2015 devant le jury composé de :
German Sumbre Directeur de thèse José Halloy Rapporteur
Michael Orger Rapporteur Georges Debrégeas Examinateur Claire Wyart Examinateur
Abstract
Behavior is often conceived as resulting from a stimulus-response association. Under this paradigm, understanding the nervous system is reduced to finding the relation between a sensory input and a motor output. Yet, in naturally behaving animals, motor actions influence sensory perceptions just as much as the other way around. Animals are continuously relying on sensory feedback to adjust motor commands. On the other hand, behavior is not only induced by the sensory environment, but can be generated by the brain’s rich internal dynamics. My goal is to understand the sensory-motor dialogue by monitoring large brain regions, yet, with a single-neuron resolution. To tackle this question, I have used zebrafish larva to study visually induced and internally driven motor behaviors. Zebrafish larvae have a small and transparent body. These features enable using large-scale optical methods, such as selective plane illumination microscopy (SPIM), to record brain dynamics.
In order to study goal-driven navigation in conditions compatible with imaging, I developed a visual virtual reality system for zebrafish larva. The visual feedback can be chosen to be similar to what the animal experiences in natural conditions. Alternatively, alteration of the feedback can be used to study how the brain adapts to perturbations. For this purpose, I first generated a library of free-swimming behaviors from which I learned the relationship between the trajectory of the larva and the shape of its tail.Then, I used this technique to infer the intended displacements of head-fixed larvae. The visual environment was updated accordingly. In the virtual environment, larvae were capable of maintaining the proper speed and orientation in the presence of whole-field motion and produced fine changes in orientation and position required to capture virtual preys. I demonstrated the sensitivity of larvae to feedback by updating the visual world only after the discrete swimming episodes. This feedback perturbation induced a decay in the performance of prey capture behavior, suggesting that larva are capable of integrating visual information during movements.
Behavior can also be induced by the internal dynamics of the brain. In the ab-sence of salient sensory cues, zebrafish larva spontaneously produces stereotypical tail movements, similar to those produced during goal-driven navigation. After
hav-ing developed a new method to classify tail movements, I analyzed the sequence of spontaneously generated tail movements. The latter switched between period of quasi-rhythmic activity and long episodes of rest. Moreover, consecutive movements were more similar when executed at short time intervals (∼ 10s). In order to study how spontaneous decisions emerge, I coupled SPIM to tail movement analysis. Using di-mensionality reduction, I identified clusters of neurons predicting the direction of spon-taneous turn movements but not their timings. This Preliminary result suggests that distinct pathways could be responsible for the timing (when) and the selection (what) of spontaneous actions. Together, the results shed light on the role of feedback and internal dynamics in shaping behaviors and open the avenue for investigating complex sensorimotor process in simple systems.
Remerciements
Ces quatre années de thèse m’ont permis d’explorer un sujet qui m’a passionné, la neuroscience des systèmes. Je remercie tout d’abord German Sumbre de m’avoir ini-tié à l’étude de ce petit poisson transparent, sa disponibilité et son attention ont été déterminantes dans l’aboutissement de ce travail. Le laboratoire aux expertises var-iées dans lequel j’ai travaillé m’a ouvert à l’ampleur des questions soulevées par ce petit cerveau. Poser les bonnes questions est un art subtil, les discussions que j’ai eu avec Sebastian Romano, Veronica Perez Schuster, Jonathan Boulanger-Weill, Selma Mehyaoui et Thomas Pietri ont grandement contribué à formuler les questions qui ont guidé mon travail. Je souhaite également remercier Mathieu Haudrechy, Sebastian, Alessia Candeo, Jonathan, Arthur Planul et Virginie Candat de m’avoir aidé à expéri-menter avec le gel, les poissons, les lasers, les matrice de covariance et des neurones brillants.
Je remercie Gerard Paresys et Yvon Caribou pour leur aide concernant le hardware. Bilel Mokhtari, Phi-Phong Nguyen, Pierre Vincent ainsi qu’Auguste Genovesio pour l’informatique. Pour m’avoir initié à l’imagerie par nappe laser, je remercie le Labo-ratoire Jean Perrin et en particulier Raphaël Candelier.
Je profite également de cette tribune pour faire un big up à Raphaël, Yann, Maximilien, Loic, Mehdi, Ugo, Alexis, Julien, Maayane, Sylvain Cajo, Anaïs, Jesse, Marine, Pierre-Marie, Gabriel, Thibault, Léa, Thalassa, Antton, Romain, Laura, Medjo, Paola, Adèle, Agathe, Alexandre Z, Alexandre G et Anne Claire1. Je remercie tout particulièrement
Anna pour son aide ces derniers mois et le temps passé avec elle. Finalement, ma famille, pour sa bienveillance et son soutien. Ma mère Carole et Christian, mon père Philippe et Marie, mes frères et sœur Camille, Lucas, Jean-Baptiste et François ainsi que mon cousin Cédric qui est pour moi un modèle de curiosité scientifique. Je remer-cie également Annemarie et Michel pour le beaufort et la bière.
La science ne se nourrit pas que d’inspiration, je suis reconnaissant à la fondation pour la recherche médicale d’avoir financé ma dernière année de doctorat.
Table of contents
List of figures ix
List of tables xi
1 Introduction 1
1.1 Understanding behavior: the sensory-motor dialogue . . . 1
1.2 Sensory feedback in the perception-action loop . . . 4
1.2.1 Recording from behaving animals: Virtual reality in neuroscience 5 1.2.2 How real is virtual reality? . . . 6
1.3 Internally driven behaviors . . . 9
1.3.1 Motivation for action in absence of sensory stimulation . . . 9
1.3.2 Neural basis of spontaneous behavior . . . 11
1.4 Large-scale analysis of circuit dynamics underlying behavior in ze-brafish larva . . . 17
1.4.1 The zebrafish as a model for systems neuroscience . . . 17
1.4.2 Locomotion of zebrafish larva . . . 20
1.4.3 Goal-driven behavior in the larval zebrafish . . . 23
1.5 Main aims . . . 28
2 A visual virtual reality system for the zebrafish larva 29 2.1 Introduction . . . 29
2.2 Results . . . 34
2.2.1 Prediction of the larva’s trajectory from the kinematics of tail movements . . . 34
2.2.2 Optomotor response in a two-dimensions visual virtual reality system . . . 38
2.2.3 Prey-capture behavior in two-dimension visual virtual reality . . 40
2.3 Materials and methods . . . 44
3 Internally driven behavior in zebrafish larvae 49 3.1 Introduction . . . 49
3.2 Internally driven behaviors of zebrafish larva . . . 51
3.2.1 Locomotor repertoire of zebrafish larva . . . 51
3.2.2 Chaining of spontaneous motor actions . . . 62
3.2.3 Supplementary Methods . . . 67
3.3 Neuronal patterns predictive of spontaneous behaviors . . . 72
3.3.1 Methods . . . 72
3.4 Results . . . 78
3.5 Supplementary Methods . . . 86
4 Conclusions and perspectives 89 4.1 A visual virtual reality system for the zebrafish larva . . . 89
4.2 Internally driven behaviors in zebrafish larva . . . 91
4.3 Neural basis of internal decisions . . . 93
List of figures
1.1 Influence of the motor activity on the sensory system . . . 5
1.2 Virtual Reality in neuroscience . . . 6
1.3 Spatial navigation in VR. . . 8
1.4 Segregation of arousal between locomotor activity and sensory respon-siveness according neuropeptites . . . 13
1.5 Readiness Potential across taxa . . . 15
1.6 Coarse brain anatomy of 6 dpf zebrafish larva . . . 19
1.7 Circuit for graded locomotion in zebrafish larva . . . 22
1.8 Flexibility of locomotor actions during prey capture . . . 25
1.9 Phototaxis in zebrafish larva . . . 27
2.1 Recording intention of movement in zebrafish larva . . . 30
2.2 Quantification of tail movements . . . 32
2.3 Prediction of trajectory from tail movements . . . 36
2.4 Optomotor response in virtual reality . . . 39
2.5 Prey-capture in virtual reality . . . 42
2.6 Alteration of visual feedback during movement . . . 45
3.1 Visually induced and spontaneous tail deflections . . . 52
3.2 Quantification of tail bouts . . . 53
3.3 Comparison of Feature and DTW-based similarity measurements . . . . 55
3.4 Continuum of tail kinematics . . . 58
3.5 Classification of tail bouts. . . 60
3.6 Distribution of movements in induced and spontaneous conditions . . . 62
3.7 Temporal chaining of tail movements . . . 65
3.8 Memory in the chaining of movements . . . 66
3.9 Alignment of tail deflection using DTWs . . . 69
3.11 Workflow for image preprocessing . . . 75
3.12 Preprocessing of the fluorescence signal . . . 77
3.13 Increase in activity prior to spontaneous movement . . . 79
3.14 Predicting movement direction using DLDA . . . 81
3.15 Specificity for the directionality of routine turns . . . 84
List of tables
1.1 Animal models in neuroscience . . . 18 1.2 Stereotypical tail movements . . . 20 3.1 Optical Part . . . 88
Nomenclature
Abbreviations Descriptions
Bout Discrete event of tail movement DLDA Direct Linear Discriminant Analysis Dpf Days post fertilization
DTW Dynamic Time Warping FKNN Fuzzy K-Nearest Neighbor IBI Inter-bout-interval
NA Numerical Aperture
NMLF Nucleus of the Medial Longitudinal Fasciculus OMR Optomotor Response
PCA Principal Component Analysis ROI Region of interest
Sem Standard Error of the Mean Sd Standard Deviation
S/R Stimulus/ Response
The problem then is not this: How does the central nervous system effect any one,
particular thing? It is rather: How does it do all the things that it can do, in their full complexity? What are the principles of organization?
John Von Neumann (1951). General and logical theory of automata
Chapter 1
Introduction
1.1 Understanding behavior: the sensory-motor
dialogue
Deep neural networks are now capable of competing with primates in image recogni-tion tasks (Cadieu et al., 2014). The architecture of artificial neural network reflects by fair means our understanding of the brain: an input-output system that builds complex associations from simple local operations (Bengio, 2009). After supervised learning, a chain of transformations in these networks associates an input to an ap-propriate output. The input provided to the network and its connectivity pattern deterministically specify the output. Early investigations on the brain circuitry were dominated by a similar idea: the reflex theory, where patterns of inputs delivered to the primary sensory neurons can be channeled to produce patterns of muscle activa-tion. This theory relied on the observation that neurons are inert until an input is provided (Sherrington, 1906). This observation led Sherrington to claim, in 1906, that this was a general rule for the whole nervous system:
From the point of view of its office as the integrator of the animal mecha-nism, the whole function of the nervous system can be summed up in one world, conduction.
Under this scope, neural circuits can be seen primarily as input-output devices link-ing a sensory stimulation to an appropriate motor response. Reduclink-ing the coupllink-ing between sensory circuits, motor circuits and the environment to a causal mechanism between the stimulus and the response, greatly simplifies scientific investigation on animal behavior (Edelman, 2015). Under the input-ouput paradigm, behavior can be decomposed as a series of stimulus/response (S/R) associations.
The S/R assumption has provided neuroscience with a rich quantitative framework to understand the relation between neuronal activity and behavior. The methodology employed to investigate the neuronal causes of behavior can be grossly recapitulated by three successive steps (Clark et al., 2013). First is the need to characterize re-producible behavior. This is done by identifying environmental features that reliably trigger a motor response either by observing natural behavior, or, by training animals to perform a S/R association. Then, brain recording techniques are used to find neu-ronal correlates. Investigators identify circuits or neurons whose activity correlates with stimulus features, behavioral responses or cognitive states relevant for the behav-ior. Finally, the "causal" role of the identified circuit is demonstrated by showing its necessity and sufficiency for behavior. Suppression of its activity is used to demon-strate its necessity for eliciting the behavior. Direct optical or electrical stimulation of its activity establishes the sufficiency of the circuit to induce the behavior.
This connection between a circuit and a behavior is a useful constraint for the establishment of a model. However, it does not provide sufficient insight on how this function is carried out (Sompolinsky, 2014). By systematically repeating the same external sensory protocol in order to estimate the statistics of the animal response, studies often lead to the description of neurons in terms of their average preferred stimuli or actions. Indeed, the S/R paradigm is especially suited to understand both ends of the input-output computation: how does the tuning of sensory neurons encode stimulus properties (Hubel and Wiesel, 1959), and how does the activity of neurons in motor area shape the generation of complex movements (Ashe and Georgopoulos, 1994). Our current understanding of neuronal circuitry enables neuroscientists to decode visual environments from the activity of the primary visual cortex (Nishimoto et al., 2011), or to coordinate artificial prosthetics based on the dynamics of the primary motor cortex (Wessberg et al., 2000).
Behavioral theories conceive the organism as primarily reactive, driven by the sen-sory stimuli (Skinner, 1976). Other theories have emerged in neuroscience to overcome fundamental limitations of this reflexive view of the brain: cognitivism and embodi-ment. Cognitivism accounts for abstract mental states that are not directly coupled with action nor with environmental sensory stimulation but rather reflect the ongoing thought process (Raichle, 2010). Embodiment stresses the crucial role of the body and its actions to shape perception. In natural behaving conditions, the brain is not a pas-sive receiver of sensory sensations but actively seeks information (Gover, 1996). The
1.1 Understanding behavior: the sensory-motor dialogue 3
behaviorist view, however is still dominant when considering "simple" animal models1.
Nevertheless, in simple sensorimotor tasks, interactions with the environment cannot be decomposed into a sequence of distinct events that start with a discrete stimulus and end with a specific response. Actions are continuously modified through feedback con-trol. Furthermore, animals continuously evaluate available actions and decide whether to pursue a given goal or to switch to an alternative. In my thesis project I have used two approaches to address the limitations of the stimulus/response framework:
1. The influence between the sensory environment and motor actions is
reciprocal. The description of the environment as a set of external inputs does
not account for the complex perception-action loop occurring in natural behav-ior. Even for simple sensorimotor tasks, sensory feedback resulting from action are critical to adjust motor commands in order to reach a goal. In the first part of this introduction, I will present virtual reality systems that provide a con-trolled sensory feedback allowing the study of goal-driven behavior in conditions compatible with brain functional imaging.
2. Motor actions should not be considered only as a reaction to sensory
stimuli. In strong contradiction with the reflexive view of the brain, the energy
budget associated with momentary demands of the environment could be as little as 1% of the total energy budget of the brain (Raichle, 2006), reflecting the major role of intrinsic activity. Previous studies have been dominated by research on neuronal activity and behaviors evoked by well controlled sensory stimuli. However, the brain’s rich internal dynamics are capable of generating behavior even in the absence of sensory cues. In the second part of the introduction, I will present the ecological motivations for internally driven behaviors and I will review their underlying neuronal mechanisms.
1In a recent paper, Buzsáki et al. (2015) considered a nervous system as "simple" when "the
connection between output and input networks is direct and immediate". This definition of "simple animal" is reminiscent of Sherrington’s view.
1.2 Sensory feedback in the perception-action loop
The nervous system is organized around goals that promote its fitness: finding a mate, escaping from predators or hunting preys. For an animal behaving naturally, motor actions influence the sensory system as much as the other way around.
Sensing is not a passive process. "Active sensing" is the process by which a sensory apparatus is positioned and modulated to enhance the animal’s capacity to extract be-haviorally relevant information (Gibson, 1962). This is obvious during tactile sensing: a rodent will rhythmically move its wisker. The sensation resulting from the bending of a whisker will be the result of a combination between the speed of the whisker and the tactile environment. Motor actions are thus actively driving sensations. A more widespread example of active sensing is eye movements. Eyes are not sensors waiting to receive external input but are continuously sampling the visual scene with systematic patterns of movement and fixation (MacEvoy et al., 2008). This rhythmic exploration resulting from eye movement has a crucial role in visual processing and perception (Schroeder et al., 2010).
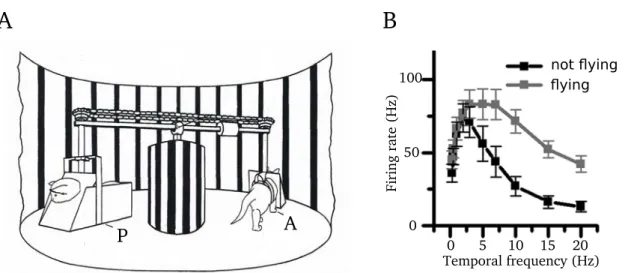
The development of the visual system relies on proper motor feedbacks. In their classical study, Held and Hein (1963) showed the consequence of deprivation of active exploration on development. For 3 h a day and during 42 days, kittens were placed in the apparatus showed in Figure 1.1.A. One of them could freely move (A) while the other was passively exposed to identical visual and vestibular stimuli (P). When tested at the end of these experiments, the passive kittens (P) performed poorly in several visuo-motor tasks. This study provided evidence for a developmental process relying on the feedback of motor actions on sensory experience.
Motor actions influence sensory neurons even without the mediation of the en-vironment or body. When changing from an immobile to flying state, visual motion sensitive neurons in the fly shift their tuning to higher velocities. Figure 1.1.B shows the tuning curve of a H1 speed-sensitive interneuron measured under two conditions: while the fly is not moving and during a flying state. In both cases, the visual stimuli are the same but the tuning of the neuron broadens toward high velocities during flight (Jung et al., 2011). A similar alteration of speed tuning in walking flies has also been
1.2 Sensory feedback in the perception-action loop 5
P
A
A
B
Temporal frequency (Hz) 0 5 10 15 20 Fi ring r a te ( H z) 0 50 100 flying not flyingFig. 1.1: Influence of the motor activity on the sensory system
(A) Illustration of the apparatus used to study the effect of motor feedback on the
development of the sensorimotor system. Active (A) and passive (P) kittens have a similar sensory experience but (A) is freely moving in contrast to (P) that does not experience self-generated sensory change. The sensory experience of (P) is driven by (A). Adapted from Held and Hein (1963). (B) Temporal frequency tuning curves of the mean response of a H1 neurons in non-flying and flying flied (black and gray respectively). When the fly is flying, H1 neurons is tuned to higher temporal fre-quency. Adapted from Jung et al. (2011).
1.2.1 Recording from behaving animals: Virtual reality in
neuroscience
We have seen how sensory feedback can affect brain activity during behavior. To study the neural basis of these behaviors, two options are available:
• The first is to record neuronal activity in freely moving animals. High resolu-tion microscopy techniques are however difficult to adapt to moving animals. Methods can either measure temporally accurate signals from few neurons (e.g. bioluminescence marker (Naumann et al., 2010), head-attached electrode im-plants) or measure spatially defined signal with a poor temporal resolution (e.g. calcium integrator (Sohal et al., 2009)).
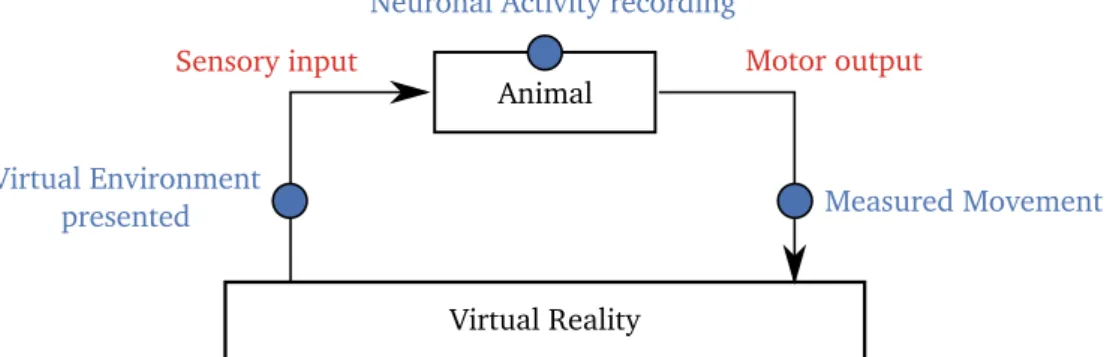
• An alternative solution is to use virtual reality (VR) in head-fixed conditions as shown in Figure 1.2. This method reproduces a subset of the sensory environ-ment that the animal would sense while freely moving. In closed-loop VR, the stimuli are continuously updated according to the animal motor responses.
Virtual reality setups have two main advantages compared to monitoring neuronal activity in freely behaving conditions. In the first place, it is compatible with high-precision functional neuronal recordings given that the head needs to be restrained in all imaging techniques or intracellular recording. Secondly, feedback can be chosen to be similar to what the animal would experience in natural conditions or one can manipulate them to study how the brain adapts to perturbations. VR has been used for decades to study the neural basis of behavior and has been adapted to several animal models and different sensory modalities (Dombeck and Reiser (2012), Sofroniew et al. (2014)). By allowing spatial navigation, VR can be also used to investigate complex
cognitive processes, for example, the maze running ability of rats allows the study of memory or decision making.
Animal
Virtual Reality
Sensory input Motor output
Neuronal Activity recording
Measured Movement Virtual Environment
presented
Fig. 1.2: Virtual Reality in neuroscience. Schematic view of a virtual reality be-havioral experiment. The animal’s movements are measured and passed through in-strumentation and computational stages in order to couple the movements with the sensory stimuli. Meanwhile, the neuronal activity can be monitored using functional imaging or electrophysiology.
1.2.2 How real is virtual reality?
How is spatial navigation experienced in VR, does it feel real? The answer may lay in the activity of neurons involved in representing space during virtual navigation. Even though birds can sense magnetic fields (Wu and Dickman, 2012), most animals are not equipped with position or orientation sensors. Position and orientation in space are inferred using a combination of external cues and path integration. In primates or rodents, neurons in the hippocampus become active during active exploration in specific locations of the environment. Those place-specific cells are called place cells, grid cells or border cells depending on the spatial pattern that they encode.
1.2 Sensory feedback in the perception-action loop 7
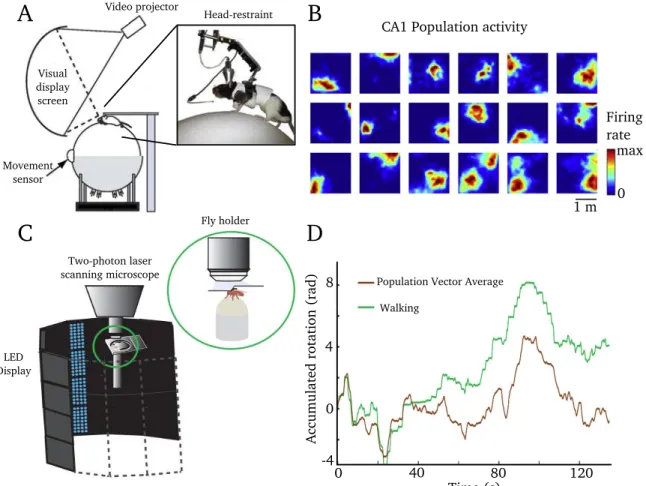
Early studies have shown that one dimensional place cells were found while a mouse was navigating along a virtual linear track (Dombeck et al., 2010). Extension of this setup to two dimension (2D) navigation failed to find place-specific cells. Only re-cently, an elegant setup allowed Aronov and Tank (2014) to monitor 2D place specific cells (Figure 1.3.A,B). In this experiment, the rodent was walking on a spherical treadmill. It could move forward by walking on the treadmill and turn by physically rotating its head. Although the head was restrained on one axis, it could still rotate, thus providing vestibular feedback absent in previous setups. The animal inferred its position in the 2D virtual environment through a combination of different sensory modalities: visual input from the display screen, vestibular input from the head move-ment and locomotor feedback. Providing only visual and locomotor feedback did not allow observing 2D place cells. This example illustrates how sensitive to feedback the neuronal representation of space is.
Insects are also capable of path integration (Collett et al., 2013). Recently, studies in VR of walking flies have shown the existence of head-direction cells combining self motion and external cues to represent their orientation with respect to the environ-ment (Seelig and Jayaraman, 2015). The neuronal activity encodes the fly orientation using both visual landmarks and motor feedback. In darkness and in the absence of vestibular input, the orientation of the fly relative to the ball can be decoded from the population activity of neurons in the ellipsoid body. This shows their ability for path integration using only locomotor feedback (Figure 1.3.C,D).
The VR approach has been successfully applied to study behavior in combination with functional imaging. However, even simple behaviors can involve large networks distributed across different brain regions (Portugues et al., 2014). In rodent animal models, technological limitations prevent us from simultaneously monitoring extensive brain regions. Therefore, it can be advantageous to study a model system with a compact brain and a reasonably rich behavioral repertoire, which enables whole brain imaging with single-cell resolution such as the zebrafish larva (Ahrens and Engert, 2015).
CA1 Population activity 1 m Video projector Visual display screen Movement sensor Head-restraint
A
B
Time (s) 0 40 80 120 0 4 8 -4 Ac cum u la te d rota ti o n (r a d) Population Vector Average
Walking
C
Fly holderD
Two-photon laser scanning microscope LED Display 0 Firing rate maxFig. 1.3: Spatial navigation in VR. (A) Scheme of the setup used for rodent VR experiments. Mouse locomotion results in rotation of the trackball recorded by movement sensors. The visual scene is projected on a spherical screen sur-rounding the rodent. Head restraining the mouse allows recording neuronal activ-ity. (B) Example of several rate maps recorded simultaneously from place cells in the hippocampus CA1 region. Neuron fire as a function of the animal position in the virtual environment consisting of a square area. Adapted from Aronov and Tank (2014). (C) Setup of the fly VR experiment and close-up on the fly on an air-floating ball. (D) Accumulated rotation of the ball while the fly is in total darkness (in green). A population vector average of neuron in the ellipsoid body (in brown)
sufficed to predict the accumulated rotation. Adapted from Seelig and Jayaraman (2015).
1.3 Internally driven behaviors 9
1.3 Internally driven behaviors
1.3.1 Motivation for action in absence of sensory stimulation
Movement does not occur solely as a consequence of sensory stimulation. Even in the relative absence of stimuli, the brain’s internal dynamics is capable of generating behavior. Hereafter, I will consider a behavior as being internally driven when it can not be linked to external stimulus. Internal drives such as hunger or fear can drive spontaneous movements even in the absence of external stimuli. But what happens if we consider a well-fed and comfortable animal with no obvious motivations? Although it is not trivial to determine the motivation underlying a spontaneous movement, we can consider several reasons why internally driven behaviors should not be considered as the output of a noisy system, with no biological relevance. Driving force of internally driven behaviors can be casted into two categories: extrinsic or intrinsic motivation (Gottlieb et al., 2013).
Extrinsic motivation for exploration
In extrinsically motivated contexts, behavior is a way to reach a biological goal e.g. finding food or potential mates. Foraging is an example of a natural decision-making process, widespread across taxa, from C elegans (Calhoun and Hayden, 2015) to mon-keys (Blanchard and Hayden (2014), Hayden et al. (2011)). In experience-studying foraging, the animal faces two possibilities: the default option (foreground) and the non-default option (background). For a sit-and-wait predator, the foreground decision is to keep waiting for possible prey, alternatively, the background option is to move to another location.
Neurons in the dorsal anterior cingumate cortex (dACC) of monkeys have been studied during foraging tasks. Firing rate in the dACC rose gradually when the ani-mal chose the background option and reached a threshold during foreground. The rise and threshold were modulated by context (e.g. uncertainty about the background op-tion) and internal drives (how desirable is the foreground opop-tion). The dAAC neurons activity was consistent with an accumulation of evidence, and the level of its activity reflected the value of the background option (Hayden et al., 2011).
At the behavioral level, the Lévy-flight foraging hypothesis predicts that a predator should adopt search strategies known as Lévy-flights when prey is spatially sparse and distributed unpredictably. Lévy flight is a random walk in which the distance
trav-eled at each step follows a heavy tail distribution. In contrast with Brownian motion, Lévy-flights are less confined because of the small number of long walks (Viswanathan, 2010). Analysis of displacement, recorded from animal-attached GPS has shown that diverse marine predators: sharks, bony fish, sea turtles and penguins exhibit Lévy-walk-like behavior close to the theoretical optimum (Sims et al., 2008). Some indi-viduals switched between Lévy and Brownian movement as they traversed different habitat types showing that they adapt their search strategy to the statistical patterns of the landscape (Humphries et al., 2010).
Foraging behavior is the result of a trade-off between exploiting immediate re-sources and exploring alternatives, a classic problem of reinforcement learning (Got-tlieb et al., 2013). When an agent is engaged in a task aimed at maximizing extrinsic reward (e.g. food), seeking spontaneously for information represents an intermediate step in attaining a reward. As we will see, this contrasts with intrinsically motivated behavior where the exploration is the purpose in itself.
Intrinsic motivation for learning
Interestingly, in controlled environments, where food resources are always available and animals are over-trained to know where the food is, animals can still exhibit rich temporal and sequential behavioral dynamics (Jung et al., 2014). Under these condi-tions, the behaviors cannot simply be explained as an optimal strategy for exploiting available resources but may originate from an intrinsic drive for exploring.
In intrinsically motivated behaviors, information seeking is in itself the purpose, and it is not driven by imperatives of resource exploitation. In the sensorimotor do-main, for instance, intrinsically motivated behavior could be used to acquire motor skills. The field of developmental robotics is aiming at designing of agents that can autonomously explore environments, without pre-programmed trajectories, but based solely on their intrinsic interest. Inspired from developmental psychology, the systems built were capable of learning the consequences of their motor actions and solve self-generated problems by maximizing the local learning progress (Gottlieb et al., 2013). Piaget described a sequence of progress occurring during child learning from sensori-motor to abstract reasoning stages (Piaget, 1972). The field of developmental robotics suggests that child learning is not necessarily a pre-programmed sequence, but may emerge through an intrinsically motivated learning.
1.3 Internally driven behaviors 11
Bird songs are a good example of intrinsically motivated behaviors. Male song-birds primarily aim at attracting mates. However, the zebra finche male also sings outside the breeding season. These songs were not aimed to any female, and thus they were defined as undirected songs (Kroodsma and Byers, 1991). Unlike sexually oriented songs, undirected songs are ignored by potential recipients and have no im-mediate effects on the conspecifics’ behavior. Undirected songs show more variability than sexually oriented ones, suggesting that they could reflect a practicing exercise (Wellock, 2012). Their goal could be the retrieval of auditory information about their generated songs through feedback in order to improve it. Recent studies suggest that the rewarding mechanisms associated with undirected and sexually directed songs are different. Sexually oriented songs may be primarily reinforced by opioids released in neuronal circuits associated with the social context. In contrast, undirected songs are not effected by external rewards, but could be reinforced through opioids released in the ventral segmental area by the act of singing (Riters, 2012).
The goal of internally driven behavior is not to act on the environment but to re-trieve information. The distinction between extrinsically and intrinsically motivated spontaneous behaviors is not trivial but illustrates that distinct motivations can un-derly internally driven behaviors. Beyond the nature of these motivations, the spon-taneous decision-making processes rely on two questions: what and when. Which movement to choose and when to execute it. In the next section I will review investi-gations on the neuronal mechanisms involved in spontaneous movements.
1.3.2 Neural basis of spontaneous behavior
Looking at the same behavior in sensory-induced and spontaneous contexts, it is ex-pected that the neuronal activity partially overlaps in both scenarios, at least at the level of the central pattern generators (CPGs) in the spinal cord. Under the S/R paradigm, it is tempting to consider that the pathways involved during sensory-based decision making can be activated by neuronal noise causing internally driven behavior. In this section, I will first review preliminary evidence indicating that spontaneously driven and sensory-induced decisions are controlled by partially non-overlapping path-ways. Then, I will present the results on the neuronal mechanisms that specify the timing (when) and selection (what) of spontaneous actions.
Similarity between neuronal activity underlying internally driven and stimulus-induced behaviors
Fluctuations in the activation of sensory brain regions are insufficient to explain spon-taneous movements. By recording motion-sensitive neurons in the fly optic lobes, Rosner et al. (2009) found that the variability was not sufficient to account for the variability in head movements. This raises the following questions: does a circuitry specific to spontaneous movements exist and affect the locomotor activity indepen-dently of any sensory stimulation? General arousal has been defined as promoting an increase in both locomotor activity and sensory responsiveness (Pfaff et al., 2008).
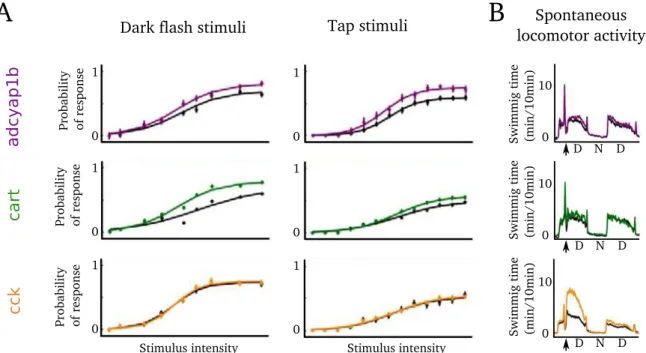
Experiments in rodents suggested that general arousal could account for 30% of the variance in activity measured in response to a wide variety of behavioral trial (Garey et al., 2003). Recent studies in zebrafish indicate that increase in locomotor activity and sensory responsiveness are not necessarily coupled. Woods et al. (2014) studied the influence of neuropeptides on the modulation of spontaneous locomotion and sen-sory responsiveness to several behaviors. Their study identified two neuropeptides, Cart and Adcyap1b that had no effect on spontaneous locomotor activity during night and day but affected the probability of inducing a behavioral response to both dark flash stimuli and tap stimuli (Figure 1.4.A,B). Cck generated the opposite effect, increasing the spontaneous activity without affecting sensory-induced responsiveness to the stimuli tested (Figure 1.4.C).
Arousal is thus partitioned into spontaneous locomotor activity and sensory re-sponsiveness. The neuronal mechanisms responsible for this segregation are unknown, but this suggests that sensory evoked and spontaneous behavior could be controlled by partially different neuronal pathways, each affected differently by the neuropeptides mentioned.
When to move? Timing of spontaneous behavior
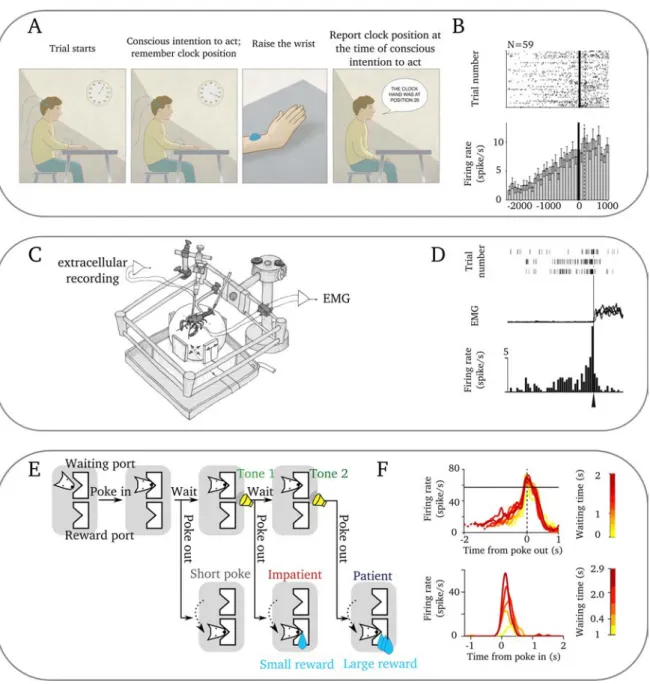
How does the brain spontaneously take the decision to execute a given action in the absence of environmental stimuli? By recording electroencephalogram signals before spontaneous decisions in humans, Kornhuber and Deecke first described, in 1964, a gradual buildup in activity starting ∼ 1s before a voluntary movement. In 1983, in a follow-up experiment, Libet asked subjects to report the time when they first felt the urge to move (Figure 1.5.A). Subject’s conscious awareness of an intention to
1.3 Internally driven behaviors 13 adc ya p1b c ar t c c k D N D D N D D N D 0 10 0 10 0 10 S w im m ig ti m e (m in /1 0m in) S w im m ig ti m e (m in /1 0m in) S w im m ig ti m e (m in /1 0m in)
Dark flash stimuli Tap stimuli Spontaneous locomotor activity
Stimulus intensity Stimulus intensity
P ro ba bi lity of re sp o nse P ro ba bi lity of re sp o nse P ro ba bi lity of re sp o nse 0 1 0 1 0 1 0 1 0 1 0 1
A
B
Fig. 1.4: Segregation of arousal between locomotor activity and sensory
responsiveness according neuropeptites (A) Neuropeptidic modulation of
response to a dark-flash and tapping stimuli. Colored curves correspond to the in-duction of neuropeptid and black curves to wild-type siblings. Response probabil-ity +-s.e.m is indicated for each stimulus intensprobabil-ity. Adcyap1b and cart increase the probability of response and decrease the stimulus threshold of detection for both dark-flash and tapping stimuli. Responsiveness of cck-expressing larvae show how-ever indistinguishable from control. (B) Neuropeptidic modulations of locomotor activity. Swimming time is quantified by the time of swimming during a 10-minute window. The black arrows represent the heat-shock that induced the expression of neuropeptite. Spontaneous activity of larvae is monitored day (D) and night (N) af-ter the heat-shock. Cck-expressing larvae showed an increase in locomotion following the heatshock contrasting with cart and adcyap1b expressing larvae that showed no significant variation. Adapted from Woods et al. (2014).
act occurs only 200 ms before the onset of a movement, which is much later than the onset of the readiness potential. The debate raised by this experiment is outside the scope of this thesis but this experiment is still unique in neuroscience in its philosoph-ical implication. The idea that unconscious brain processes are the true initiators of voluntary acts inflicted a narcissistic blow to our notion of free-will. In humans, these results were confirmed using fMRI (Bode et al., 2011) and at the single neuron level in epileptic patients (Fried et al., 2011). Figure 1.5.B shows single-cell recording prior to self-initiated movement in the Supplementary Motor Area where electrical stimulations have been reported to induce an urge to move. Even though the report of the conscious time can only be studied in primates, readiness potential was found in other species as well.
In invertebrates, extracellular recordings from the crayfish descending motor path-way showed similar temporal dynamics before the onset of walking (Figure 1.5.C,D, Kagaya and Takahata (2010)). A recent study in the rat Secondary Motor Cortex (M2) showed interesting perspectives on possible mechanisms at the core of this gradual build-up in firing rate before movements (Murakami et al., 2014). In this experiment, rats had to choose between waiting for auditory cues to collect a big reward, or stop waiting to collect a small reward (Figure 1.5.E). The timing of the auditory cues was unpredictable. The study focused on trials where the rats decided to stop waiting for the auditory cues. Of the 385 neurons electrophysiologically recorded from M2, ∼ 10% showed a "ramp-to-threshold" activity reminiscent of the readiness potential (Figure
1.5.F). The faster the ramping activity, the shorter was the time. Additionally, ∼ 20%
were identified as "transient neurons". Their firing rate was correlated with waiting time in a brief burst rather than a ramp (Figure 1.5.F). In the proposed model, a set of transiently active neurons served as inputs to integrator neurons displaying a ramping activity. This integration-to-bound model is similar to a decision model where a population of neurons accumulates evidences and generates an action when a threshold is crossed.
Probably due to the influence of Libet’s experiments and its implication questioning the notion of free will, further studies have mainly focused on the timing of sponta-neous movements. The literature is however scarce on the mechanisms underlying the selection of spontaneous actions.
1.3 Internally driven behaviors 15
Fig. 1.5: (Previous page.) (A) Schematic description of the experimental paradigm of the Liber experiment. Subject is instructed to spontaneously flex his wrist at any time while looking at the clock-like display. After the movement, the subject had to report the time when he first became consciously aware of his intention. (B) Raster plot and histogram of a neuron recorded in the Supplementary Motor Area. Solid black lines indicate the time of the conscious decisions, dotted lines indicate the on-set of movements. Adapted from Fried et al. (2011). (C) A spherical treadmill sys-tem used for extracellular recordings from the nervous syssys-tem of a crayfish during walking. (D) Descending unit activity, with raster plot and trial averaged record-ings from the circumesophageal commisure before the onset of spontaneous walk-ing. Adapted from Kagaya and Takahata (2010). (E) Schematic diagram of trial events in the rat waiting task. In each trial, the rat was required to wait for tone (s) and moved to the reward port to obtain water. If the rat failed to wait for tone 1 (T1), there was no reward. If the rat waited for T1 but left before tone 2 (T2), a small reward was given. If the rat waited until T2, a large reward was provided.(F) The firing rate of two neurons recorded in M2. Upper panel: firing rate of a "ramp-to-threshold" neuron color-coded according to the length of the waiting time and aligned with the onset of the poke-out. Lower panel: firing rate of a "transient" neu-ron showing phasic activations at the beginning of the waiting period. The firing rate is positively correlated with the length of the waiting period of impatient trials. Adapted from (Murakami et al., 2014).
What to do? Selection of spontaneous action
The firing rate of "ramp-to-threshold" and "transient" neurons predict the timing of spontaneous actions. In order to find out if those neurons were action-specific or not, an extension of the nose-poke waiting task of Figure 1.5.E recorded the same neurons while the rat was performing a lever-press waiting time task.Murakami et al. (2014) found that among "transient" neurons, the percentage of lever-press predictive
neurons among all the nose-poke predictive neurons was not more than among all neurons. Thus, neurons whose activity was correlated with the length of the waiting time period were also action-specific rather than being tied to a general preparation to any type of movement.
Alternatively, it is possible to consider that distinct paths specify the what and when of spontaneous movements. In crayfish, by looking at the direction of movement (forward-backward) in the experience in Figure 1.5.C, some descending units were found to be not-selective to the direction of movements. Interestingly, they were re-cruited ∼ 4s before the behavioral onset, the selective units followed them ∼ 2.5s later
1.4 Large-scale analysis of circuit dynamics underlying behavior in zebrafish larva 17
(Kagaya and Takahata, 2010). The dissociation between the when and the what com-ponents of intentional decision is also supported by human experiments using fMRI. In a follow-up to Libet’s experiment (Soon et al., 2008), subjects could freely choose between two options (e.g. right or left tap). While there are still some inconsistencies regarding the exact localization of these components (Serrien, 2010), they found that the region predictive of the choice of decision (what) was different from the region pre-dictive of the timing of action (when). Interestingly, prediction concerning the type of movement can be made in advance to the prediction of the timing.
During internally driven behaviors, animals face a large set of possible actions and perform them in complex temporal patterns. Despite the advance in elucidating the mechanisms governing the when and the what of a decision, Libet-type experiments are subject to several shortcomings. First, experiments are usually structured in trials. Thus, the mechanisms observed could be more related to time estimation than to spontaneous behaviors. A striking example is the fact that populations of "transient" neurons in M2 are aligned with the beginning of the trial, not with the onset of the decision. Secondly, in order to have a well-controlled experimental setting, subjects have to be presented with a very limited set of alternatives (e.g. poke out or lever press). This situation is oversimplified compared to the vast action repertoire available in natural conditions. Finally, most neuronal recordings have been made in premotor or motor circuits, but the influence of other brain regions has not yet been investigated. Neuronal activities related to decision making are widely distributed (Cisek, 2012). By monitoring several brain regions, one can disentangle the dynamical properties of the circuits specifying the what and when of spontaneous motor decision. In the next section, I will present the zebrafish larva, an animal model that is ideally suited to study internally driven behaviors by overcoming these limitations.
1.4 Large-scale analysis of circuit dynamics
under-lying behavior in zebrafish larva
1.4.1 The zebrafish as a model for systems neuroscience
The brain complexity arises from the variety of levels of organization: from synaptic transmission to neuronal circuits and behavior. Each level of organization is attached to a specific discipline, from genetics to ecology. In this context, it is worthwhile to focus technological and scientific efforts on a restricted number of animal models,
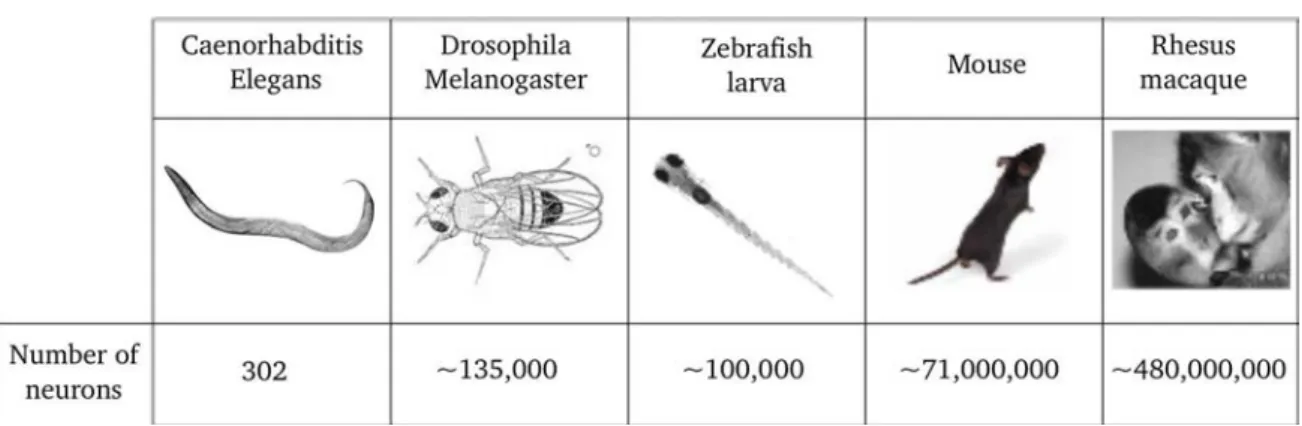
Table 1.1: Animal models in neuroscience. The last row indicates the estimated number of neurons. For Rhesus macaque, only cortical neurons are considered.
where our understanding will benefit from a multidisciplinary approach. Neuroscience uses several model organisms, each with different brain and behavioral complexities, illustrated in Table 1.1.
Zebrafish (Danio rerio) is a small gregarious teleost fish (∼ 4 cm) originating from the south of Asia. They are easy to breed and have a fast reproduction cycle. Develop-mental and genetic studies have taken advantages of the transparency of their embryo since the late 1950s. Nowadays, a large library of transgenic and mutant fish is avail-able, enabling us to target specific cell types or provide vertebrate models of human neurodevelopmental, neurological and neurodegenerative diseases (Deo and MacRae, 2011).
With the development of new optical methods and optogenetics, the zebrafish larva has recently become an appealing vertebrate model for systems neuroscience. Due to its small size and transparency, its brain activity is ideally accessible. State of the art optical methods including, two-Photon Scanning Microscopy, Selective Plane Illumination Microscopy, and Light-Field Microscopy have been successfully applied to simultaneously monitor the activity dynamics of large brain regions (Figure 1.6). Optogenetic sensors, such as GCaMP, a genetically encoded calcium indicator, can be expressed in selected populations of neurons. GCaMP changes its fluorescence properties in response to the binding of Ca2+. The firing of neurons causes an increase in the intracellular calcium concentration resulting in rapid rises and decay in the fluorescence of GCaMP sensors.
Additionally, optogenetic actuators such as halorhodopsin or channelrhodopsin, can also be expressed. These light activated ion channels can induce or suppress
1.4 Large-scale analysis of circuit dynamics underlying behavior in zebrafish larva 19
neuronal activity. This perturbation of neuronal activity can be useful to probe the causal role of neuronal activity in selected populations of neurons.
All these manipulations are commonly performed in an "all-optical" manner with-out the need for surgery, or anesthesia and just requires the larva to be head-restrained in agarose leaving the eyes and the tail free to move.
In order to understand behavior, it is necessary to understand the total action of the nervous system, as explained by D. Hebb in The Organization of Behavior (1949):
One can discover the properties of its various parts more or less in isolation; but it is a truism by now that the part may have properties that are not evident in isolation, and these are to be discovered only by study of the whole intact brain.
The ability to simultaneously monitor sensory and motor areas in a behaving animal make zebrafish an ideal model for the holistic approach on how the brain generates behavior (Ahrens and Engert, 2015).
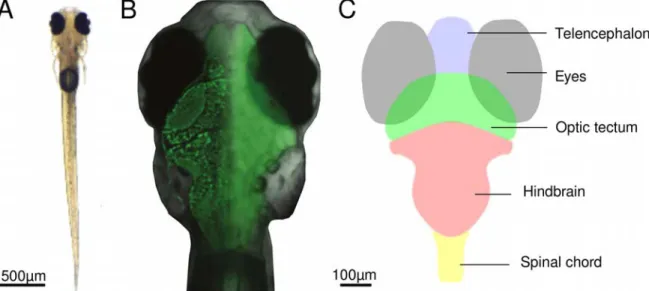
Fig. 1.6: Coarse brain anatomy of a 6 dpf zebrafish larva. (A) Bright-field image of a zebrafish larva. (B) Overlay of a bright-field image of the larva head with images of its brain acquired using two-photon microscopy (left part of the brain) and fluorescence imaging (right part of the brain). Note the spatial resolu-tion on the left part obtained with a two-photon microscopy. Neurons are labeled with the green fluorescent calcium indicator GCaMP5G. Image reproduced from Fetcho (2012). (C) Schematic drawing of the larva’s brain showed in B represent-ing the main parts of the brain (telencephalon, optic tectum, hindbrain and spinal cord) and the eyes. The 100µm scale bar is commong for B and C.
Slow scoot J turn Routine turn C bend
Low degree of bending and tail beat frequency. Yaw angle smaller than 3°.
Fine reorientation tuning associated with prey capture. A prominent bend occurs at the cau-dal portion of the tail.
Slow-speed turn with a large bend angle resulting in reorientation of the larva. The bend is mostly unilateral.
High-velocity turn of short duration. Rely on the Mau-thner cells.
Table 1.2: Stereotypical tail movements. Each column represents a typical tail movement and its characteristics. The middle column shows the superimposition of image of the larva during the tail bout. The trajectory of the head is shown by a white line, the black arrows represent the head orientation at the begining and end of the bout.
1.4.2 Locomotion of zebrafish larva
The locomotor repertoire of zebrafish larva
The zebrafish larva propels itself through a sub-carangiform pattern of body undula-tions. The oscillations of the tail are coordinated with pectoral fins movements. At the larval stage, zebrafish locomotor patterns are characterized by swimming episodes intermingled with non-swimming episodes called "beat and glide". The discrete seg-ments formed by the beat and glide swim in larvae are called tail bout, the range of durations of tail bouts is 80-400 ms, the range of tail beat frequency is 30-100 Hz (Buss and Drapeau, 2001). The quantification of behaviors is greatly facilitated
be-cause of the discrete nature of locomotion. Zebrafish larvae exhibit a variety of tail bouts: they include slow scoot (also called forward swim), routine turn, J turn or C bend illustrated in Table 1.2. These categories were described according to the tail movements as well as the kinematics of the trajectories (Mirat et al. (2013), Borla et al. (2002), Budick and O’Malley (2000)). Because they are defined by the properties of
the trajectory, this categorization is not suited for the head-fixed conditions, where the trajectories are unknown.
1.4 Large-scale analysis of circuit dynamics underlying behavior in zebrafish larva 21
The natural segmentation of movement events associated with a reasonably stereo-typed locomotor repertoire is ideally suited for large-scale characterization of zebrafish behavior.
Neural basis of locomotion
Due to its limited locomotor repertoire and optical accessibility, zebrafish offers the opportunity to dissect the circuits involved in the generation of movements.
Within the spinal cord, activation of neurons follows a dorso-ventral organization. Ventral spinal interneurons and motor neurons are activated during slow-swimming regimes, and more dorsal neurons are recruited as the velocity of locomotion increases. Menelaou and McLean (2012) suggested that a continuous variation of the group of interneuron cell types, produces a smooth shift in the locomotor speed. Some interneurons within the spinal cord are specific to a category of movement. Optoge-netic stimulation of Kolmer-Agduhr cells generated spontaneous slow scoots, whereas activation of Rohon-Beard touch sensitive cells triggered C-bends (Wyart et al., 2009).
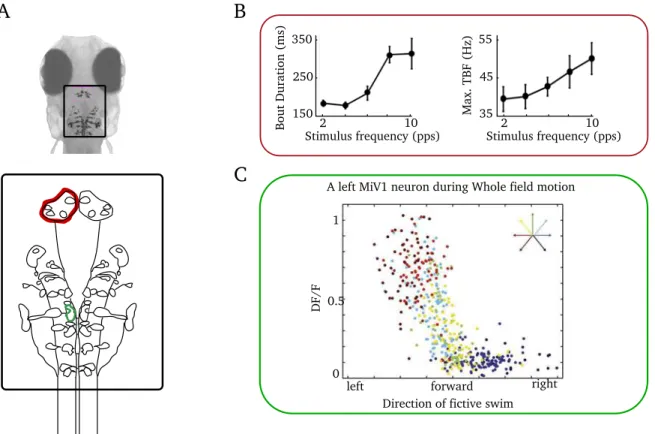
The spinal cord receives descending glutamatergic inputs from the reticulospinal cells (RS), causing the tail to oscillate. This population is composed of less than 300 neurons located in the hindbrain and mid-brain (Figure 1.7.A). The most iconical is the Mauthner cell, a large neuron implicated in short latency escape responses. Apart from the Mauthner cells, a large part of RS neurons is multifunctional.
Individual RS neurons can be active during multiple types of locomotor behavior. The nucleus of the longitudinal fasciculus (nMLF) has been implicated in prey capture and responses to whole field motion. Ablation of two pairs of identified cells within the nMLF, MeLc and MeLr impaired prey capture as well as the ability to modulate speed in response to whole-field motion (Gahtan et al. (2005), Severi et al. (2014)). Electrical activation of the nMLF induced scoot movements whose duration and speed are modulated by the strength of the stimulation (Figure 1.7.B).
A small portion of cells are involved in turning, and the ventromedial spinal projec-tion neurons (vSPNs) bias forward scoot to asymmetrical movement under different behavioral contexts (Huang et al. (2013), Orger et al. (2008)). Their activity is direc-tion specific and graded by the amount of turning (Figure 1.7.C). Abladirec-tion of these cells decreased the number of turns but also increased the proportion of forward swim movements, consistent with the idea that these cells bias the kinematic of scoots in a
graded fashion.
The upstream circuitry that leads to the selective activation of these descending control neurons can be investigated by studying the neuronal activity in sensory evoked locomotion.
A
B
C
350 Stimulus frequency (pps) 2 10 150 250 Bou t D u ra ti on ( m s) 55 Stimulus frequency (pps) 2 10 35 45 M a x . T B F ( Hz )Direction of fictive swim forward
left right
DF/F
A left MiV1 neuron during Whole field motion
0 1
0.5
Fig. 1.7: Circuit for graded locomotion in zebrafish larva. (A) Head of a ze-brafish larva. The RS circuits are located in the rectangle. Inset shows a scheme of the RS neurons. (B) Average bout duration and maximal tail beat frequency per bout recorded in response to electrical stimulation of the nMLF circuit. Adapted from Severi et al. (2014). (C) Fluorescent calcium response (DF/F) of a MiV1 neu-ron as a function of swimming direction. Each dot represents a bout and the color indicates the direction of the visual stimuli used to elicit the swim. Adapted from Huang et al. (2013). The color of the bounding box of (B) and (C) match the re-spective location of the cells in (A).
1.4 Large-scale analysis of circuit dynamics underlying behavior in zebrafish larva 23
1.4.3 Goal-driven behavior in the larval zebrafish
Typical habitat of zebrafish consists of shallow and clear water with slow moving streams. Zebrafish are commonly found in ephemeral pools or rice paddles. They are omnivorous, consuming insects, zooplankton and algae (Parichy, 2015). By 6dpf, the vitellus lipids reserves are consumed and the larva needs to catch prey. This vulnerability results in a mortality rate as high as 50% due to starvation at 12 dpf (Bardach et al., 1972). This illustrates the ecological pressure which induced a rapid
and early development of functional sensory-motor circuits.
Compared to rodents or primates whose behaviors have been comprehensively eval-uated and defined (Shettleworth, 2010), the description of zebrafish behavioral reper-toire is still a developing field of research (Kalueff et al., 2013). Field observations of zebrafish larvae behaviors are surprisingly rare. Most of what we know about their behavior has been inferred from experimental studies in laboratory environments. The simplest forms of goal-directed behavior are taxis. During taxis behavior, an animal will try to reach a desired location in the environment. The location can be chosen according to different properties, light in the case of phototaxis, chemical compositions for chemotaxis or prey for telotaxis. I will focus on visually induced taxis in zebrafish larva.
The optomotor response
The optomotor response (OMR) is common to fish and insects, animals that could be carried away be air or water streams. OMR designates a form of visual taxis whereby animals follow the whole-field motion. This could allow larva to avoid being carried downstream by the current. When presented with a whole-field moving stimulus, fish will turn and swim in the direction of perceived motion thus maintaining a stable image of the world on the retina and thus a stable position with respect to their visual environment.
OMR can be reliably evoked from 5 dpf and is maintained throughout adulthood. Thanks to the reliability of its responses, OMR has been widely used to conduct large scale genetic screens (Muto et al., 2005), study the psychophysics of vision (Orger and Baier, 2005), reveal the reticulospinal circuitry controlling movements (Orger et al. (2008), Severi et al. (2014)), confirm the cerebellum’s role in processing discrepan-cies between perceived and expected sensory feedback (Ahrens et al., 2012a) and to implicate the dorsal raphe in different states of arousal (Yokogawa et al., 2012).
The prey-capture behavior
Four days after fertilization, zebrafish starts hunting potential food. This behavior is critical for survival and relies on several decision-making processes. The first step is the visual recognition. Larvae rely mostly on vision to capture prey, as demonstrated by the dramatic decrease in the number of prey eaten in the dark (Gahtan et al., 2005). Small moving dots (4° diameters) will elicit specific locomotor and oculomotor movements intended to position the larva in front of its prey (Figure 1.8.A,B), on the contrary, big dots will elicit turns away from the stimulus (Bianco et al., 2011a). After recognition, the larva will initiate a bout to bring the paramecia in front of it. Succesive bouts will bring the paramecia progressively closer (Figure 1.8.C). The capture itself will occur via suction or bitting depending on the relative position of the prey (Patterson et al., 2013). Prey capture is a highly flexible behavior, zebrafish can bias the speed, intensity and directionality of their movements based on visual cues. Figure 1.8 shows how the direction of movements is gradually adjusted to the relative position of the prey.
Semmelhack et al. (2015) found that AF7 (arborization field 7) displayed an in-crease in activity specific to the detection of prey-like stimuli. Neurons in AF7 receives input from the retina and project to the optic tectum (OT, AF10), nMLF and the hindbrain. The OT is the largest recipient of retinal projections, it presents a complex layered structure with a retinotopic organization. The OT respond to a wide variety of stimuli (Gabriel et al. (2012), Muto et al. (2013)).
By presenting a battery of visual stimuli with different features (direction, speed, polarity of contrast and size), Bianco and Engert (2015) found that neurons in the OT showed a non-linear mixing of selectivity for different features relevant for prey detection. A different set of neurons in the OT anticipated eye convergence indicative of prey detection.
Although the neuronal circuits underlying detection of prey have been revealed, little is known about the neuronal activity during the approach nor the computations underlying the decision to pursue or not a prey.
1.4 Large-scale analysis of circuit dynamics underlying behavior in zebrafish larva 25
A
B
C
Fig. 1.8: Flexibility of locomotor actions during prey capture. (A) Diagram illustrating the prey azimuth θprey and the corresponding turn angle φpred. (B)
Scat-ter plot of the orientation of the initial turn as a function of the prey azimuth. Lar-vae performed gradual turn but consistently underestimated prey location. The in-formation about the prey location is reliably transposed into a corresponding mo-tor command. (C) Frames from high-speed video illustrating differences in the di-rectionality of movements following the initial orientation turn. The red and blue curves represent the position of the head and the caudal part the tail respectively. The white dot indicates the location of the paramecia. The larva continuously ad-justs its trajectory to the prey location during the prey capture sequence. Adapted from Patterson et al. (2013).
Phototaxis
Phototaxis is the ability of an organism to move toward (positive phototaxis) or away (negative phototaxis) from a light source. Phototactic responses are observed across taxa, from bacteria and plants to vertebrates. This basic form of goal-directed behav-ior is also present in the zebrafish larva (Figure 1.9.A,B).
Using fine behavioral characterizations of wild-type and mutant larvae, the lat-ter showing a selective disruption of the retinal ON or OFF pathways, Burgess et al. (2010) showed that two distinct retinal pathways are driving phototaxis. ON retinal
ganglion cells are active following an increase in light intensity. They control the rate of approach by activating forward scoots. The OFF pathway, sensitive to the decay in lighting deploys contralateral turns. A simple input-output relationship would thus be enough to account for the trajectory of the larva toward the light (Figure 1.9.C).
Recent behavioral studies have shown a form of phototaxis performed by larvae in absence of a spatial gradient (Chen and Engert, 2014). In this setup, the presence of a larva inside a virtual border (circle) caused the whole field to be illuminated, and when the larva stepped out of this border, the light was turned off (Figure 1.9.D). After swimming out of the circle, the larva was capable of returning to the illuminated area in a directed manner (Figure 1.9.D). To explain this rudimentary form of path integration, the authors employed two hypotheses : 1) A mechanism similar to the ON/OFF pathways, where the larva preferentially performs turns (respectively for-ward scoots) following an illumination intensity decay (respectively increase) (Figure
1.9.E). But this explanation is not sufficient to account for the ability of larvae to
re-turn inside the virtual border by performing an efficient re-turn 70% of the time (Figure
1.9.F). 2) The mechanisms employed to explain the efficiency of turn relied on the
larva’s ability to integrate some information about its recent swimming history (over ∼7s).
Building a robot performing phototaxis is straightforward, it just requires to con-nect two light detectors with contralateral wheels. Unlike this simple mechanisms, the detailed analysis of phototaxis behavior in larval zebrafish sheds light on the complex navigation strategy at play that cannot be trivially reduced to successive mapping between light intensity and motor commands.
1.4 Large-scale analysis of circuit dynamics underlying behavior in zebrafish larva 27
Fig. 1.9: Phototaxis in zebrafish larva. (A) Scheme showing the phototaxis be-havior, larvae are maintained under uniform illumination and tested for phototaxis by changing to a dark field with a light spot. The trajectories of nine larvae in this essay are superimposed. (B) Mean larval distance to the target at 0.5 s intervals.
(C) Scheme of the mechanisms required for the larvae to perform phototaxis. The
retinal OFF pathway activates turn in the contralateral direction following a de-crease in light intensity. The retinal ON pathway activates forward swim following an increase in light intensity. (D) Upper panel: Scheme of temporal phototaxis, the uniform illumination is turned off when the fish exits the virtual circle (red dashed line) and turned on again when the fish returns. Lower panel: trajectory of a larva during the essay. On the right: a close up view of the trajectory segments close to the border. (E) Turning-angle distributions from on larva. Upper panel: all turns in light. Lower panel: the first turn after Light-to-dark transition. (F) Upper panel: illustration of "efficient" vs "inefficient" turns. In order to return to the light, the di-rection shown by the green arrow is more efficient than the red arrow. Lower panel: histogram of the per-fish "efficiency", the red dashed line marks the 50/50 probabil-ity, the dashed cyan line marks the mean of the distribution. Adapted from Burgess et al. (2010) and Chen and Engert (2014).
1.5 Main aims
Most investigations on brain functions have focused on local circuits and S/R asso-ciations (Sompolinsky, 2014). However, this framework is limited for understanding behaviors that cannot be decomposed as a series of input-output association. The zebrafish model provides the opportunity to study neuronal activity simultaneously from multiple brain regions. This advantage may help to shed light on the complex, non-linear and contextual effects underlying brain functions during behavior.
In the first part of this manuscript, I presented a method for VR in zebrafish larva. This flexible behavioral paradigm enables the study of the chaining of locomotor patterns underlying different goal-directed tasks: the optomotor response and prey tracking. I also demonstrated how the timing of the visual feedback resulting from motor actions is critical for the success of prey capture.
Experiments on spontaneous actions provide animals with restricted behavioral options. This approach does not account for the decision-making process underlying the complex temporal pattern of spontaneous actions occurring in natural behaviors such as foraging. Zebrafish larva spontaneously generates movements in the absence of sensory stimulation. Taking advantages of its small locomotor repertoire, I first quan-titatively described the complex temporal patterns of spontaneous tail bouts. Then, using selective plane microscopy, I monitored the neuronal activity from large portions of the zebrafish brain preceding the onset of spontaneous movements. Preliminary re-sults indicate that the selection of spontaneous locomotor action and their timing are specified by different population of neurons.
Being virtually killed by virtual laser in virtual space is just as effective as the real thing, because you are as dead as you think you are.
Douglas Adams (1992). Mostly Harmless
Chapter 2
A visual virtual reality system for
the zebrafish larva
2.1 Introduction
The use of VR in zebrafish larva gives the opportunity to shed light on the role of sensory feedback during goal-directed behaviors. Moreover, the combination of VR with functional imaging would be useful to learn about the dialogue between the sensory and motor circuits.
In walking animals, leg movements can be measured using a spherical treadmill in head-fixed preparations (Figure 1.3). On the contrary, obtaining a readout of the dis-placement intended by the tail movements of a zebrafish larva is not a straightforward task. I developed a method to relate the tail movement kinematics to the intended dis-placements of the larva, in a visual virtual environment, where the larva can perform goal directed behavior. Recent works have used virtual reality in zebrafish larva (Por-tugues and Engert (2011), Ahrens et al. (2012b), Ahrens et al. (2013a), Vladimirov et al. (2014), Trivedi and Bollmann (2013)).
Two options were used to record motor activity illustrated in Figure 2.1. The first option is to use "fictive swim", which involves recording in a bundle of motor neuron axons (Ahrens et al. (2012b), Ahrens et al. (2013a), Vladimirov et al. (2014)). Larvae turn using asymmetric tail oscillations. Therefore, the direction of the intended movement was obtained by comparing the intensity of the signal recorded from both sides of the tail. This method enabled larva to perform phototaxis and optomotor response in a virtual 2D environment. The alternative is to monitor the tail movements, when the larva is head-embedded in low melting point agarose using a high-speed