HAL Id: tel-01928470
https://hal.univ-lorraine.fr/tel-01928470
Submitted on 18 Nov 2020
HAL is a multi-disciplinary open access archive for the deposit and dissemination of sci-entific research documents, whether they are pub-lished or not. The documents may come from teaching and research institutions in France or abroad, or from public or private research centers.
L’archive ouverte pluridisciplinaire HAL, est destinée au dépôt et à la diffusion de documents scientifiques de niveau recherche, publiés ou non, émanant des établissements d’enseignement et de recherche français ou étrangers, des laboratoires publics ou privés.
Pronostic factors on MRI in patients with acute
ischemic stroke
Yu Xie
To cite this version:
Yu Xie. Pronostic factors on MRI in patients with acute ischemic stroke. Human health and pathology. Université de Lorraine, 2018. English. �NNT : 2018LORR0143�. �tel-01928470�
AVERTISSEMENT
Ce document est le fruit d'un long travail approuvé par le jury de
soutenance et mis à disposition de l'ensemble de la
communauté universitaire élargie.
Il est soumis à la propriété intellectuelle de l'auteur. Ceci
implique une obligation de citation et de référencement lors de
l’utilisation de ce document.
D'autre part, toute contrefaçon, plagiat, reproduction illicite
encourt une poursuite pénale.
Contact : [email protected]
LIENS
Code de la Propriété Intellectuelle. articles L 122. 4
Code de la Propriété Intellectuelle. articles L 335.2- L 335.10
http://www.cfcopies.com/V2/leg/leg_droi.php
Ecole Doctorale BioSE (Biologie-Santé-Environnement)
Thèse
Présentée et soutenue publiquement pour l’obtention du titre de
DOCTEUR DE l’UNIVERSITE DE LORRAINE
Mention : « Sciences de la Vie et de la Santé »
par
Yu XIE
Facteurs Pronostiques en IRM chez les Patients Présentant un
Accident Vasculaire Cérébral Ischémique Aigu
S
outenance le 05 Novembre 2018
Membres du jury :
Rapporteurs : Pr Jean-Marc OLIVOT Université Toulouse III-Paul Sabatier, Toulouse
Pr Valérie WOLFF Université de Strasbourg, Strasbourg
Examinateurs : Dr Gabriela HOSSU Université de Lorraine, Nancy, co-directrice de thèse Pr Serge BRACARD Université de Lorraine, Nancy, directeur de thèse Pr Jean-Marc CONSTANS Université de Picardie Jules Verne, Amiens Pr Sébastien RICHARD Université de Lorraine, Nancy
Invitée : Pr Catherine OPPENHEIM Université Paris Descartes, Paris
---
Laboratoire d’Imagerie Adaptative Diagnostique et Interventionnelle – INSERM U1254 Bâtiment Recherche, CHRU de Nancy Brabois, Rue du Morvan,
1
Table of Contents
Table of Contents ... 1 Acknowledgements ... 5 List of Abbreviations ... 9 List of Figures ... 13 List of Tables ... 17 General introduction ... 19Chapter 1: Background and state of the art ... 25
1.The brain and ischemic stroke ... 27
1.1.The anatomy and vasculature of the brain ... 27
1.2.Epidemiology of stroke ... 28
1.3.Pathophysiology of ischemic stroke ... 28
1.4.Treatment of ischemic stroke ... 30
1.5.Functional assessment scale for the evaluation of ischemic stroke ... 31
1.5.1.National Institutes of Health Stroke Scale (NIHSS)... 32
1.5.2.Modified Rankin Scale (mRS) ... 32
2.Utilization of MRI in ischemic stroke evaluation ... 32
2.1.Basic concepts of MRI ... 33
2.1.1.T1 and T2 relaxation and contrast ... 33
2.1.2.Spin echo sequence ... 34
2.2.Common MRI sequences used in ischemic stroke ... 35
2.2.1.DWI ... 35
(1). Principle of DWI ... 35
(2). DWI in ischemic stroke ... 37
2.2.2.PWI ... 43
(1). Principle of PWI ... 43
(2). PWI in ischemic stroke ... 46
2.2.3.PWI-DWI mismatch ... 47
2.2.4.T2-FLAIR sequence ... 50
2.2.5.T2*-weighted image ... 51
2.2.6.MR angiography ... 53
3.Synopsis of THRACE study ... 53
3.1.Objective ... 53
3.2.Patients inclusion ... 54
3.3.Procedures of the study ... 54
3.4.Main results of THRACE study ... 55
4.Working environment ... 56
2
4.2.CIC-IT ... 56
Chapter 2: The role of MRI in the evaluation of brain tissue viability ... 59
Introduction ... 61
Article 1 ... 62
Discussion ... 77
Résumé en français ... 79
Chapter 3: Pretreatment ischemic stroke lesional volume and clinical outcome ... 83
Introduction ... 85
Article 2 ... 87
Article 3 ... 95
Discussion ... 101
Résumé en français ... 104
Chapter 4: Ischemic stroke lesional location and functional outcome ... 109
Introduction ... 111
Article 4 ... 113
Discussion ... 128
Résumé en français ... 13030
Chapter 5: General discussion ... 133
Summary of the results... 135
Strengths ... 136
Weaknesses ... 137
Implications for the future research ... 139
References ... 133
Résumé de la thèse en français ... 153
Appendix ... I NIHSS ... IIII mRS... VII Inclusion and Exclusion criteria for THRACE study ... VIII Abstract ... i
5
Acknowledgements
This thesis represents not only my work, but also the ten years of efforts of the THRACE study group. I have received various help and support from many people, without whom I could not accomplish this work. I am grateful to all of them who made this thesis possible in one way or another.
First, I would like to express my sincere gratitude to my supervisor, Professor Serge Bracard, for accepting me in the THRACE trial research group, for his supervision and continuous support during my PhD, for discussing with me, for his immense knowledge, and for inspiring me to want to become a clinical scientist like him.
Meanwhile, I would like to thank my co-supervisor, Dr. Gabriela Hossu, for her patience and support of my PhD study and research. She was always full of energy and ready to help me when I had problems. She guided me in each step of my progress and encouraged me to continue my work. She also taught me how to become a better person.
Also, I would like to thank Professor Jacques Felblinger, the director of the laboratory IADI, for accepting me in the laboratory and providing me the access to all the resources to finish my work. I felt like being in a family in the laboratory. He also taught me how to cooperate with others and to work in a team.
I would like to thank the examiners of my thesis: Professor Jean-Marc Olivot and Professor Valérie Wolff; and the other members of the jury: Professor Catherine Oppenheim, Professor Jean-Marc Constans and Professor Sébastien Richard. I am grateful that they have accepted to examine my thesis. I am impressed by the extent of their knowledge and their earnest manner for scientific work. Their invaluable advices greatly improved my thesis. I hope I can have more opportunities to learn from them in the future.
I would like to thank the team of IADI and CIC-IT: Bailiang Chen, Emilien Micard, Marine Beaumont, Aboubaker Cherifi, Damien Husson, Julien Oster, Ioannis Douros, Marc Fauvel, Yohan Damas, Freddy Odille…Thanks for their great help in my work. They encouraged me a lot to finish my thesis. It was fantastic to be surrounded by and work with such a group of people. In particular, I would like to thank Bailiang Chen, for her help and invaluable advices in every aspect of my life, for her continuous support during these years. She is more than a colleague for me.
6 I would like to thank Liang Liao and Vincent Gautheron, for their patience, kindness and availability for my questions. It is a pleasure to cooperate with them.
I would like to thank Professor Francis Guillemin and Marc Soudant for their help in statistical analysis.
I would like to thank the administration team: Céline Fournier, Laura Colle, Caroline Diot and Aline Weber, for your great help.
I am grateful to the China Scholarship Council for funding my PhD.
A special gratitude to my dear friends: Maya, Sarra, Claire, Antoine, Ernesto, Lin, Yun, Mengmeng, Pan, Xing, Jie, Caifeng, Jianying, Yuanzhao, Yuncheng, Hang, Qi, Yixing, Shengzhao. It was a great pleasure to have you all by my side during my PhD.
Last but not the least, I would like to express my appreciation to my parents, my grandparents, my brother and my nephew, for their support, understanding, love and for believing in me.
9
List of Abbreviations
ADC Apparent Diffusion Coefficient
AIF Arterial Input Function
ASPECTS Alberta Stroke Program Early CT Score AUC Area Under the Curve
AVC Accident Vasculaire Cérébral
CBF Cerebral Blood Flow
CBV Cerebral Blood Volume
CI Confidence Interval
CSF CerebroSpinal Fluid
CT Computed Tomography
DWI Diffusion weighted imaging
DSC Débit Sanguin Cérébral
EPI Echo-Planar Imaging
FDA Food and Drug Administration
FLAIR FLuid-Attenuated Inversion Recovery
ICA Internal Carotid Artery
IVT Intravenous thrombolysis
IVTMT Intravenous thrombolysis and mechanical thrombectomy
MCA Middle Cerebral Artery
MRI Magnetic Resonance Imaging
mRS modified Rankin Scale
mTICI modified Thrombolysis in Cerebral Infarction
MTT Mean Transit Time
NIHSS National Institutes of Health Stroke Scale
NINDS National Institute of Neurological Disorders and Stroke
PET Positron Emission Tomography
PWI Perfusion weighted imaging
RCT Randomized Clinical Trials
ROC Receiving Operating Characteristic
rtPA recombinant tissue Plasminogen Activator
10
SVM Support Vector Machine
T2WI T2-Weighted Image
THRACE THRombectomie des Artères CErébrales
Tmax Time to maximum
TOF Time-Of-Fight
TOAST Trial of Org 10172 in Acute Stroke Treatment
TTM Temps de Transit Moyen
TTP Time To Peak
VLP Volume Lésionnel Prétraitement
13
List of Figures
Figure 1 The major arteries of the brain
Figure 2 Schema of ischemic core/penumbra/oligemia model in ischemic stroke
Figure 3 Diagram of cerebral blood flow threshold and duration of ischemia for different tissue compartments in ischemic stroke
Figure 4 Relaxation of T1 and T1 weighted contrast
Figure 5 Relaxation of T2 and T2 weighted contrast
Figure 6 Schema of the spin echo sequence
Figure 7 Schema of the diffusion-weighted spin echo sequence
Figure 8 Zig-zag traversal of k-space in echo-planar imaging (EPI) technique
Figure 9 Example of DW image and ADC map
Figure 10 Schema presenting cytotoxic edema after ischemic stroke
Figure 11 MRI performed 2 hours after the onset of the ischemic stroke
Figure 12 Clinical outcome is associated with stroke location.
Figure 13 A: Diagram demonstrating the hemodynamic of the contrast agent obtained with dynamic susceptibility contrast -MRI
B: Example of the signal intensity-versus-time curve in a stroke patient with left middle cerebral artery occlusion
Figure 14 The contrast agent concentration-versus-time curve (after deconvolution)
Figure 15 PWI of an ischemic stroke patient with occlusion of left MCA within 4 hours of symptom onset
Figure 16 Schema demonstrating the PWI-DWI mismatch
Figure 17 FLAIR and DWI images of an acute ischemic stroke patient imaged after 3 hours of symotom onset
Figure 18 An acute ischemic stroke patient with occlusion of right middle cerebral artery (shown on TOF)
Figure 19 Intraluminal thrombus detected within the left MCA (arrow) on T2* in an acute ischemic stroke patient
Figure 20 Baseline and follow-up imaging of a lobar microbleed-only patient who later developed intracerebral hemorrhage
Figure 21 Images demonstrating the occlusion of the proximal right MCA in an acute ischemic stroke patient
14
Figure 22 THRACE trial profile
Figure 23 Patient selection flowchart
Figure 24 Examples of ROIs
Figure 25 ROC curves showing the role of different parameters in distinguishing the regions presented as normal tissue on day-7 images and those evolved into infarction in initial abnormal diffusion areas.
Figure 26 ROC curves showing the role of different parameters in distinguishing the regions presented as normal tissue on day-7 images and those evolved into infarction in PWI-DWI mismatch areas.
Figure 27 Workflow of lesion location determination
Figure 28 Patient selection flowchart
Figure 29 F1 score obtained on the average training and validation sets during
17
List of Tables
Table 1. Trials on PWI-DWI mismatch in patients treated by thrombolysis or thrombectomy Table 2. Parameters of MRI sequences
Table 3. Baseline characteristics of ischemic stroke patients Table 4. Parameter values in different ROIs
Table 5. Baseline characteristics and functional outcome of left- vs right-hemisphere
stroke patients
19
General introduction
21 Stroke is a major cause of death and disability worldwide. Of all stroke patients, about 87% are ischemic (1). The challenge for ischemic stroke treatment is to restore blood supply in the early stage and to salvage the ischemic “penumbra”, i.e. brain tissue at the risk of infarction but not infarcted yet (2). To date, the two Food and Drug Administration (FDA) approved treatments are intravenous thrombolysis by recombinant tissue plasminogen activator (rtPA) and mechanical thrombectomy (3). It is crucial to select appropriate patients for therapy based on an assessment of treatment benefit and risk. Stroke imaging plays an important role in diagnosing and guiding treatment strategies in the acute phase. The main goals are to rule out intracranial hemorrhage, define the ischemic penumbra and visualize the vessel status. Magnetic resonance imaging (MRI) is one of the most efficient stroke imaging modalities. The overall aim of this thesis is to investigate the prognostic value of MRI in acute ischemic stroke evaluation for clinical outcome. We will focus on two essential sequences in ischemic stroke assessment: diffusion weighted imaging (DWI) and perfusion weighted imaging (PWI) (4). We first studied the prediction of the brain tissue viability after ischemic stroke by using pretreatment DWI and PWI parameters. Then the predictive role of pretreatment DWI in terms of lesional volume for clinical outcome was investigated. In the end, ischemic lesion location distribution measured on pretreatment DWI was analyzed to provide more accurate prediction for functional outcome.
The thesis will be presented in an article-based form organized in the following order:
In Chapter 1, we will provide an overall background and the state of art of our work. We first present the anatomy and vasculature of the brain, the epidemiology, the pathophysiology, the treatment and the assessment scale of ischemic stroke. This part is followed by a brief introduction of the basic concept of MRI and the common sequences clinically used in ischemic stroke assessment: DWI, PWI, fluid-attenuated inversion recovery (FLAIR), T2*
-weightedimaging and magnetic resonance angiography. The concept and application of PWI-DWI mismatch will be explained afterwards. In the end, we will introduce the THRACE (THRombectomie des Artères CErébrales) study of which this thesis work is a part.
In Chapter 2, the role of different DWI and PWI derived parameters in the evaluation of brain tissue viability is investigated. We analyzed 36 patients selected from THRACE study who underwent both baseline DWI and PWI and day-7 images. Our results suggested that apparent diffusion coefficient and relative cerebral blood flow were potential candidates for
22 predicting tissue viability in acute ischemic stroke, in both initial abnormal diffusion areas and PWI-DWI mismatch areas.
In Chapter 3, the relationship between pretreatment ischemic stroke lesional volume and clinical outcome is studied. Lesional volume was semi-automatically segmented on pretreatment DWI in 298 patients from the THRACE study. Logistic regression was applied to fit the clinical outcome as a function of lesional volume. We demonstrated that pretreatment lesional volume was an independent predictor for functional outcome in acute ischemic stroke with proximal intracranial occlusion. In addition, our results revealed that the clinical benefit of adding mechanical thrombectomy to thrombolysis decreased with the increase of pretreatment lesional volume. Then, we searched for baseline parameters associated with favorable outcome in patients with a large lesional volume (> 70 mL and 100 mL). The results revealed that patients with large pretreatment volume may still benefit from reperfusion therapy, especially those with isolated M1 occlusion or ischemia restricted to the superficial middle cerebral artery (MCA) territory.
In Chapter 4, the impact of pretreatment ischemic location on functional outcome after thrombectomy is investigated. 143 ischemic stroke patients who received intravenous thrombolysis plus mechanical thrombectomy in THRACE study were included in this analysis. Ischemic lesions were segmented on pretreatment DWI. Regional ischemic locations were defined based on brain atlases. Ischemia percentage in each region was calculated. Logistic regression and support vector machine were applied to model the influence of age, baseline National Institutes of Health Stroke Scale and lesional volume, as well as stroke location on functional outcome. The results demonstrated the important role of pretreatment lesion location in functional outcome prediction. Compared to using only age, baseline National Institutes of Health Stroke Scale (NIHSS) score and lesional volume, together with the lesion location improved the prediction accuracy of functional outcome (from 70.5% to 77.3%).
In Chapter 5, we will give an overall discussion of our work, including the strengths and weaknesses of this work. A conclusion of accomplished work is presented. The implications for future research is addressed in the end.
23 This work was carried out in the laboratory IADI (Imagerie Adaptative Diagnostique et Interventionnelle), under the direction of Professor Jacques Felblinger. This thesis is directed by Professor Serge Bracard and Doctor Gabriela Hossu.
Four scientific papers have been written based on the work:
1. Xie Y, Oppenheim C, Guillemin F, Gautheron V, Gory B, Raoult H, Soize S, Felblinger J, Hossu G, Bracard S. Pretreatment Lesional Volume Impacts Clinical Outcome and Thrombectomy Efficacy. Ann Neurol. 2018;83(1):178-185. doi: 10.1002/ana.25133. 2. Gautheron V, Xie Y, Tisserand M, Raoult H, Soize S, Naggara O, Bourcier R, Richard S,
Guillemin F, Bracard S, Oppenheim C. Outcome After Reperfusion Therapies in Patients With Large Baseline Diffusion-Weighted Imaging Stroke Lesions: A THRACE Trial (Mechanical Thrombectomy After Intravenous Alteplase Versus Alteplase Alone After Stroke) Subgroup Analysis. Stroke. 2018;49(3):750-753.
3. Xie Y, Oster J, Micard E, Chen B, Douros I, Liao L, Soudant M, Felblinger J, Guillemin F, Hossu G, Bracard S. Impact of Pretreatment Ischemic Location on Functional Outcome after Thrombectomy. Submitted.
4. Xie Y, Liao L, Guillemin F, Chen B, Felblinger J, Hossu G, Bracard S. Role of diffusion
and perfusion parameters in predicting tissue viability in acute ischemic stroke. Submitted.
The results were presented in the following conferences:
1. Xie Y, et al. L’IRM de diffusion et de perfusion dans l’évaluation de la viabilité des tissus cérébraux chez les patients présentant un accident vasculaire cérébral ischémique à la phase aigüe. 44ème congrès annuel de la société française de neuroradiologie. Mar. 22-24, 2017. Oral presentation.
2. Xie Y, et al. Impact of pretreatment ischemic location on functional outcome after mechanical thrombectomy in acute ischemic stroke. International stroke conference. Jan. 24-26, 2018. Poster.
3. Xie Y, et al. Association between diffusion weighed imaging measured pretreatment ischemic volume and functional outcome in ischemic stroke. ISMRM-ESMRMB. Jun.16-21, 2018. Poster.
25
Chapter 1
27
1. The brain and ischemic stroke
1.1. The anatomy and vasculature of the brain
The brain, a gelatinous mass, is one of the most complex organs in the body. It is made up of about 86 billion neurons and 85 billion nonneuronal cells (5). The brain is divided into the cerebrum, brainstem, and cerebellum. The cerebrum includes the paired cerebral hemispheres and the diencephalon. The brainstem comprises the midbrain, pons, and medulla (6). The blood supply of the brain depends on two major sources: internal carotid artery (ICA) and vertebral arteries. The ICA gives rise to the anterior and middle cerebral arteries. The vertebral arteries come together at the level of the pons to form the basilar artery, which then divided into posterior cerebral arteries. The circle of Willis provides an important communication between the two major sources and improves the chance of brain to receive blood if one of the arteries is occluded (7). (Figure 1)
Figure 1. The major arteries of the brain. (A) Ventral view. The enlargement of the boxed area shows the circle of Willis. Lateral (B) and (C) midsagittal views showing anterior, middle,
28 and posterior cerebral arteries. (D) Idealized frontal section showing course of middle cerebral artery. Ref (7)
1.2. Epidemiology of stroke
Stroke is a “rapidly developed clinical signs of focal (or global) disturbance of cerebral function, lasting more than 24 hours or leading to death, with no apparent cause other than of vascular origin” (8). In 2015, prevalence of stroke was 43.6 million, with 5.2 million people having a first stroke < 65 years of age. Stroke is the second-leading global cause of death, accounting for about 12% of total deaths worldwide (1). With the population aging, the number of patients suffered from stroke will continue to augment.
1.3. Pathophysiology of ischemic stroke
Stroke can be classified into two categories: ischemic and hemorrhagic stroke. Of all the strokes, about 87% are ischemic stroke. It occurs as a result of a thrombotic or embolic occlusion of a cerebral artery, resulting in a corresponding neuron death and loss of neurologic function. Ischemic stroke can be categorized by TOAST (Trial of Org 10172 in Acute Stroke Treatment) subtype classification: large-artery atherosclerosis; cardioembolism; small-vessel occlusion; stroke of other determined etiology; stroke of undetermined etiology (9). About 25~35% of ischemic strokes present with large-artery occlusion.
Sufficient blood supply to the brain tissue is important to maintain the neuronal activity. The energy consumption of brain is high: the brain comprises about 2% of the body mass but consumes about 20% of the total oxygen. With the occlusion of the artery and the decrease of the blood supply, 3 compartments of hypoperfused brain tissue can be distinguished according to the severity of ischemia (Figure 2):
1) Ischemic core: tissue with severe hypoperfusion, which is irreversibly infarcted.
2) Penumbra: tissue with severe hypoperfusion, which is at the risk of infarction but still have the potential to be salvaged if the blood supply is restored in time.
3) Benign oligemia: tissue with moderate hypoperfusion, which is not at the risk of infarction.
29 Figure 2. Schema of ischemic core/penumbra/benign oligemia model in ischemic stroke. After the occlusion of artery, 3 compartments of hypoperfused brain tissue can be distinguished according to the severity of ischemia: core, penumbra and oligemia. (Image is modified from http://www.strokecenter.org/patients/about-stroke/ischemic-stroke/)
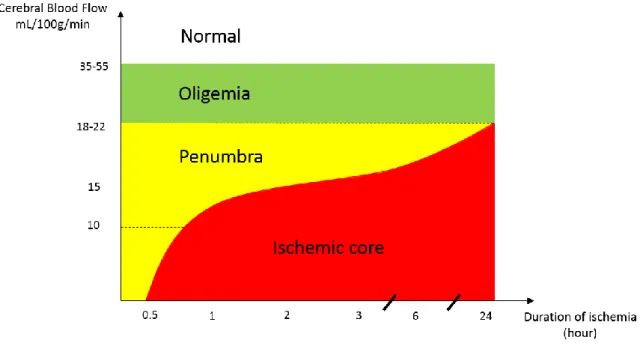
There are two blood flow thresholds for the ischemic brain tissue evaluation: threshold for reversible failure of neuronal electrical function and irreversible failure of energy metabolism and ion pumping. Branston et al. demonstrated that the evoked somatosensory potential recorded in baboon cortex was abolished when local cerebral blood flow (CBF) reduces to 15 mL/100g/min (10). The massive release of intercellular K+, which is indicative of ion pump
failure, occurs at a further reduced level of CBF (about 6 mL/100g/min) (11). The term “ischemic penumbra” was initially described by Astrup et al. (2). This is a region with blood flow between the upper threshold of electrical failure and the lower threshold of energy failure and ion pump failure. Thus, penumbra is described by electrical silence with normal or only slightly elevated extracellular potassium concentration. The development of penumbra to irreversible morphological damage is determined by the severity and duration of ischemia, and their combined influence (12). Through simultaneous recordings of the cortical neuronal activity and local blood flow, we can depict the residual blood flow and duration of ischemia thresholds for the development of cell damage (13). (Figure 3)
30 Infarct progression is time dependent: during the acute phase, the injury of the core tissue is a direct consequence of the ischemia-induced energy failure; in the subacute phase, the irreversible damage expands into the penumbra area; in the delayed phase, vasogenic edema, inflammation and programmed cell death may contribute to further damage, which last for several days or even weeks (14).
During the early phase, penumbra has the potential for functional recovery without morphological damage when the CBF is reestablished in a certain time window. It is the principle target for reperfusion treatment.
Figure 3. Diagram of cerebral blood flow threshold and duration of ischemia for different tissue compartments in ischemic stroke. Modified according to Heiss W-D (13).
1.4. Treatment of ischemic stroke
The goal of treatment for ischemic stroke is to restore the blood supply at the early phase and to salvage the ischemic penumbra. The term “time is brain” has been widely adopted. A study showed that patient loses 1.9 million neurons each minutes when the stroke is untreated (15). The therapy includes intravenous administration of thrombolytic drugs and the use of various thrombectomy devices under angiographic guidance to remove the thrombus.
NINDS (National Institute of Neurological Disorders and Stroke) trial proved that despite an increased incidence of symptomatic intracerebral hemorrhage, treatment with intravenous
31 rtPA within 3 hours improved the clinical outcome (16). This is the first FDA-approved therapy for acute ischemic stroke. Then ECAS III trial extended the treatment time window to 4.5 hours (17,18). Tenecteplase is a thrombolytic agent which is more specific for fibrin and has a longer half-life compared to Alteplase. Currently, some clinical trials on tenecteplase are underway (3). However, systemic thrombolysis has several limitations, such as the narrow therapeutic time window and contraindications (e.g., recent major surgery, coagulation abnormalities or history of intracranial hemorrhage) (19). Moreover, thrombolysis is much less effective in patients with proximal artery occlusion. Early recanalization after intravenous thrombolysis only occurs in about one third of patients with proximal occlusion (20,21). Endovascular thrombectomy is a reperfusion strategy different from pharmacologic fibrinolysis. It uses a device to remove the clot directly and restore the blood supply. Results from IRM III, SYNTHESIS, and MR RSCUE trials failed to show the significant benefit of endovascular therapy (22–24). In 2015, 5 landmark clinical trials proved the efficacy of additional endovascular thrombectomy over intravenous rtPA alone in acute ischemic stroke patients with occlusion of the proximal anterior circulation (25–29). The main differences of these 5 trials compared to the early studies are the patient selection criterion (only patients with proximal cerebral artery occlusion were included) and the use of new generation devices. The analysis of the pooled data of these 5 trials demonstrated the benefit of endovascular thrombectomy (30). THRACE study and PISTE study also presented the advantage of mechanical thrombectomy (31,32). A meta-analysis of 21 randomized trials found that endovascular therapy significantly improved functional outcome at 90 days and reduced the mortality (33). A meta-analysis analyzing the 5 landmark trials showed that benefit of thrombectomy became insignificant after 7.3 hours of symptom onset (34). In 2018, DAWN and DEFUSE 3 trails brought new perspective on the treatment window of thrombectomy (35,36). Selected patients up to 24 hours after symptom onset may still benefit from thrombectomy using Trevo clot retriever device. Nowadays, with the development of endovascular thrombectomy, more patients can benefit from treatment.
1.5. Functional assessment scale for the evaluation of ischemic stroke
Assessment scales can help clinicians estimate the severity of ischemic stroke, set realistic therapy strategies and goals. Many assessment tools are available to evaluate ischemic stroke. We will focus on two scales that are most commonly used.
32
1.5.1. National Institutes of Health Stroke Scale (NIHSS)
The NIHSS was developed in 1989 and is now widely employed in clinical practice and research. It provides a measurement of acute stroke severity by testing various domains of neurological function. The NIHSS is a 15-item scale that incorporates assessment of consciousness, visual fields, eye movement, motor function, sensation, coordination, language, speech and neglect (37). (Appendix 1) It is an ordinal scale from 0 (no impairment) to a maximum of 42. It is a reliable, valid and time efficient assessment tool, for both neurologist and non-neurologist raters. Initial NIHSS score correlates with infarct size, in-hospital neurological and medical complication and 3-month clinical outcome (37–39). However, an important limitation of the NIHSS is that it places emphasis on deficits associated with dominant hemisphere function rather than non-dominant hemisphere function or posterior circulation (40–42). Analysis has shown that patients with right-sided stroke have a low NIHSS score despite substantial DWI lesion volume (41). Besides, an individual can score 0 on the NIHSS, despite having evidence of ischemic stroke, particularly in the posterior circulation territory (42). Overall, NIHSS is a powerful tool for stroke severity evaluation.
1.5.2. Modified Rankin Scale (mRS)
The mRS is a global outcome disability scale that has been widely applied for evaluating functional independence following stroke (43). The mRS is an ordinal scale from 0 to 6, with higher value indicating more severe disability. (Appendix 2) It has been used as a valid and reliable end point in randomized clinical trials (RCTs) (44). However, the mRS has been criticized as an assessment tool accentuating the disability of motor performance rather than other areas of stroke recovery, such as language (45).
2. Utilization of MRI in ischemic stroke evaluation
As previously mentioned, the identification of penumbra is essential for guiding treatment decision-making of ischemic stroke. However, the concept of penumbra is based on experimental models and it is difficult to transfer into non-invasive imaging modalities. Positron emission tomography (PET) has been established as the gold standard to evaluate penumbra (46,47), while it is expensive and impractical for clinical practice. MRI is a useful modality for diagnosing ischemic stroke and determining treatment decision; it is widely used in routine clinical application (4,48).
33
2.1. Basic concepts of MRI
2.1.1. T1 and T2 relaxation and contrast
The MR measurements can be analyzed in terms of energy transfer. The process of the proton releasing energy that is absorbed from the radiofrequency named as relaxation. Two relaxations times of tissue can be measured: T1 and T2.
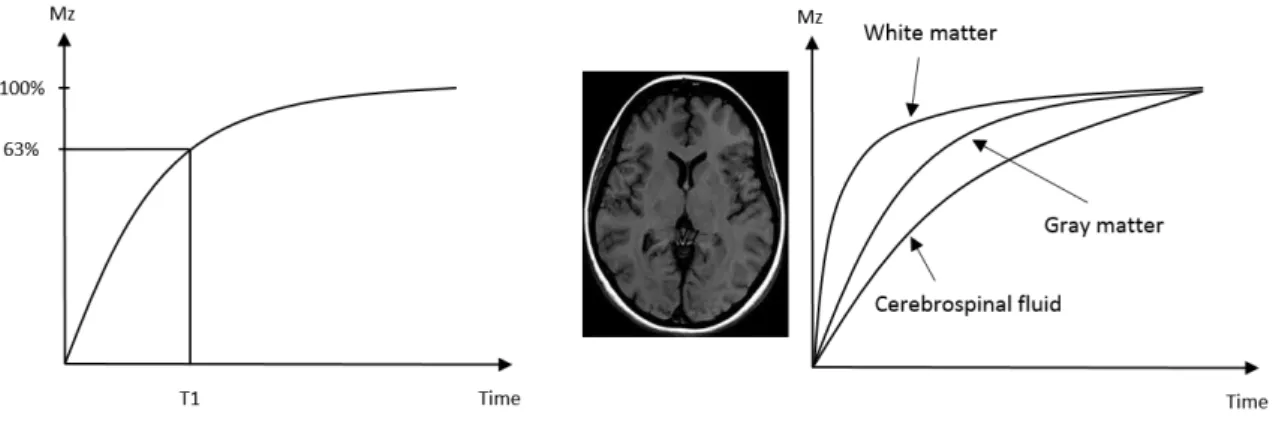
The relaxation time T1 is the time required for the longitudinal magnetization (Mz) to return
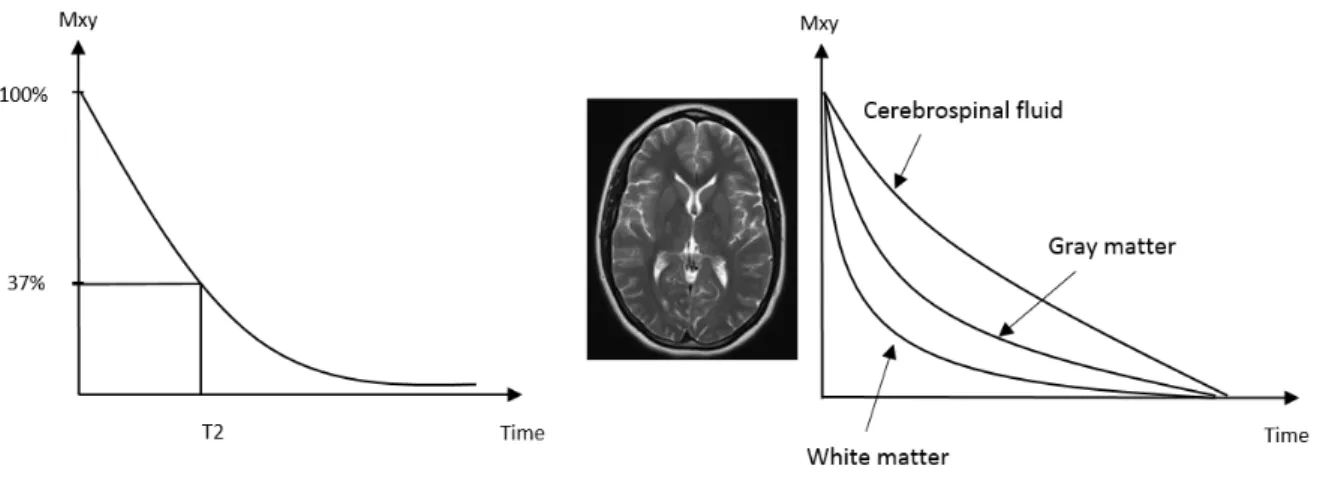
to 63% of its original value following an excitation pulse. In the brain, white matter has a very short T1 and relaxes rapidly. Cerebrospinal fluid (CSF) has a long T1 and relaxes slowly. Gray matter has an intermediate T1. The contrast mechanism that we create an image at a time when T1 curves are widely separated is termed T1-weighted image (49). (Figure 4) The relaxation time T2 is the time required for the transverse magnetization (Mxy) to decay to 37% of its initial value. Different tissue has different values of T2. White matter has a short T2 and dephases rapidly. CSF has a long T2 and dephases slowly. Gray matter has an intermediate T2. T2-weighted image (T2WI) is obtained when T2 curves are widely separated (49). (Figure 5)
Figure 4. Relaxation of T1 and T1 weighted contrast. T1 is a characteristic of tissue and is defined as the time required for the longitudinal magnetization (Mz) to return to 63% of the
original value following an excitation pulse. Different tissue has different T1 characteristic. If an image is obtained at a time when the relaxation curves are widely separated, the contrast is termed T1-weighted contrast. According to (49)
34 Figure 5. Relaxation of T2 and T2 weighted contrast. T2 is a characteristic of tissue and is defined as the time required for the transverse magnetization (Mxy) to decay to 37% of its
initial value. Different tissue has different T2 characteristic. If an image is obtained at a time when the relaxation curves are widely separated, the contrast is termed T2-weighted contrast. According to (49)
2.1.2. Spin echo sequence
The spin echo sequence is one of the fundamental MRI pulse sequences. A standard spin echo sequence consists of an excitation pulse (90°), which turns the Mz into Mxy (dephase), and a
180° pulse to rephase the spin. The rephasing of the spins formed an “echo” is called a spin echo (49,50). (Figure 6) The spin echo sequence is the base of the typical DWI sequence, which will be presented in the following text.
Figure 6. Schema of the spin echo sequence. The application of 90° radiofrequency pulse results in an immediate signal decay (free induction decay, FID). Then the application of 180° radiofrequency pulse will allow the spins to rephase and form an echo. (49)
35
2.2. Common MRI sequences used in ischemic stroke 2.2.1. DWI
(1). Principle of DWI
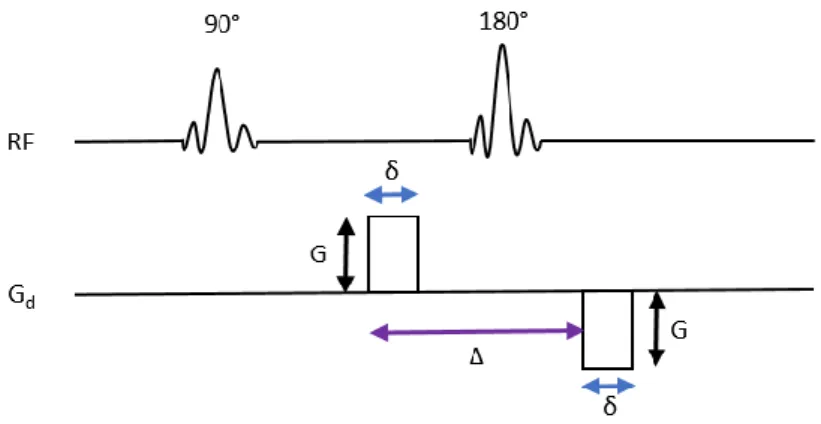
The diffusion of the water molecule in tissue follows a pattern according to the tissue organization. The alteration of tissue structure will disturb the water diffusion. Through evaluating the signal changes due to the diffusion alteration, we can detect the abnormalities. In 1965, E. O. Stejskal and J. E. Tanner proposed the sequence of DWI, wherein the diffusion of the water molecules was exploited (51). In 1986, Le Bihan et al. applied DWI on human brain for the first time (52). The most common approach of DWI is to use a spin echo T2-weighted pulse sequence, in which two equal and opposite diffusion gradients were applied before and after the 180° radiofrequency pulse. These gradients successively cause a dephasing and rephrasing of the proton of water molecule. (Figure 7) In case of no net movement of proton, both the gradient effects cancel out each other and there will be no signal attenuation. However, in case of the proton diffusion, there will be incomplete rephrasing of proton spin and also the signal attenuation. These signal attenuation can be presented on DW images by hyposignal regions (53,54). The signal loss from proton diffusion is given by Stejskal-Tanner equation:
S(b) = S0 e-bD
Where S(b) refers to the signal received from the particular gradient value b; S0 is the signal
strength without diffusion weighting (T2WI), D is the diffusion coefficient. The b-value is given by the equation:
b = γ2G2δ2 (Δ – δ/3)
Where γ is the gyromagnetic ratio of hydrogen proton, G is the magnitude of applied diffusion gradient, δ is the duration of the gradient, Δ is the time between the applications of the two gradients.
In order to minimize the effect of patient movement during acquisition, an echo-planar imaging (EPI) technique was used. It samples all the data points necessary for reconstruction of an image after application of a single radiofrequency excitation pulse. The whole k-space is sampled efficiently in a continuous trajectory. (Figure 8)
36 The true diffusion is the net movement of molecules due to a concentration gradient. However, molecular motion due to pressure gradients, thermal gradients or ionic interactions cannot be differentiated with MRI. Thus, we can only calculate the apparent diffusion coefficient (ADC) (55).
Tissue with high diffusion present as hyposignal on DW images while tissue with restricted diffusion are seen as hypersignal. Clinically, ADC maps, which can quantify diffusion, are derived from DW images with a certain b-value using Stejskal-Tanner equation. An example of DW images and ADC map of an ischemic stroke patient is presented in Figure 9.
Figure 7. Schema of the diffusion-weighted spin echo sequence. Two diffusion gradient pulses (denoted on diffusion gradient line, Gd) of amplitude G, duration of δ, interval of Δ
and opposite in direction, are applied before and after the 180° radiofrequency pulse (denoted on radiofrequency line, RF). Modified according to Chilla et al. (53).
Figure 8. Zig-zag traversal of k-space in EPI technique. The whole k-space is sampled efficiently in a continuous trajectory after application of a single radiofrequency excitation pulse. <http://mriquestions.com/echo-planar-imaging.html>
37 Figure 9. Example of DW image and ADC map in an acute ischemic stroke patient. From the spin echo T2 weighted image with b=0 (left), the DW image can be obtained after the application of diffusion gradient with b=1000 s/mm2 (middle). On the DW image, the region
where water diffusion is high (ex. the cerebrospinal fluid) presents as hyposignal, while region with restrict diffusion (ex. the left insula, lenticular nucleus and inferior temporal lobe as the red arrow indicates) presents as hypersignal. ADC map can be calculated from the previous images by using the Stejskal-Tanner equation (right).
(2). DWI in ischemic stroke
The time course of signal intensity on DWI and ADC is a dynamic event. Within minutes after ischemia, the decrease of cerebral blood flow causes the disruption of energy metabolism, leading to the failure of the Na+/K+ adenosine triphosphates pump and other ion
pumps. This leads to loss of ionic gradients and the translocation of water from extracellular to the intracellular compartment (cytotoxic edema, Figure 10). A restriction of water diffusion in extracellular space occurs, which presents as hypersignal on DW images and hyposignal on ADC map (55). This abnormality can be detected in the first hour following the ischemic stroke while there is still no abnormality on the computed tomography (CT) or other sequences on MRI, such as T2 or FLAIR. (Figure 11) After the initial decrease of ADC, there is a gradual increase of ADC value secondary to the cell lysis and vasogenic edema, with a return to the baseline value known as pseudonormalization around 3-10 days post-onset (56). The signal intensity on DW images is maximal at 40 hours after infarction and then gradually normalizes (57). But the normalization of signal intensity on DW images are delayed compared to ADC value, because DW signal is also influenced by T2 effect. During the
38 chronic stage, there is an increase of water diffusion and also increase in ADC value due to gliosis and cavitation resulted from tissue breakdown.
Figure 10. Schema presenting cytotoxic edema after ischemic stroke. The decrease of cerebral blood flow leads to the failure of the Na+/K+ adenosine triphosphates. The water molecules
translocate from extracellular to the intracellular, causing cell swelling. The water diffusion in extracellular space is restricted, which presents as hypersignal on DW images.
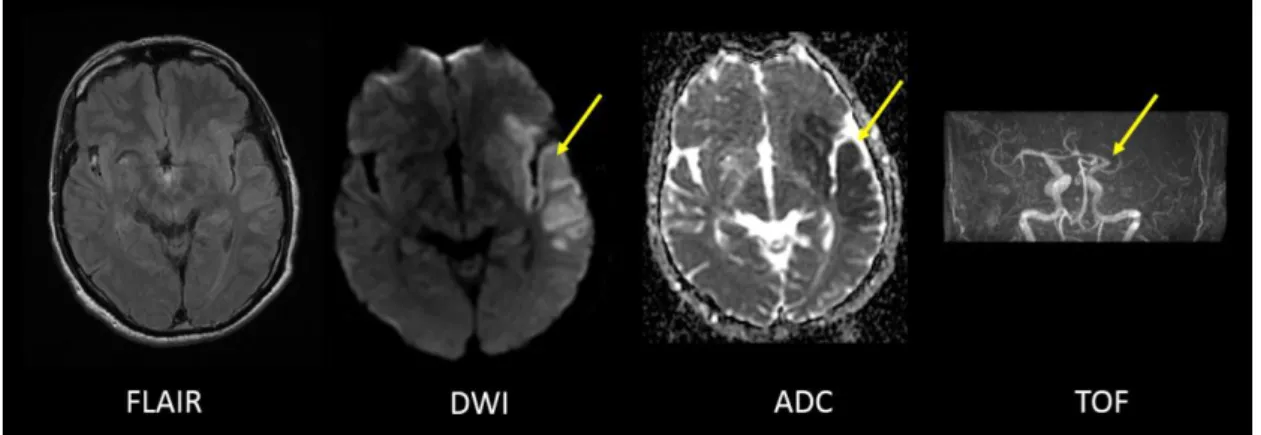
Figure 11. MRI performed 2 hours after the ischemic stroke onset. Only discrete hypersignal can be distinguished in the territory of left MCA on FLAIR sequence. Abnormality can be detected on DWI by distinct hypersignal region (arrow), and on ADC map by hyposignal region (arrow). Time of flight (TOF) sequence shows the occlusion of the left MCA (arrow). Currently, DWI is the most powerful sequence for diagnosing acute ischemic stroke with high sensitivity and accuracy (58). Its superiority over non-contrast CT at the acute stage (sensitivity 97% vs 40%, specificity 100% vs 92%) and over conventional MRI sequences (sensitivity 58%, specificity 100%) have been demonstrated (59). Studies showed that DWI can efficiently differentiate stroke with stroke mimics, which account for about one quarter of
39 suspected stroke patients, with different etiologies such as seizure, migraine, brain tumors, etc. (60,61). However, previous studies found that some ischemic stroke patients present false-negative DWI. False-negative DWI is associated with several clinicoradiologic factors. The site of infarction is an important factor: posterior circulation infarct patients are more likely to have negative DWI than anterior circulation infarct patients. Patients with history of smoking, higher initial blood pressure, higher fasting plasma glucose, and longer time to imaging after stroke onset are more likely to have positive DWI lesions (62). Besides, the intensity of magnetic field may also impact DW images, with 1.5 T presenting lower false-negative DWI than 3T (0.6% vs 6.1%) (63). Therefore, it is necessary to combine the DWI and other sequences, as well as the clinical information, before diagnosing the ischemic stroke. It was widely accepted that DWI lesion indicates the ischemic core or the eventual infarction. However, researchers demonstrated that DWI abnormality could also be reversed, especially in patients with early recanalization. In one study, 3 in 19 patients with acute stroke who underwent intra-arterial thrombolysis presented the reversal of DWI-hyperintense regions (64). In another study, 89/176 (50%) patients exhibited visually-detectable DWI lesion reversal compared to 24-hour images, with a median volume of 2.4 mL (0.5-8). The reversal was significantly greater in patients treated earlier (≤ 3h). Moreover, the reversal was independently associated with early neurological improvement (65). In a sub study of DEFUSE (Diffusion and perfusion imaging Evaluation For Understanding Stroke Evolution) trial, a reversal rate of 43% was reported for the baseline DWI lesion when comparing final infarct volume on FLAIR images obtained at day 30 (66). Moreover, the reversal of the DWI abnormality in patients post thrombolysis was demonstrated to be predictive of favorable clinical outcome (67).
It is worth noting that the definition of DWI reversal is complex. In many cases, the initial DWI reversal is transient. In one study, 8 of 18 patients presented DWI reversal on the immediate post-treatment scan, while only 3 patients had sustained reversal tissue by day 7 (68). In another study, over two-thirds of the DWI lesion reversal captured on 24-hour follow-up MRI is sustained (69). Furthermore, whether the reversal of DWI lesion translates to tissue salvage is questionable. Ringer TM et al. showed that neurons already exhibit evidence of structural damage and stress even though with the normalization of the DWI (70). Li F et al. suggested that even brief period of focal ischemia (e.g. 10 min) and sustained resolve of DWI lesions do not indicate a normal histological outcome (71).
40 ADC has been proposed to be an indicator to assess the viability of brain tissue. In general, tissue with higher ADC value is more likely to reverse (68). In one study, an ADC threshold of 620×10-6 mm2/s was proposed to distinguish ischemic core and penumbra (72).
Perfusion-derived parameters were also investigated. The reversal rate was significantly higher in DWI regions with normal perfusion compared to the hypoperfused region (Time to maximum [Tmax] ≤ 2s) (66). Mean transit time (MTT) has been suggested to improve infarction
prediction (73). Currently, there is no consensus on MRI-based tissue viability thresholds for DWI reversal. Apart from the image-derived values, the duration and severity of ischemia and reperfusion status are also important determinants for the tissue reversal.
When the diagnosis of ischemic stroke is established, the volume and the topography of the lesion can help the clinicians to determine the etiology, decide the treatment strategies and predict the clinical outcome.
The Alberta Stroke Program Early CT Score (ASPECTS) (74) is a semi-quantitative method to estimate the infarct size on non-contrast CT scan or DWI at acute phase. A number of studies investigated its role in predicting clinical outcome and guiding patient management. A post-hoc analysis of the PROACT-II study showed that patients with a baseline ASPECTS > 7 were 3 times more likely to have an independent functional outcome with thrombolytic therapy compared with patients with ASPECT ≤ 7 (75). In a similar analysis of IMS-III trial, ASPECTS was also demonstrated as a predictor of outcome and reperfusion. However, it was not able to identify patients likely to benefit from endovascular therapy after routine rtPA (76). Furthermore, a subgroup analysis of the MR CLEAN trial suggested that patients with ASPECTS 5-7 should not be excluded from intra-arterial treatment (77).
Infarct volumes can be measured precisely on initial DWI and ADC. The correlation of initial infarct volume with clinical outcome has been proved by a number of studies (78–80). Evidences showed that DWI lesion volume greater than approximately 70 mL predicted poor clinical outcome regardless of treatment and recanalization status (81–84). For example, Yoo et al. analyzed 54 ischemic stroke patients and reported that all patients with an initial DWI lesion volume > 72 mL and an NIHSS score > 20 had poor clinical outcome (82). Schaefer et al. demonstrated 95.6% specificity for DWI > 70 mL to predict poor outcome (84). In addition, Yoo et al. studied 34 stroke patients and showed that patients with initial infarcts > 70 mL had poor outcome despite a 50% recanalization rate (83). DWI lesion > 100 mL was another cut-off empirically used to define the malignant profile in clinical studies (85,86).
41 Nevertheless, these thresholds were challenged, several studies demonstrated that selected patients with large DWI lesions may still benefit from recanalization (87–91).
Follow-up DWI lesion volume was also proved to be an independent predictor of clinical outcome and was suggested as surrogate marker of outcome in acute stroke trials (92–96). Zaidi et al. analyzed 201 patients with MCA occlusion and suggested that successful recanalization leaded to improved functional outcomes through a reduction in final infarct volumes. Only age and final infarct volume but not recanalization were found to be independent predictors of outcome (93). Albers et al. analyzed 195 patients and reported that infarct volume at 27 hours was a powerful and independent predictor of 90-day clinical outcome (94). Bucker et al. analyzed images at 24-hour and 1-week for 228 patients from MR CLEAN trial. They found that even though lesion volume growth was common 24-hour post stroke onset, the 24-hour lesion volume was equally strongly associated with functional outcome as the 1-week lesion volume (96).
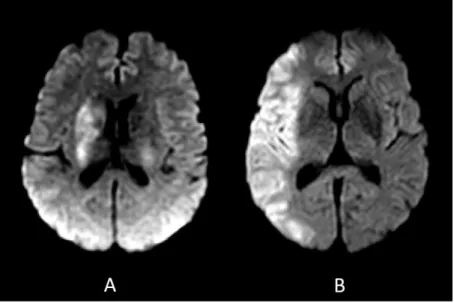
In addition to the lesion volume, the infarct location has also shown capabilities in stroke assessment and guiding the clinical decision-making. An example of stroke location influencing the functional outcome is presented in Figure 12.
Figure 12. Clinical outcome is associated with stroke location. Initial DWI of two patients with similar initial NIHSS scores but different functional outcomes. A: DWI of a 66-year-old female with ischemic stroke showed restricted diffusion in the right basal ganglia. Admission NIHSS score: 20; mRS at 3 months: 4; lesional volume: 21.7 mL. B: DWI of a 59-year-old
42 male with ischemic stroke showed restricted diffusion in the right cortical MCA region. Admission NIHSS score: 18; mRS at 3 months: 1; lesional volume: 166.2 mL.
Infarct location are investigated in two aspects: hemispheric involvement and acute infarction location.
Ischemic strokes in different hemispheres can cause distinct deficits depending on the region involved. Studies have shown conflicting results regarding the effect of hemispheric lateralization on stroke outcome. On the one hand, right hemispheric involvement was reported to predict worse functional outcomes. Goto et al. analyzed 183 patients with small or medium-sized infarction and showed that the locomotion outcome was poorer in patients with a right hemispheric infarction: 64.9% of right hemisphere versus 82.1% of left hemisphere stroke patients were able to walk independently after rehabilitation (97). On the other hand, no difference in functional outcome between patients with right or left hemisphere stroke has been demonstrated in other studies (98, 99). Fink et al. analyzed 1644 patients from the Virtual International Stroke Trials Archive. While baseline NIHSS score was higher for left hemisphere patients, no relationship with stroke lateralization and functional outcomes was observed (98). In addition, affected hemisphere lateralization also impacts clinical severity. Fink JN et al. reported that for patients with NIHSS score of 0 to 5, the lesion volume of right hemisphere stroke was greater than that of left-sided lesions (8.8 versus 3.2 mL) (41).
The ASPECTS is one approach that incorporates the precise lesion location to stroke outcomes. Beare R et al. analyzed 185 patients and illustrated the importance of M2 region (MCA cortex lateral to insular ribbon) to disability (100). Phan TG et al. analyzed data from the NINDS rt-PA Study and demonstrated that involvement of M6 region (primary motor cortex / parietal lobe) or lentiform nucleus increases the odds of disability (101). Rangaraju S et al. also demonstrated the importance of the role of right M6 region and left M4 region (superior frontal) in clinical outcome (102). The advantage of ASPECTS is its facility; a trained professional can calculate fast on CT or DWI. There is also effort to calculate ASPECTS automatically (103), which will simplify the process further. However, the ischemic location estimation using ASPECTS is not accurate enough.
More precise assessment of infarct location was investigated in a number of studies. An analysis of patients from MR CLEAN trial demonstrated that the association between infarct volume on follow-up noncontrast CT and clinical outcome was strengthened by accounting
43 for the mRS relevance of the affected brain areas (104). A pooled analysis of the EPITHET (Echoplanar Imaging Thrombolytic Evaluation Trial) and DEFUSE studies using Classification and Regression Tree demonstrated that the important regions of nonfavorable outcome were: in the left hemisphere, the uncinate fasciculus, the precuneus and the angular gyrus, and in the right hemisphere, the parietal lobe and the putamen (105). Voxel-based method was used in the identification of important infarct location. Payabvash et al. used voxel-based lesion symptom mapping and showed that infarction of insula, lentiform nuclei and middle corona radiate tend to have larger volumes, more severe symptoms and worse outcomes (106). Bentley et al. reported that low recovery rates were associated with lesions to bilateral parietal, right insula, medial frontal, capsule and brainstem (107). Wu et al. analyzed 490 subjects and showed that injury to white matter (corona radiata, internal and external capsules, superior longitudinal fasciculus, and uncinate fasciculus), postcentral gyrus, putamen, and operculum were implicated in poor functional outcome (108). In another study by Cheng et al., corona radiata, internal capsule and insula in both hemispheres, right inferior temporal gyrus and left superior temporal gyrus have been found to influence functional outcome (109). However, even though the integration of infarct location has been suggested to enhance the prediction of clinical outcome, it has not been applied to guide patient management, may be due to the lack of data on pretreatment images.
2.2.2. PWI (1). Principle of PWI
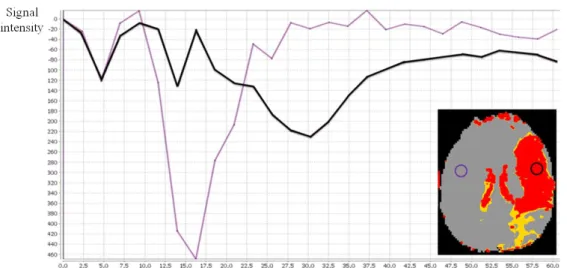
PWI is another useful sequence for the acute ischemic stroke evaluation. Dynamic susceptibility contrast is one of the main approaches of PWI used in clinic. It involves a rapid intravenous injection of a paramagnetic contrast agent (e.g. gadolinium [Gd] chelate) and a series of measurements of signal during the pass of the bolus through the brain tissue. The model used for perfusion quantification is based on the kinetic for non-diffusible tracers and relies on the assumption that the contrast agent remains intravascular in the presence of an intact brain-blood barrier. The intravascular compartment of contrast agent creates strong, microscopic susceptibility gradients, which causes signal loss in T2- or T2*-weighted MR images until the peak signal change. After the minimum signal is reached, the signal intensity returns gradually to the baseline value (110). The dynamic susceptibility contrast -MRI signal intensity-versus-time curve representing the hemodynamic of the contrast agent is demonstrated in Figure 13.
44 In dynamic susceptibility contrast -MRI, a bolus of a Gd-based contrast agent can reaches the brain approximately 10-15 seconds after the venous injection, creating a signal decrease of about 10-20 seconds or longer. To record the tracer concentration during the first passage, images must be acquired at a fast rate, which is usually of the order of several seconds. Rapid imaging acquisition technique like EPI can be used to achieve fast acquisition (110).
A series of parameters can be calculated for quantifying the perfusion status according to the first pass curve:
Time to peak (TTP): time corresponding to the maximum value of the contrast agent concentration in the tissue
Mean transit time (MTT): the mean passing time of the contrast agent bolus represented by the time at mid-height of the signal decay curve
Cerebral blood volume (CBV): the volume of blood in a given amount of brain tissue, it is determined by the area under the signal decay curve
Cerebral blood flow (CBF): the rate at which the blood passes through the brain tissue, it corresponds to the ratio of CBV/MTT
Time to maximum (Tmax): the delay between the contrast agent arrives the tissue and the arterial input function (AIF) after deconvolution (111) (Figure 14)
45 B
Figure 13. A: Diagram demonstrating the hemodynamic of the contrast agent obtained with dynamic susceptibility contrast -MRI. The signal intensity-versus-time curve of the first pass of a bolus of contrast agent is depicted. The MR signal intensity decreases when the contrast agent passing through the microvasculature. After the minimum signal is reached, the signal intensity returns gradually to the baseline value. Several parameters could be calculated according to the curve: TTP, MTT, CBF and CBV.
B: Example of the signal intensity-versus-time curve in an ischemic stroke patient with left MCA occlusion. Compared to the reference region (depicted by the purple curve), the ischemic region (depicted by the black curve) presented prolonged MTT and TTP, and decreased CBV.
46 Figure 14. The contrast agent concentration-versus-time curve (after deconvolution). The time delay A represents the ideal Tmax. The time=0 corresponds to the arterial input function arrival time. (111)
(2). PWI in ischemic stroke
PWI is an essential sequence in the diagnostic workup of ischemic stroke to evaluate the perfusion status of brain tissue. The parameters mentioned before can be applied to give insights into the hemodynamic status of tissue. (Figure 15) At the hyperacute phase of ischemic stroke, the cerebral perfusion pressure decreases; CBV can be normal or even slightly increased due to an autoregulatory response; CBF remains normal or decreased depending on the success of the compensating autoregulatory vasodilatation; and MTT/TTP/Tmax will be delayed. The infarcted tissue has decreased CBF/CBV and delayed MTT/TTP/Tmax.
Different PWI parameters are used to distinguish the penumbra and the ischemic core. However, no consensus on the parameter thresholds has been achieved. Tmax is currently the most commonly used parameter to define penumbra. It has the advantage of been measured individually with the use of the AIF. Tmax > 2s was used in EPITHET and DEFUSE study to indicate the hypoperfused brain tissue (85,86). Olivot et al. tested 4 predefined Tmax thresholds to calculate the volume of penumbra. They showed that Tmax delay threshold in the range of 4 to 6 seconds provides the best estimation for the hypoperfused brain tissue in acute phase (112). In a comparative study of PWI and PET, Tmax > 5.5 seconds was demonstrated as the best threshold for penumbra flow (< 20 mL/100 g/min on PET CBF) (113). Tmax > 6 seconds was used in several studies to define the critically hypoperfused tissue (36,114). A threshold of MTT delay > 4 seconds beyond the contralateral hemisphere and TTP > 4 and 6 seconds were applied in other studies to define the hypoperfusion (115,116).
47 Figure 15. PWI of an ischemic stroke patient with occlusion of left MCA within 4 hours of symptom onset. Different parameter maps are derived: the CBV and CBF are decreased in the left MCA region, while Tmax and MTT are delayed. (Images are post processed by Olea Sphere®)
2.2.3. PWI-DWI mismatch
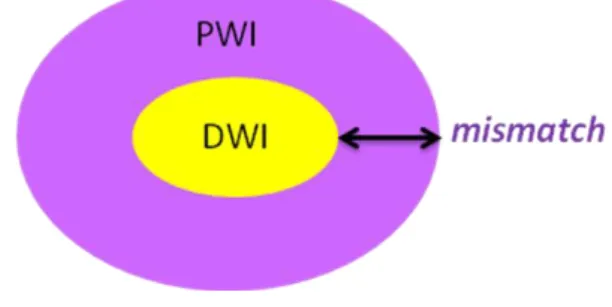
In general, the hypersignal region on DWI is considered as the ischemic core at the acute stage of stroke, and the hypoperfused region detected on PWI is normally larger than the DWI abnormalities. The difference between the DWI and PWI abnormalities is named PWI-DWI mismatch, which can be used to estimate the penumbra. (Figure 16)
Figure 16. Schema demonstrating the PWI-DWI mismatch. It is a hypoperfused region where signal intensity on DWI is normal.
The criterion for PWI-DWI mismatch is various in different studies:
- DEFUSE/EPITHET: VolumePWI(VPWI) (Tmax>2s) / VDWI >1.2; VPWI - VDWI > 10mL
- DEFUSE 2: VPWI (Tmax>6s) / VDWI >1.8; VPWI - VDWI > 15mL; VDWI < 70 mL; volume of
severe hypoperfusion lesion (Tmax>10s) < 100mL
- DEFUSE 3: VPWI (Tmax>6s) / VDWI >1.8; VPWI - VDWI > 15mL; VDWI < 70 mL
- SWIFT PRIME: VPWI (Tmax>6s) / VDWI >1.8; VPWI - VDWI > 15mL; VDWI < 50 mL; volume
of severe hypoperfusion lesion (Tmax>10s) < 100mL
PWI-DWI mismatch is useful in selecting appropriate candidate for reperfusion therapy, in order to achieve good clinical outcome and prevent deleterious effects. Studies on PWI-DWI mismatch for stroke patients with thrombolysis and/or thrombectomy are listed in Table 1. EPITHET and DEFUSE are two important studies exploring intravenous thrombolysis using rtPA within 3 to 6 hours of symptom onset. DEFUSE study recruited 74 ischemic stroke
48 patients and demonstrated that early reperfusion increased the odds of achieving a favorable clinical response only in patients with a PWI-DWI mismatch, and even more in patients with target mismatch profile (i.e. a baseline lesion volume on DWI < 100 mL and lesion volume on PWI < 100 mL defined by Tmax > 8 seconds) (85). EPITHET study analyzed 101 patients and suggested that thrombolysis was associated with lower infarct growth and increased reperfusion in patients with PWI-DWI mismatch (86). Trials on desmoteplase, for example the Desmoteplase In Acute Ischemic Stroke trial (DIAS) (117) and the Dose Escalation of Desmoteplase in Acute Stroke (DEDAS) (118), have also shown positive role of PWI-DWI mismatch in patient selection for achieving better clinical outcome (117,118).
PWI-DWI mismatch can last several hours after symptom onset. Its presence indicates that there exists the brain tissue which can be salvaged, thus may help to extent the treatment window of ischemic stroke. Recently, DEFUSE 3 study used PWI-DWI mismatch as a criteria for recruiting patients for reperfusion treatment 6 to 16 hours after stroke onset, demonstrating that endovascular thrombectomy plus intravenous thrombolysis is the better treatment compared to intravenous thrombolysis alone (36). Overall, PWI-DWI mismatch plays a promising role in selecting stroke patients for reperfusion. However, there is no evidence proving that patients without PWI-DWI mismatch should be excluded from treatment.
49 Table 1. Trials on PWI-DWI mismatch in patients treated by thrombolysis or thrombectomy
Study design Therapy window Time Number of patients measurement Outcome Main findings
EPITHET Phase II, RCT; patients treated regardless of MRI findings Thrombolysis (Alteplase) or placebo 3-6 h 101 infarct growth between DWI and the
day 90 T2 lesion; reperfusion, neurological outcome
Alteplase was non-significantly associated with lower infarct growth and significantly associated with increased reperfusion in patients who had mismatch. DEFUSE
Phase II, open-label study; patients treated regardless of MRI results Thrombolysis (Alteplase) 3-6 h 74 Early reperfusion on PWI; clinical response assessed by NIHSS score
Early reperfusion was associated with good clinical outcomes in patients with mismatch
DIAS
Phase II, dose-finding randomized
trial; only patients with mismatch treated Thrombolysis (Desmoteplase) or placebo 3-9 h 104 Reperfusion on PWI
and clinical outcome Identification the effectiveness of desmoteplase in patients with mismatch and the safety dose
DEDAS Similar to DIAS (Desmoteplase) Thrombolysis
or placebo 3-9 h 37
Reperfusion on PWI
and clinical outcome Similar to DIAS
DIAS-2
Phase III, RCT; only patients with
mismatch were included Thrombolysis (Desmoteplase) or placebo 3-9 h 186 Clinical response assessed by NIHSS score
Failed to show a benefit of desmoteplase in stroke patients SWIFT PRIME Phase III, RCT; 71 patients were selected by mismatch Thrombectomy plus thrombolysis or thrombolysis alone
< 6 h 196 Clinical outcome assessed by mRS functional outcomes than thrombolysis alone in patients Thrombectomy plus thrombolysis resulted in better with proximal arterial occlusion
DEFUSE-3
Phase III, open-label study; only
patients with mismatch were included Thrombectomy plus thrombolysis or thrombolysis alone
50
2.2.4. T2-FLAIR sequence
T2-FLAIR image is a common sequence in the standard protocol of ischemic stroke evaluation. It is similar to T2WI but with suppression of CSF, thus it reduces the partial volume caused by CSF. Abnormalities remain bright on FLAIR images while normal CSF is attenuated and presented as hyposignal. It is very sensitive to subacute or chronic ischemic lesions, but its diagnostic value in the first hours of stroke onset is relatively limited. Its role in the acute stroke evaluating is as following.
The FLAIR image can detect the global brain parenchymal lesion, thus providing information on stroke subtype. For example, a patient with high burden of small vessel disease can develop deep perforating stroke.
It has been shown that stroke patients within 6 hours of symptom onset with a visible lesion on DWI but no visible FLAIR lesion, named DWI/FLAIR mismatch, have greater probability to be in a time window 3 hours or less (specificity 93%) (119). (Figure 17) Therefore, DWI/FLAIR mismatch was proposed as an indicator of stroke lesion age in case the onset time is unknown, and to identify those who may benefit from reperfusion therapy. However, the hyperintensities on FLAIR images are sometimes subtle and difficult to distinguish. Caution should be payed when defining the DWI/FLAIR mismatch.
Figure 17. FLAIR and DWI images of an acute ischemic stroke patient imaged after 3 hours of symotom onset. Hypersignal can be detected in the territory of left MCA on DWI, while no obvious hyperintensity is observed on FLAIR image.
51 Vascular hyperintensities on the T2-FLAIR images is another approach of evaluating acute ischemic stroke. (Figure 18) It is mostly seen in stroke patients with large vessel occlusion and in general is distal to the stenotic artery. It may indicate slow blood flow passing collateral vessels and may be used as a surrogate of collateral status. Hohenhaus et al. demonstrated that the presence of vascular hyperintensities indicated larger ischemic area and proposed that it could be a further surrogate marker for PWI-DWI mismatch and stroke severity (120).
Figure 18. An acute ischemic stroke patient with occlusion of right MCA (shown on TOF). FLAIR image demonstrates the vascular hyperintensities (arrow) in the distal territory of the occluded vessel.
2.2.5. T2*-weighted image
To differentiate ischemic and hemorrhagic stroke, CT is considered as reference imaging modality. However, MRI also has high accuracy in hemorrhagic stroke identification. T2*-weighted image is one of the most important sequences to detect intracranial hemorrhage and intraluminal thrombus formation. The detection of acute hemorrhage is based on the paramagnetic effect of deoxyhemoglobin in the red blood cells, which produces inhomogeneity of the magnetic field and causes a susceptibility effect. Therefore there exists a signal loss on T2*-weighted images (48).
Besides, intraluminal thrombus can be detected within the occluded vessel in the acute phase of ischemic stroke, providing fast diagnosis of acute thrombotic occlusion. (Figure 19)