RESEARCH OUTPUTS / RÉSULTATS DE RECHERCHE
Author(s) - Auteur(s) :
Publication date - Date de publication :
Permanent link - Permalien :
Rights / License - Licence de droit d’auteur :
Bibliothèque Universitaire Moretus Plantin
Institutional Repository - Research Portal
Dépôt Institutionnel - Portail de la Recherche
researchportal.unamur.be
University of Namur
Agile Cultural Challenges in Europe and Asia
Ayed, Hajer; Vanderose, Benoît; Habra, Naji
Published in:
Agile Cultural Challenges in Europe and Asia
Publication date:
2017
Document Version
Publisher's PDF, also known as Version of record
Link to publication
Citation for pulished version (HARVARD):
Ayed, H, Vanderose, B & Habra, N 2017, Agile Cultural Challenges in Europe and Asia: Insights from Practitioners. in Agile Cultural Challenges in Europe and Asia: Insights from Practitioners. IEEE Computer society, ICSE'17, Buenos Aires, Argentina, 20/05/17.
General rights
Copyright and moral rights for the publications made accessible in the public portal are retained by the authors and/or other copyright owners and it is a condition of accessing publications that users recognise and abide by the legal requirements associated with these rights. • Users may download and print one copy of any publication from the public portal for the purpose of private study or research. • You may not further distribute the material or use it for any profit-making activity or commercial gain
• You may freely distribute the URL identifying the publication in the public portal ? Take down policy
If you believe that this document breaches copyright please contact us providing details, and we will remove access to the work immediately and investigate your claim.
Agile Cultural Challenges in Europe and Asia: Insights from Practitioners
Hajer Ayed, Benoˆıt Vanderose and Naji Habra
PReCISE Research Center
Faculty of Computer Science, UNamur
emails: {hajer.ayed, benoit.vanderose, naji.habra}@unamur.be
Abstract—The challenges of adopting agile software develop-ment methods vary from one context to another. This work investigates how the European and Asian cultural backgrounds may impact agile practices adoption. The focus is on three countries: Belgium, Malaysia and Singapore. We gathered data about practices, challenges and impediments encountered by software development teams from interviews of 19 practitioners and two agile software development events (discussion groups). The results of the analysis are prioritized and discussed us-ing the Hofstede Model for national cultures comparison. The identified hypotheses can serve as a guidance for contextual agile practices improvement. The results need to be considered carefully since more empirical data are required to confirm the practitioners’ opinion. In fact, studying socio-cultural differences is sensitive. Yet such information may be valuable for onshore teams (culturally homogeneous) as well as teams working on globally distributed projects.
Index Terms—Agile Software Development; Process Improve-ment; Challenges; Cultural Differences
I. INTRODUCTION
For the past decade, agile methods have been steadily gaining worldwide popularity within the software development community. They initially spread in North America before the expected benefits of Agile began attracting interest and adoption grew in other parts of the world. More than a decade after the release of the first methodologies, practitioners all over the world have accumulated field experience working with numerous practices and techniques and trying to achieve higher maturity. Recently, this search for maturity has been focusing more and more on the context awareness of agile methods.
Newly released agile frameworks such as Disciplined Agile Delivery (DAD) [1], Scaled Agile Framework (SAFe) [2] and many other models dedicated to agility assessment demon-strate this shift to a more context aware approach to Agile maturity. Corporate culture, location, team skills and project constraints such as business domain, schedule, and cost, affect the way Agile is implemented and should be considered carefully in order to improve the way teams are working.
Among these context-related factors, the cultural back-ground (i.e., mind-set, values and behaviors that shape culture over time) of the team adopting an agile methodology may be one of the most crucial yet neglected aspects addressed by research. As [3] defines it, “culture consists in patterned ways of thinking, feeling, and reacting, acquired and transmitted mainly by symbols, constituting the distinctive achievement of human groups, including their embodiments in artifacts; the essence of culture consists of traditional (i.e., historically derived and selected) ideas and especially their attracted
values”. As outlined by [4], cultural factors are recognized as critical issues that influence the teams way of working. Specifically, people’s culture affects development practices and should be taken into account when discussing the ability of software teams to work with Agile Methods effectively and successfully.
This paper investigates the impact of cultural background on the implementation of agile practices in culturally diverse con-texts. 3 countries were considered: Belgium (BE), Malaysia (MY) and Singapore (SG). In these 3 contexts, we collected data about agile practices and values that were adopted more or less successfully. We then identified a model designed to dimensionalize country-level cultural background (the Hofst-ede Model) and cross-referenced the available model’s cul-tural dimensions data with the collected data. The resulting outcome is a functional set of hypotheses about the potential relationships between cultural traits and the ease of adoption and successful application of agile practices. Although these preliminary findings call for more validation, they motivate further research and offer an important venue for agile teams and coaches regarding the fine tuning and improvement of Agile adoption and efficiency worldwide.
The remainder of this paper is organized as follows: Sec-tion II provides selected related works, SecSec-tion III and IV present our research methodology and results, Section V explores the limitations of this preliminary study before Sec-tion VI provides closing comments and future work.
II. RELATEDWORK
Several studies have been conducted in software engineering research to investigate the factors influencing agile methods implementation. These can be categorized into exploratory research and description research (basically lessons learned from practitioners).
[5] is an influential exploratory analysis which identifies success and failure factors from existing literature, gathers survey data from 109 agile projects across the world (56% from Europe and 9.2% from Asia) and then validates the reliability of the factors using multiple regression techniques. The key contribution of the study consists of the reduction of the multitude of success/failure factors reported in literature to three critical ones: a correct delivery strategy, a proper practice of agile software engineering techniques, and a high-caliber team. This study was questioned in [6] which follows the same research model and identifies different factors in Eastern Europe companies: project management, project type
and project schedule, which were found the most critical to success in terms of Timeliness and Cost.
Several description research studies such as [7] try to answer the same question using lessons learned from practitioners. They tend to confirm the impact of the organization, team and project context on Agile implementation. However, most of them do not consider the inter-cultural differences and human factors. The few existing studies to do so are related to Global Software Development (GSD) research.
TABLE I
KEY FACTORS INFLUENCINGAGILEADOPTION(FOUND IN LITERATURE) Dimension Factor Team Size Distribution Skills Individuals mindset Project Size Scope variability Business domain Customer relationship Technology support Quality goals Organization Structure Governance Business Model Leadership style Organizational culture
[8] presents a set of challenges encountered by Yahoo in a globally distributed project across Asia Pacific, Europe and the US. These are categorized into 3 areas: communication, con-trol and trust. Cultural differences seem to make the challenges even more difficult. The study reports that communication lines were not always as open as expected, since Asian teams were sometimes reluctant to discuss negative issues. It also explains how local business conditions and sensitive issues may create disjointed and conflicting priorities within the product backlog.
[9] reports lessons learned in ThoughtWorks concerning an offshore development experience in Bangalore India to support software development projects in North America and Europe. It discusses that Asian cultures may reinforce deference to superiors which contradicts the value of team autonomy. This makes the communication harder: Asian team members may be discouraged from exposing problems, warning about non-feasible deadlines, or proposing alternatives to perceived directives from superiors. The authors end the discussion about cultural differences by explaining the sensitiveness of the problem and that it is obviously not specific to Asia since we may find the same problems or even worse in some western companies.
[10] explores how agile practices can reduce sociocultural distance and details the risks and opportunities in the context of global software development. The results also show that risks are related to communication, inconsistency in work practices and different perceptions of authority/hierarchy.
The key factors influencing agile practices adoption are synthesized in Table I. As we may see, the cultural aspect is already present in the body of knowledge. However, it
often refers to the organizational culture and not the cultural background of people. The few studies that refer to human factors are generally discussed in GSD research.
III. RESEARCHAPPROACH A. Objectives
Studies such as [11] tend to show that cultural factors should not be disregarded when evaluating the efficiency and/or relevancy of software engineering practices. As pointed out in Section II, some studies tackle the challenges related to cultural differences within agile development teams. However, these efforts regarding cultural aspects in agile software de-velopment tend to focus on the conflict arising between team members coming from different cultural backgrounds (in the context of globally distributed projects).
Our research aims at extending this focus by questioning the impact of culture in homogeneous cultural environments. Due to agile methods originating from North America, it stands to reason that many agile practices may in fact rely on observations or assumptions based on views and behaviors shared by American practitioners. Successfully applying such practices would therefore suppose the ability to conform to said views and behaviors. In multi-cultural development teams, the mitigation of culturally induced mental blocks through conflict may lead to success. However, in culturally homogeneous development teams outside of North America, the inability to conform to specific views may lead to the disregard, inefficiency or failure of specific agile practices.
In order to challenge this hypothesis, we’ve been investigat-ing the practices of 9 agile teams spread across 3 culturally diverse contexts outside of North America, i.e., Belgium (BE), Malaysia (MY) and Singapore (SG). Through this preliminary study, our goal is to address the following research questions within these 3 contexts:
• RQ1: Is there an observable relationship between adopted practices and cultural background?
– RQ1a: Can we rely on a commonly accepted typol-ogy of cultural factors?
– RQ1b: Is there a noticeable difference in the inves-tigated contexts?
• RQ2: Can we formulate plausible hypotheses about po-tential relationships between cultural factors and agile practices adequacy?
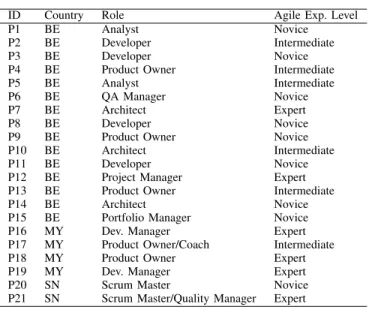
B. Data Collection
The data of our study has been collected using semi-structured interviews and discussion groups. The interviewees (see Table III) are distributed as follows:
• in BE: 13 practitioners (3 teams) interviewed during 2013
(2h each)
• in MY: 4 practitioners (one per team) interviewed
be-tween April 2016 and June 2016 (1h each)
• in SG: 2 practitioners (one per team) interviewed between April 2016 and June 2016 (1h each)
TABLE II TEAMSOVERVIEW
ID Country Participants Team Size Business Domain Agile Exp. Project Time Iteration Length Scope Variability Methods
T1 BE P1-P4 10 E-Gov. 1 y 2 y 2 w Low Scrum
T2 BE P5-P8 6 E-Gov. 1 y 1 y 4 w Low Scrum
T3 BE P9-P15 15 E-Gov. 2 y 1 y 2 w Low Scrum
T4 MY P16 20: 5 squads B2B 8 y 3 m na Medium Kanban/Lean
T5 MY P17 7 Real estate 3 y 3 m 2 w High Scrum/Kanban
T6 MY P18 8 Oil&Gas, E-Gov 10 y 6 m 2 w Low Scrum/Kanban
T7 MY P19 15 E-Gov. 5 y 2 y 4 w High Custom
T8 SN P20 5 E-Gaming 2 y 6 m 2 w Low Scrum/Kanban
T9 SN P21 7 B2B, Banking 4 y 1 y 6 w Medium Scrum/AUP
TABLE III INTERVIEWEES PROFILES
ID Country Role Agile Exp. Level
P1 BE Analyst Novice
P2 BE Developer Intermediate
P3 BE Developer Novice
P4 BE Product Owner Intermediate
P5 BE Analyst Intermediate
P6 BE QA Manager Novice
P7 BE Architect Expert
P8 BE Developer Novice
P9 BE Product Owner Novice
P10 BE Architect Intermediate
P11 BE Developer Novice
P12 BE Project Manager Expert
P13 BE Product Owner Intermediate
P14 BE Architect Novice
P15 BE Portfolio Manager Novice
P16 MY Dev. Manager Expert
P17 MY Product Owner/Coach Intermediate
P18 MY Product Owner Expert
P19 MY Dev. Manager Expert
P20 SN Scrum Master Novice
P21 SN Scrum Master/Quality Manager Expert
We asked the interviewees about their teams’ context: size, business domain, potential geographical distribution, years of Agile experience, documentation strategy, project duration, iteration length, etc. We also asked about the organizational culture, i.e., compliances, management support to Agile, lead-ership style and innovativeness. We used a formal interview guide with the list of question and topics to be covered. To drive the discussion, we asked them to rank some context aspects such as the domain complexity, the scope variability, the customer involvement and the team self-organization. We also included open-ended questions which helped identifying new ways of seeing and understanding the topic.
These informations are synthesized in Table II. We also discussed in details the challenges and impediments that the teams encounter and asked (when needed) to explain these challenges according to the team members cultural back-ground.
As we can see in Table III, the selection of interviewees is unbalanced (4 in MY, 2 in SG and 13 in BE). This is because we relied on convenience sampling which is a non-probability sampling technique where subjects are selected because of their convenient accessibility and proximity to the researchers. We also collected data from the following discussion groups:
• in BE: two project retrospectives that we organized with the teams T1 and T3 (see Table II)
• in MY: two agile software development meetings (monthly meetings) during April 2016 and June 2016 The advantage of collecting data from discussion groups is that people tend to discuss openly their challenges.
C. Data Analysis
In order to be able to analyze and compare the cultural backgrounds, we first need to determine the discriminating dimensions or variables to describe culture-related positions.
Several models have been designed by researchers to conceptualize cultural differences. These can be categorized into three types: single dimension models, multi-dimensional models and historical-social models [12]. The first two types of models assume that people have a distinctive, identifiable and influential national culture that we can dimensionalize, potentially measure and operationalize.
The historical-social models, however, question the distinc-tiveness of national cultures and provide broader perspectives which cross geographical boarders. Such models identify key historical-social variables to analyze cultural backgrounds. These variables are usually context-specific and thus may not be useful for cross-cultural understanding. For example, [13] and [14] propose south east Asian management models and study the influence of specific variables such as Confucianism or Taoism which are not representative of other cultures. Thus, this type of models was excluded.
Table IV synthesizes the models of national culture that we explored. As we can see, culture has been defined in different ways. Each model has its own set of discriminating factors characterizing the concept of national culture. All these models are based on the assumption that cultures can be distinguished based on differences in what they value. That is, “some cultures place a high value on equality among individuals, while others place a high value on hierarchies. Likewise, some cultures place a high value on certainty in everyday life and have difficulty coping with unanticipated events, while others have a greater tolerance for ambiguity” [15]. A comparison and an alignment of the multi-dimensional models can be found in [15].
Among all these definitions, the Hofstede’s model [16][17] is mostly cited in Information System (IS) research. Much of the literature concerned with cultural and cross-cultural issues
in the IS field has relied on Hofstede’s work, typically the study of global software development teams [11][4]. This is may be not surprising, given that the Hofstede typology of culture has been derived from empirically strong study of em-ployee values at a major multinational IT corporation (IBM). The original project included 60,000 employees and over 40 countries. In total, Hofstede carried out his research over a period of 15 years and analyzed some 116 000 questionnaires from 67 countries in a single multinational corporation.
TABLE IV
MODELS OFNATIONALCULTURE
Model Cultural dimension(s)
Single
dimension
Hall [18] High/Low Context Lewis [19] Monochronic/Polychronic Fukuyama [20] High/Low Trust
Multiple
dimensions
Kluckholn & Strodtbeck
[21] Relationship with nature Relationship with people Human activities Relation with time Human nature Hofstede [16] Power Distance
Uncertainty Avoidance Individualism/Collectivism Masculinity/Feminity Indulgence Hampden-Turner & Trompenaars [22] Universalism/Particularism Individualism/Collectivism Specific/Diffuse roles Neutral/Affective emotions Achieved/Ascribed social status Time perspective
Inner/outer directed) GLOBE [23] Power Distance
Uncertainty Avoidance Human Orientation Institutional Collectivism In-Group Collectivism Assertiveness Gender Egalitarianism Future Orientation Performance Orientation
The validity of the Hofstede model has been discussed in several research. Criticisms can be found in [24] and [25] and concern the research methodology (e.g., the unsuitability of surveys, the uniqueness of the data source: IBM and the measure of national culture as a statistical average of indi-viduals’ views), the dimensions validity (e.g., [24] argue that the dimension of “Uncertainty Avoidance” have lost relevance over the years) and the model’s crucial assumptions (e.g., the assumption of a shared and stable national culture). Arguments for the model include its strong empirical basis (a large data set), its applicability to different contexts and the sufficiency of its variables to study the differences between national cultures (the conceptual and statistical independence of the variables). In [26], Hofstede provide a comprehensive response to the model criticisms and argues that nations may not be the best
unit of culture analysis but they are a legitimate one regarding the accessibility and availability of information.
Based on the aforementioned merits, we decided to analyze the challenges of implementing agile practices according to the Hofstede Model.
The model proposes 6 factors to characterize the national culture:
• Power Distance (PDI): indicates the extent to which the
less powerful members of organizations accept and expect that power is distributed unequally. People in societies with high PDI score accept the hierarchical order easily. People in societies with low PDI, consider hierarchy as established only for convenience and try to equalize the distribution of power.
• Individualism vs. Collectivism (IDV): refers to the degree to which people in a society are integrated into groups. In individualist societies (high IDV), the ties between individuals are loose: individuals are expected to take care of only themselves and the immediate groups to which they belong. In collectivist societies (low IDV), people belong to “in groups” that take care of them.
• Masculinity vs. Femininity (MAS): refers to the
distribu-tion of values such as assertiveness, achievement, power and control between the genders. Masculine society (high MAS) indicates maximum emotional and social role differentiation between the genders and Feminine society (low MAS) indicates minimum emotional and social role differentiation between the genders.
• Uncertainty Avoidance (UAI): evaluates the degree to which a society is reluctant to ambiguity and unstructured situations. Societies with a high UAI score feel threatened by ambiguous and unknown situations. In societies with a low UAI, uncertainty is accepted as an inherent in life and “each day is taken as it comes”.
• Long-term vs. Short-term Time Orientation (LTO): is
related to the choice of focus of people’s efforts; the future or the present and past. In a long-term oriented society (high LTO), people attach more importance to future. They prescribes to long term commitments in a pragmatic way: they encourage efforts in the present to prepare the future. In short-term oriented society (low LTO), people attach more importance to present, i.e., they prefer to maintain past/time-honored traditions and view societal change with suspicion.
• Indulgence vs. Restraint (IDG): measures the extent to which people express their desires and impulses. An indulgent society (high IDG) allows relatively free grat-ification and natural human desires related to enjoying life. Restraint (low IDG) stands for a society that controls gratification of needs and regulates it by means of strict social norms.
Figure 1 compares the 6 scores for BE, MY and SG. The data is provided by [27]. The scale runs from 0 - 100 with 50 as an average score. The rule of thumb of the Hofstede model is that if a score is under 50, the culture scores relatively low
on that scale and if any score is over 50, the culture scores relatively high on that scale. This means that the country scores on the dimensions are relative. In other words, culture can be only used meaningfully by comparison.
Fig. 1. US, BE, MY and SG Cultural Dimensions according to [16]
At the PDI dimension, MY is the country which scores the higher. This explains the culture of deference to superiors: the management in the country tends to follow a command-and-control style. It may also indicates that superiors may have privileges and may be inaccessible. SG and BE have also relatively high PDI scores. The IDV score in BE is the higher, which indicates that the BE society is more individualist than MY and SG. The MAS dimension ranks average in BE, MY and SG (respectively 54, 50 and 48) which indicates that it will not be effective to explain the potential observations and derive hypotheses. We therefore excluded it.
BE has the highest score in the UAI dimension. This expresses a difficulty of coping with uncertainty and unan-ticipated situations. At the LTO dimension, BE and SG rank high, while MY ranks lower. This indicates that BE and SG are long-term oriented while MY is short-term oriented.
The IDG score of BE, MY are of 57 which makes them more indulgent societies than SG which score is a bit lower (46).
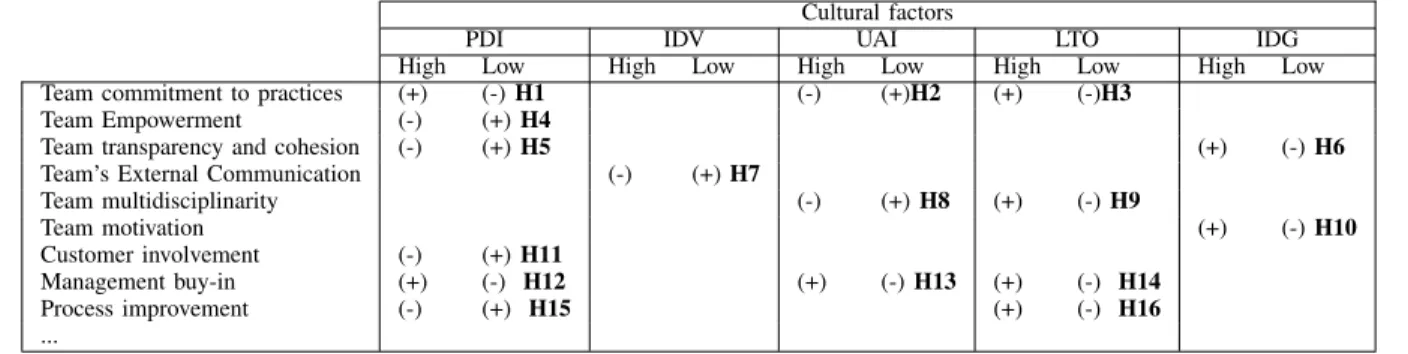
IV. RESULTS
Table IV summarizes the interviews and group discussion findings. These are categorized and prioritized according to the challenges severity in BE, MY and SG. Table VIII summarizes the hypotheses identified in the following sections.
A. Team commitment to Practices
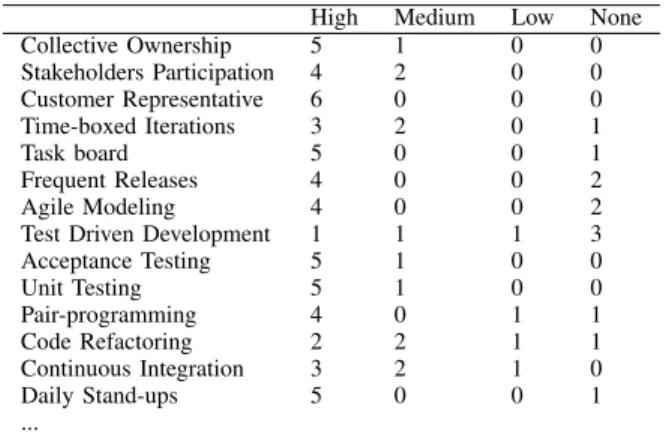
To develop a detailed understanding of the deployed agile practices, we asked the 21 practitioners to rank from none to high the level of adoption of 40 agile practices1 (see synthesis
Table VI and Table VII). Most of the practitioners assign high or medium ranking for most of the practices. During the group discussion in MY, the majority of participants reported that team members show high level of commitment to the agile practices: they respect the method guidelines as much as
TABLE V
COMPARISON OF CHALLENGES
Priorities
BE MY/SN
Team commitment to practices Medium Low Team Empowerment Medium High Team transparency and cohesion Low High Team’s external communication High Low Team multidisciplinarity Medium
-Team motivation Low Medium
Customer involvement Medium Medium Management involvement Low Low Process improvement Medium High
possible. P18 (see Table III) reported that team commitment to agile practices such as retrospectives decreases when the process facilitator (Scrum master) is not leading enough and motivating. In BE, during a project retrospective, T2 (see Table II) reported some violations to process rules such as the daily stand-ups duration (same meeting for two sub-projects which make the meeting longer than it should be). However, these violations to process rules are perceived as negative (referred to as “to drop” practices during retrospectives). The relatively high level of commitment to practices can be explained by the PDI factor: cultures with high PDI usually accept established rules easier. With a score of 100, MY has the highest score of PDI. The PDI scores for SG and BE are also relatively high (respectively 74 and 65).
TABLE VI
OVERVIEW OF PRACTICES1ADOPTION LEVEL(AS PERCEIVED BYBE
PARTICIPANTS)
High Medium Low None
Collective Ownership 4 5 3 2 Stakeholders Participation 11 4 0 0 Customer Representative 7 7 1 0 Time-boxed Iterations 7 6 2 0 Task board 3 7 4 0 Frequent Releases 11 4 0 0 Agile Modeling 3 3 6 2
Test Driven Development 1 3 8 3
Acceptance Testing 10 2 2 1 Unit Testing 6 5 3 1 Pair-programming 0 4 8 3 Code Refactoring 3 3 6 0 Continuous Integration 7 7 0 1 Daily Stand-ups 6 8 0 1 ...
Another critical issue reported by BE practitioners is the reluctance to the newly introduced agile practices. We espe-cially observed this in T2 which was not enough prepared to the transition from traditional skill-centric siloed organization (structured in specialized units architecture, business analysis, QA, etc.). According to the Hofstede model, the acceptance of change is mainly correlated to the LTO dimension. Since BE have a high LTO score, the commitment to accept the change towards Agile should also be high. When the change is not enough prepared (as it was in T2), cultures which tend 1Agile software development practices as defined by the Agile alliance [28]
TABLE VII
OVERVIEW OF PRACTICES1ADOPTION LEVEL(AS PERCEIVED BYMY/SN
PARTICIPANTS)
High Medium Low None
Collective Ownership 5 1 0 0 Stakeholders Participation 4 2 0 0 Customer Representative 6 0 0 0 Time-boxed Iterations 3 2 0 1 Task board 5 0 0 1 Frequent Releases 4 0 0 2 Agile Modeling 4 0 0 2
Test Driven Development 1 1 1 3
Acceptance Testing 5 1 0 0 Unit Testing 5 1 0 0 Pair-programming 4 0 1 1 Code Refactoring 2 2 1 1 Continuous Integration 3 2 1 0 Daily Stand-ups 5 0 0 1 ...
to avoid uncertainty (high UAI) will probably reject it. This may explain the reluctance towards the introduction of new practices in T2. The problem was not raised by MY and SG practitioners. It seems reasonable to assume that this is may be due to the fact that the transition to agile methods in all the Asian companies that we interviewed follows a top-down model, i.e., the change comes from the management. Since MY and SG have higher PDI scores, teams should be more prone to accept changes.
Hypotheses:
• H1: Positive impact of high PDI scores on commitment
to practices
• H2: Negative impact of high UAI scores on commitment to (new) practices
• H3: Positive impact of high LTO scores on commitment to (new) practices
B. Team Empowerment
Traditional teamwork has the project manager controlling everything. The manager is given responsibility and authority over all decisions and plans. In Agile, team empowerment is an important feature that removes bottlenecked decision making and therefore allows the team to be more efficient. Several practitioners from MY and SG reported the lack of team empowerment as a critical issue to their Agile imple-mentations: P16, P17, P19, P20 (see Table III) and some other participants of the discussion groups. They all relate this to the command-and-control mindset. P20 (see Table III) reports that the management gives the team the freedom to decide about their way of working but the team members “don’t dare to think out of the box”because of their lack of experience.
In BE teams, we observed a misunderstanding of team empowerment: T3 (see Table II) reported that the team mem-bers were considered accountable for some business decisions and priorities definition. They also reported that they were sometimes confronted directly to the customer demands. The proximity of customer in itself is positive but this should not interfere on the team work during the iteration. The relatively high PDI score in BE can also explain the customer
interference. In countries showing high PDI, hierarchy is well established and superiors, i.e., the customers in this case, may consider that they have special privileges such as asking the team for changes directly and anytime they want to.
Hypothesis:
• H4: Negative impact of high PDI scores on team
empow-erment
C. Team Transparency and Cohesion
Transparency refers to open communication, including the communication on negative points and represents an important agile software development value. From intensive collabo-ration and great team cohesion emerges transparency. The two concepts of transparency and cohesion are therefore interrelated. During group discussions and interviews, lack of transparency is reported by several MY and SG practitioners as very critical. P16, P18, P20 and P21 (which were interviewed separately)(see Table III) all reported that team members have a tendency to not expose problems such as non-feasible deadlines or technical difficulties. They refer to the command-and-control mindset as a possible explanation. In such a context, i.e., a high PDI score, [16] says that “it is advised for the manager to establish a second level of communication, having a personal contact with everybody in the structure, allowing to give the impression that everybody is important in the organization, although unequal”. We hypothesize that the lack of transparency can be explained by both the PDI and IDG dimension, depending on the real reason that pushes individuals to not communicate about problems. If this is related to uneasiness with superiors, then the cause of the problem would be the high PDI score in MY and SG. If the cause is the uneasiness with other team members (which are at the same hierarchal level), then the communication is threatened by the IDG dimension. IDG score is 57 in MY and 46 in SG.
BE practitioners report a relatively good communication in-side the team. During the project retrospective of T3, a critical issue concerning each other’s responsibilities and workload was reported. The issue was never been mentioned before which might suggest a lack of internal communication. The team also reported having communication problems with the external environment (see Section IV-D).
Hypotheses:
• H5: Negative impact of high PDI scores on team trans-parency
• H6: Positive impact of high IDG scores on team trans-parency
D. Team’s External Communication
In BE, T1 and T2 (see Table II) report challenges related to the communication with external teams. The IDV dimension determines the degree to which individuals are socialized and therefore may be correlated to this issue. The IDV score is relatively high in BE, which enhances the degree of interde-pendence inside the team (cohesion) and in contrast decreases external relationships. This could mean that the Belgians favor
TABLE VIII
HYPOTHETICAL CORRELATION BETWEENAGILE CHALLENGES AND CULTURAL FACTORS
Cultural factors
PDI IDV UAI LTO IDG
High Low High Low High Low High Low High Low
Team commitment to practices (+) (-) H1 (-) (+)H2 (+) (-)H3
Team Empowerment (-) (+) H4
Team transparency and cohesion (-) (+) H5 (+) (-) H6
Team’s External Communication (-) (+) H7
Team multidisciplinarity (-) (+) H8 (+) (-) H9 Team motivation (+) (-) H10 Customer involvement (-) (+) H11 Management buy-in (+) (-) H12 (+) (-) H13 (+) (-) H14 Process improvement (-) (+) H15 (+) (-) H16 ...
focusing on their immediate entourage rather than belonging to larger groups.
Another type of external communication is the team’s integration within the software engineering community. Com-municating with other agile teams represents an excellent opportunity to leverage knowledge. In MY, agile software development meetings are organized each month in a different host company. The initiative demonstrates a willingness to mature practices. A low IDV score indicates a collectivist culture were strong relationships exist. This is what was observed in MY and SG agile software development events.
Hypothesis:
• H7: Negative impact of high IDV scores on team’s
external communication E. Team Multidisciplinarity
Multidisciplinary teams are believed to be essential in developing innovative solutions to many types of business problems. It refers to expertise diversity and shared knowledge emerging from intensive collaboration inside the team. During the semi-structured interviews, we asked the participants to comment the way they are managing this Agile value. The interviewed teams in BE reported the lack of multidisciplinar-ity as a medium-level challenge (see Table II). This may be explained by the fact that the BE teams come from a traditional environment structured in skill-centric silos. Individuals are already aware of the issue and making efforts to overcome it by collaborating closer and communicating as much as possible about each other workload. We hypothesize that the organizational culture (conjugated with a high UAI) favors this issue and that the LTO orientation moderate it. In fact, high UAI (94 in BE) relates to a culture where members feel threatened by unknown situations (e.g., learning new skills) and high LTO (82 in BE) refers to a pragmatic culture where individuals invest time in the present to prepare for future change.
In MY, P17, P19 reported unsatisfactory levels of multi-disciplinarity which may confirm the correlation between this value and the UAI dimension (MY has a UAI score of 42). SG practitioners, which have a very low UAI score of 8, have not exposed any issue related with multidisciplinarity.
Hypotheses:
• H8: Negative impact of high UAI scores on team multi-disciplinarity
• H9: Positive impact of high LTO scores on team multi-disciplinarity
F. Team Motivation
Successful organizations understand that teams enthusiasm and motivation is an essential factor for achieving high produc-tivity [29]. Motivating the team in Agile is therefore consid-ered as a critical issue for coaches and managers. Practitioners from BE showed a certain satisfaction about their motivation (referred to as “to keep” during the projects retrospectives) while some MY and SG practitioners showed concerns about it. Practitioners P16, P20 and P21 (see Table III) from MY and SG reported team fatigue as a serious concern, mainly related to very critical time schedules. Team members therefore loose motivation to some practices which they become to consider as unnecessarily time-consuming such as retrospectives (but they commit to them as explained in Section IV-A). One of the cultural dimensions that might be related to motivation is IDG. With a score of 57, BE and MY societies are considered as relatively indulgent. In high indulgence societies, individuals tend to show a positive attitude which helps to maintain team motivation. With a score of 47, the IDG dimension is below the average in SG. This may be explain why the two interviewed practitioners from SG report team fatigue as an essential challenge.
Hypothesis:
• H10: Positive impact of high IDG scores on team moti-vation
G. Customer Involvement
Active user involvement is a key principle of Agile to enable clear understanding and appropriate prioritizing of requirements. It refers to daily basis collaboration between the team and the customer representatives. We asked the participants to explain their relationship with the customers (or customers’ representatives). If the participants don’t have a clear opinion, we ask them to rank this from 0 to 5 to facilitate the discussion.
Some of the MY and SG seem to be unsatisfied about the customer commitment level. P19 (see Table II) reports
concerns about the customer relationship and explains it re-garding the e-Gov domain: “How to convince customers such as representatives of ministries and government agencies?”.
BE participants have also expressed concerns about it. T3 (see Table II), the same team that reports being sometimes confronted directly to customer demands during the iteration (see Section IV-B), raises the problem of customer represen-tatives’ absence in some iteration planning sessions, which impacts on the team velocity and constrains them to make choices about business and priorities. We hypothesize that the customer’s availability issue is related to the organizational culture primarily but may also be impacted by the national culture, in particular the PDI cultural dimension. A high PDI may be correlated with privileged superiors (i.e., the customers in this case), not always following the rules.
Hypothesis:
• H11: Negative impact of high PDI scores on customer involvement
H. Management Buy-in
Top management buy-in regarding agile values is essential to achieve higher maturity. MY and SG practitioners reported top management commitment to Agile. Most of them report that deploying agile practices and improving them is highly supported by the managers. For example, T4 (see Table II) started doing Scrum and later changed to Kanban/Lean on the request of the management. Moreover, they report that such changes impact the team fatigue (such relationship should be further investigated in the future). As discussed in Section IV-B, the involvement of the management might be correlated to the PDI dimension. The greater the PDI score, the more the way of working and informations tend to be controlled.
The same commitment of management in BE is observed even though the initiative came originally from the team level. This also may confirm the implication of the cultural background, since BE has a relatively high PDI score. The management of the 3 BE teams followed a disciplined ap-proach to agile methods adoption (i.e., context study, training, pilot project, etc.). The LTO and UAI dimensions may explain this choice. In BE, the high LTO and UAI scores suggest that individuals will undertake pragmatic steps to prepare the future, in order to minimize unanticipated risks.
Hypotheses:
• H12: Positive impact of high PDI scores on management buy-in
• H13: Positive impact of high UAI scores on management buy-in
• H14: Positive impact of high LTO scores on management buy-in
I. Process Improvement
Assessing and adapting its way of working continuously is a core Agile value. Implementing this value was found challenging in BE, MY and SG, probably because it requires ongoing attention. T1, T2, T3, P16, P20 and P21 (see Table III)
particularly insisted on the lack of commitment to process improvement. When we ask them to detail the reasons for this, they report: (1) the insufficient level of team empowerment (improvement initiatives usually come from top management levels) and (2) the lack of time to think about what should be improved. As explained in Section IV-B, the lack of empowerment might be caused by the PDI dimension (H4) and we hypothesize that the lack of time might actually be a consequence of the LTO dimension. In fact, BE and SG are long-term oriented which means that the individuals need time to effectively adjust their way of working. This might explain the feeling of frustration due to the lack of time.
However, all the interviewed practitioners seem to be aware about the issue: P16, P17, P18 and P20 (see Table III) reported growing interest to mature practices using maturity models such as the Kotters 8 steps to change [30] and the Satir Interaction Model [31].
In BE, process improvement appears to be both a team’s and management’s issue. The 3 teams we interviewed reported considering retrospectives very seriously. P15 (see Table III), a portfolio manager, showed great interest in formal guidance and documentation of the process. This initiative of process modeling may seem opposite to agile values (since work improvement should be the essential measure, not process doc-umentation) but this actually should be considered according to the cultural background and the organization context. BE has a high LTO score, which suggests that individuals will be more pragmatic in change management: they encourage efforts as a way to prepare for the future. Of course, we should mitigate this according to the business domain. In e-government, heavy formalization is a requirement in itself and this is something we observed in BE and MY: T1, T2, T3, T6 and T7 (see Table II).
Hypotheses:
• H15: Negative impact of high PDI scores on process improvement
• H16: Positive impact of high LTO scores on process
improvement
V. DISCUSSION ANDTHREATS TOVALIDITY In Section IV, we discussed the impact of the cultural background on teams’ agile practices in three culturally diverse contexts outside the US: BE, MY and SG. We have been able to observe potential relationships (RQ1) between agile methods adoption and 5 cultural factors (out of the 6 defined in the Hofstede model): PDI, IDV, UAI, LTO and IDG. We derived 16 hypotheses (RQ2) (see Table IV) which basically represent positive or negative correlations between cultural factors and agile values.
In order to be able to validate the plausibility of the hypotheses (RQ2), we tried to find evidence in the literature. Studies corroborating the hypotheses were found, e.g., [32] and [33] which discuss the management role in agile projects in MY and seem to consolidate H1. These studies tend to show that the hypotheses we propose, although not always expressed explicitly, are based on some concrete reality.
We also found studies that assert the impacts of some cultural factors (coherent with the hypotheses we derived) and detail their solutions to overcome the adoption challenges.
For example, [34] investigates the applicability of the partic-ipatory design practice (coming originally from the Scandina-vian and North American context) in the Japanese context. It refers to H5 and explains how team transparency and cohesion can be achieved by building confidence (creating a fun environment) and mitigating the LTO of Japanese by installing certain conditions such as a feel of urgency. In the end, our study seems to show that cultural background has a tangible impact on how agile practices are perceived and applied.
However, it still has several limitations that should be addressed. Firstly, as [11] reminds us, any study addressing culture-related aspects should be cautious not to stereotype individuals through cultural traits. To an extent, our study is not void of such stereotyping. Indeed, by focusing on cultural background instead of individual mental models, our research simplifies complex human relationships but provides a good entry point for practitioners. The study should be regarded as pointing out potential links between cultural background and ease of adoption, individual preferences notwithstanding.
Furthermore, the definition of culture in terms nations is problematic and somehow simplistic. Further studies should explore a more dynamic view of culture, one that sees culture as contested, temporal and emergent.
Another significant threat to validity is the possible cor-relation between the observations and the factors listed in Table I. In fact, the observations reported in this study may be caused by other variables (independent from the national culture), namely, the organizational culture or the projects’ constraints. The decision to consider only the national culture for this analysis was made for simplification reasons (we decided to study one factor at a time). It is motivated by the fact that during the first discussion group, several practitioners reported culture as a critical challenge towards implementing agile methods. Another argument for this decision, may be found in [35] which studies the impact of organizational culture on management practices. He argues that macro-level variables characterizing the cultures of organizations, may not be the most determinant. The micro-level variables, i.e., the behavior of people, continue to retain their cultural identity and have significant impact on the work practices. Therefore, the cultural background of people ought to be studied.
Regarding data collection, the study is based on small data sets that cannot claim statistical relevance in any way. The study should be regarded as preliminary, aiming at pointing out relevant hypotheses to be validated in the future through more sophisticated surveys (i.e., larger scale and more controlled experiments) and using correlation and regression analysis.
Finally, due to the way relationships between cultural di-mensions and data has to be drawn “manually”, our analysis of the data may be undermined by subjective opinions. The input of practitioners during the redaction of this paper is one mechanism designed to overcome this risk but is still not
sufficient. A more systematic approach should be followed in coming research. In the future, increasing the number of analysts (and therefore of inputs) should guarantee a more objective outcome.
VI. CONCLUSION ANDFUTUREWORK
Software engineering is a discipline that is highly sensitive to cultural factors. In particular, several researchers and practi-tioners have recognized that inter-cultural issues in distributed teams has to be taken into account in order to successfully adopt agile practices. In this paper, we investigated the impact of the cultural background in culturally homogeneous teams, that is, teams where no possibility of conflicts arising from cultural differences exists.
In order to understand the impact of the cultural background on which practices are easier to adopt and sustain, we con-ducted a study in culturally diverse contexts (BE, MY, SG). We collected data about practices, challenges and impediments encountered by teams in each context. We then used the Hofstede model to analyze this data and relate success factors of Agile to the model’s cultural dimensions: PDI, IDV, UAI, LTO and IDG.
The results of the study tend to show that the Hofst-ede model helps us find relevant hypotheses regarding the impact of cultural background on practices adoption. These hypotheses, if validated, would help agile practitioners to identify ahead of time the potential challenges that they will be facing inevitably (and therefore to be more prepared to this challenges).
However, these results might be affected by the non-systematic analysis method and by the imbalance of data and therefore should be considered as preliminary, aiming at pointing out potentially relevant hypotheses that should to be validated empirically in the future.
Future work includes the validation of the hypotheses through larger surveys and more controlled experiments. For instance, in this study, the participant groups share more than just cultural differences. Other factors (size, experience, business domain, technology, etc.) vary. In order to validate the actual impact of cultural background, other varying factors should be controlled. Future studies should switch from conve-nience sampling of participants to a more controlled selection (which is only possible if the number of participants is high enough). They should also go further by investigating the same research question in other contexts than those we studied (BE, MY and SG).
ACKNOWLEDGMENTS
This research was supported by travel grants from the Wal-loon Ministry of Higher Education. We thank our colleagues from the University of Technology of Malaysia especially Prof. Imran Ghani who facilitated access to companies and provided insight and expertise that greatly assisted the research. We thank also all the participants to the interviews for their commitment and interest. We thank Rameeza Musthafa from iProperty Malaysia and Colin Pal from booster Malaysia for their constructive comments about this work.
REFERENCES
[1] S. W. Ambler and M. Lines, Disciplined agile delivery: A practitioner’s guide to agile software delivery in the enterprise. IBM Press, 2012.
[2] D. Leffingwell, “Scaled agile framework,” Online at: http://scaledagileframework. com, 2013.
[3] L. Laroche, Managing cultural diversity in technical professions. Routledge, 2012.
[4] E. MacGregor, Y. Hsieh, and P. Kruchten, “The impact of intercultural factors on global software development,” in Canadian Conference on Electrical and Computer Engineering, 2005. IEEE, 2005, pp. 920–926.
[5] T. Chow and D.-B. Cao, “A survey study of critical success factors in agile software projects,” Journal of Systems and Software, vol. 81, no. 6, pp. 961–971, 2008. [6] D. Stankovic, V. Nikolic, M. Djordjevic, and D.-B. Cao, “A survey study of critical success factors in agile software projects in former yugoslavia it companies,” Journal of Systems and Software, vol. 86, no. 6, pp. 1663–1678, 2013.
[7] P. Kruchten, “Contextualizing agile software develop-ment,” Journal of Software: Evolution and Process, vol. 25, no. 4, pp. 351–361, 2013.
[8] S. Lee and H.-S. Yong, “Distributed agile: project man-agement in a global environment,” Empirical Software Engineering, vol. 15, no. 2, pp. 204–217, 2010. [9] M. Fowler, “Using an agile software process with
offshore development,” Online at: http://martinfowler. com/articles/agileOffshore. html, 2006.
[10] H. Holmstr¨om, B. Fitzgerald, P. J. ˚Agerfalk, and E. ´O. Conch´uir, “Agile practices reduce distance in global soft-ware development,” Information Systems Management, vol. 23, no. 3, pp. 7–18, 2006.
[11] G. Borchers, “The software engineering impacts of cultural factors on multi-cultural software development teams,” in Proceedings of the 25th international confer-ence on Software engineering. IEEE Computer Society, 2003, pp. 540–545.
[12] T. Morden, “Models of national culture: a management review,” Cross Cultural Management: An International Journal, vol. 6, no. 1, pp. 19–44, 1999.
[13] M. Chen, Asian management systems: Chinese, Japanese and Korean styles of business. Cengage Learning EMEA, 2004.
[14] C. Cragg, “The new taipans a vital source book on the people and business of the pacific rim,” 1995.
[15] R. S. Bhagat and R. M. Steers, Cambridge handbook of culture, organizations, and work. Cambridge University Press, 2009.
[16] G. Hofstede, “Dimensionalizing cultures: The hofstede model in context,” Online readings in psychology and culture, vol. 2, no. 1, p. 8, 2011.
[17] ——, Culture’s consequences: Comparing values,
behav-iors, institutions and organizations across nations. Sage, 2001.
[18] E. T. Hall et al., The silent language. Doubleday New York, 1959, vol. 3.
[19] R. Lewis, Finland, cultural lone wolf. Nicholas Brealey Publishing, 2011.
[20] F. Fukuyama, Trust: The social virtues and the creation of prosperity. Free press New York, 1995.
[21] F. R. Kluckhohn and F. L. Strodtbeck, “Variations in value orientations.” 1961.
[22] C. Hampden-Turner and F. Trompenaars, The seven cul-tures of capitalism. Doubleday New York, 1993. [23] R. J. House, P. J. Hanges, M. Javidan, P. W. Dorfman,
and V. Gupta, Culture, leadership, and organizations: The GLOBE study of 62 societies. Sage publications, 2004. [Online]. Available: http://globeproject.com/ [24] L. Schmitz and W. Weber, “Are hofstede’s dimensions
valid? a test for measurement invariance of uncertainty avoidance,” interculture journal: Online-Zeitschrift f¨ur interkulturelle Studien, vol. 13, no. 22, pp. 11–26, 2014. [25] B. McSweeney, “Hofstedes model of national cultural differences and their consequences: A triumph of faith-a failure of analysis,” Human relations, vol. 55, no. 1, pp. 89–118, 2002.
[26] G. Hofstede, “Dimensions do not exist: A reply to brendan mcsweeney,” Human relations, vol. 55, no. 11, pp. 1355–1361, 2002.
[27] ——, “Hofstede cultural dimensions,” Online at : https://geert-hofstede.com/, 2010.
[28] A. Alliance, “Agile alliance home,” Online at: http://www.agilealliance.org, 2008.
[29] G. Asproni, “Motivation, teamwork, and agile develop-ment,” Agile Times, vol. 4, no. 1, pp. 8–15, 2004. [30] J. P. Kotter et al., “Leading change: Why transformation
efforts fail,” 1995.
[31] V. Satir and J. Banmen, The Satir model: Family therapy and beyond. Science & Behavior Books, 1991. [32] A. L. Asnawi, A. M. Gravell, and G. B. Wills, “Empirical
investigation on agile methods usage: issues identified from early adopters in malaysia,” in International Con-ference on Agile Software Development. Springer, 2011, pp. 192–207.
[33] ——, “Emergence of agile methods: perceptions from software practitioners in malaysia,” in 2012 Agile India. IEEE, 2012, pp. 30–39.
[34] M. Yasuoka and R. Sakurai, “Out of scandinavia to asia: adaptability of participatory design in culturally distant society,” in Proceedings of the 12th Participatory Design Conference: Exploratory Papers, Workshop Descriptions, Industry Cases-Volume 2. ACM, 2012, pp. 21–24. [35] J. Child, Culture, contingency and capitalism in the
cross-national study of organizations. University of Aston Management Centre, 1979.

![Fig. 1. US, BE, MY and SG Cultural Dimensions according to [16]](https://thumb-eu.123doks.com/thumbv2/123doknet/14503378.719680/6.918.503.803.113.271/fig-sg-cultural-dimensions-according.webp)