HAL Id: hal-02938806
https://hal.archives-ouvertes.fr/hal-02938806
Submitted on 15 Sep 2020HAL is a multi-disciplinary open access
archive for the deposit and dissemination of sci-entific research documents, whether they are pub-lished or not. The documents may come from teaching and research institutions in France or abroad, or from public or private research centers.
L’archive ouverte pluridisciplinaire HAL, est destinée au dépôt et à la diffusion de documents scientifiques de niveau recherche, publiés ou non, émanant des établissements d’enseignement et de recherche français ou étrangers, des laboratoires publics ou privés.
Electrochemical Cells
Maxime Remond, Jongun Hwang, Jinbo Kim, Donghwan Kim, Christophe
Bucher, Yann Bretonnière, Saeon Kim, Chantal Andraud, Eunkyoung Kim
To cite this version:
Maxime Remond, Jongun Hwang, Jinbo Kim, Donghwan Kim, Christophe Bucher, et al.. Push–Pull Dyes for Yellow to NIR Emitting Electrochemical Cells. Advanced Functional Materials, Wiley, In press, �10.1002/adfm.202004831�. �hal-02938806�
1 DOI: 10.1002/ ((please add manuscript number))
Article type: Full paper
Push-Pull Dyes for Yellow to NIR Emitting Electrochemical Cells
Maxime Rémond+, Jongun Hwang+, Jinbo Kim, Saeon Kim, Donghwan Kim, Christophe Bucher, Yann Bretonnière, Chantal Andraud, and Eunkyoung Kim*
Dr. M. Rémond, J. Hwang, J. Kim, S. Kim, D. Kim, Prof. Dr. E. Kim Department of Chemical and Biomolecular Engineering, Yonsei University 50 Yonsei-ro, Seodaemun-gu, Seoul 03722, South Korea
E-mail: [email protected]
Dr. C. Bucher, Dr. Y. Bretonnière, Dr. C. Andraud,
Univ Lyon, ENS de Lyon, CNRS UMR 5182, Université Lyon I, Laboratoire de Chimie, Lyon 69342 Cedex 07, France
Prof. Dr. E. Kim and Dr. C. Andraud
Building Blocks for Future Electronics Laboratory, UMI 2002, CNRS-Sorbonne Université-Yonsei University, Université-Yonsei University
50 Yonsei-ro, Seodaemun-gu, 03722 Seoul, Korea
Keywords: organic light-emitting electrochemical cells, fluorescent materials, near-infrared, host/guest
Push-pull (D-π-A) dyes were explored for organic light-emitting electrochemical cells (LECs) taking advantages of their tunability in the intramolecular charge transfer (CT) through a π-bridge between donor and acceptor. These dyes presented high thermal stability beyond 290 °C and fluorescence quantum yields (Φf), and simple thin film processibility. The
fluorene-based dyes with diphenylamine donor (DPF) showed high tunability in electroluminescence wavelength up to 825 nm, which correspond to the most red-shifted metal-free LECs up to date. The DPFs showed high irradiance under a low working voltage in the presence of poly(9-vinylcarbazole) (PVK) and 2,5-bis(5-tert-butyl-benzoxazol-2-yl)thiophene (BBOT) hosts. As the CT distance of dyes was increased, Von of the LECs was
2
π-bridge and acceptor (AA of dye was critical to increase irradiance, for a closerdye-host proximity. Thus a DPF dye with the lowest AA (dye I) afforded the highest irradiance of 425 µW/cm2 (>220 Cd/m2) among the dyes in this study. Therefore push-pull dyes could provide a rational material design principle towards NIR emitting LECs.
1. Introduction
Light-emitting cells (LECs) are electrochemical devices composed of a mixture of an emitting dye and an electrolyte sandwiched between two electrodes. Application of a voltage results in redistribution of the ions, followed by electrochemical doping of the active layer by injected charges and thus the in situ generation of a p-n junction within the emitting layer.[1,2] Ultimately, recombination of the injected holes and electrons in excitons enables electroluminescence (EL) from the emissive material. Compared to well-known organic light-emitting diodes (OLEDs), these LECs have unique advantages, such as simple device structures and a low driving voltage, and the possibility of using air-stable electrodes as a result of this electrochemical doping process.[3,4] However, this doping also leads to several drawbacks, such as a longer turn-on time and lower efficiency, that will need to be addressed before practical application.[5]
Most LEC devices are based on a fluorescent conjugated polymer (CP) or an ionic transition metal complex (iTMC) as the emitting material.[6–9] Over the last decade, these two types of materials have yielded LEC devices with exceptional brightness.[10–12] However, CPs suffer from low purity levels that can generate unwanted side reactions, and iTMCs suffer from the scarcity and high cost of iridium and ruthenium complexes. Recently, Edman et al. demonstrated that small molecules could undergo the same peculiar LEC mechanism and could be used as alternative light-emitting materials for LECs.[13] Since then, many families of classical organic dyes, such as perylenes,[14] cyanines,[15] porphyrins [16,17] and thermally
3
activated delayed fluorescence (TADF) dyes, [18,19] have been incorporated into the emissive layer.[20] Similar to CP- and iTMC-based LECs, the performance of LECs using small molecules is highly dependent on interchromophore interactions in thin films. As in organic light-emitting diodes, the use of solid-state emitters or the design of multicomponent host/guest systems are possible ways to minimize exciton quenching in the active zone of LECs with small molecules.[10,13,21]
Nonetheless, the LEC performance of typical organic chromophores is still quite low compared to that of CP and iTMC counterparts. In this context, the design of small, metal-free dyes for LEC devices is a challenging task, especially in the near-infrared (NIR) region, where the low bandgap usually leads to low luminescence and EL efficiencies.[22–28] Among the organic chromophores, push–pull (D-π-A) dyes present unique intramolecular charge transfer (ICT) properties, which can be fine-tuned by changing the donor (D), acceptor (A), and π‐ bridge. During the ICT process, significant polarization changes in the whole π‐ system of the dye control not only the optical properties but also intermolecular interactions, which are critical for the modulation of EL properties.[29] In this context, D‐ π‐ A molecules could become an important class of light-emitting materials due to their dipolar charge transfer nature, capability of band-gap and luminescence optimization through molecular engineering and spectral tunability in far-red to NIR emission.[30,31]
Herein, we present push-pull dyes with a diphenylamine (DP) or carbazole (Cz) as donor, and indandione and 2,5-dihydrofuran as acceptor groups. Fluorenyl (F) or an unsubstituted ethene derivative (E) was introduced between the donor and acceptor as a π-bridge. These dyes feature high thermal stabilities and solution processibility for film formation with the distinct CT nature of the push-pull dyes. Host materials for these dyes were explored by tuning their energy levels and spectral overlaps. A low-voltage working organic LEC could be obtained for dye I with a peak irradiance of 425 µW/cm2. In addition,
4
NIR LECs emitting at 825 nm and 800 nm were obtained with peak irradiances of 19 µW/cm2 and 123 µW/cm2 from dye III in the 1,3-bis[2-(4-tert-butylphenyl)−1,3,4-oxadiazo-5-yl]benzene (OXD-7) and 2,5-bis(5-tert-butyl-benzoxazol-2-yl)thiophene (BBOT) hosts, respectively. These low-cost NIR LECs would be particularly interesting for lightweight military, medical or security authentication technologies.[32]
2. Results and Discussion
2.1. Optical and electrochemical properties of push-pull dyes
The five push-pull dyes (Figure 1a) show yellow to NIR emission and diverse optical and electrochemical properties. DPF dyes (I-III) undergo ICT though a fluorene π-bridge between diphenylamine and an acceptor group: 1,3-indandione (I), 2-(dicyanomethylene)-3-phenylthio-4,5,5-trimethyl-2,5-dihydro-furan (II) and 2-(dicyanomethylene)-3-phenylsulfonyl-4,5,5-trimethyl-2,5-dihydro-furan (III).[30,31] Dye IV contains N-(2-methoxyphenyl)carbazole as the donor and the same acceptor as II. Finally, dye V contains
N-ethylcarbazole as a donor and 4,5,5’-trimethyl-3-(phenylsulfonyl)furan-2(5H)-one as an
acceptor.[33] Dye IV was synthesized by Knoevenagel condensation between 4-(9H-carbazol-9-yl)-3-methoxybenzaldehyde and 2-(dicyanomethylene)-3-phenylthio-4,5,5-trimethyl-2,5-dihydro-furan under microwave irradiation (Scheme S1). The synthesis of the other dyes, also by Knoevenagel condensations, was previously described.[30,31,33].
The thermal properties of the dyes showed high melting points (> 225 °C) as well as excellent thermal stability (> 290 °C), as determined by differential scanning calorimetry (DSC) and thermal gravimetric analysis (TGA) (Figure S2 and Table S1). In particular, dyes
I and II showed the best thermal stability and the highest thermal degradation temperature for
5
high (290 °C). Thus, dyes I-V feature high thermal stabilities, well above the typical annealing temperatures used during the film forming process or the operation temperatures. Finally, glass transitions (Tg) were observed for dyes I (80 °C), II (100 °C), III (125 °C) and
V (95 °C). Emitters with a high Tg are of particular interest for light-emitting devices because they are able to form stable amorphous films.
The optical properties of the dyes in chloroform and crystalline powder are represented in Figure 1b and Figure S3. The DPF dyes (I-III) are strongly fluorescent in the far-red to NIR region in dilute apolar solutions (674-788 nm in chloroform), with high photoluminescence quantum yields (PLQYs) of 51-30 %, arising from the rigid fluorene bridge. The lifetimes of the dyes in chlorobenzene are in the nanosecond range (Figure S3b). Dye I showed the longest lifetime, while III showed the fastest decay among the DFP dyes, as listed in Table 1. Importantly, those dyes are emissive in the solid-state, notably in crystalline powder, due to the nonplanar DP units. In particular, dyes I and II produce strong solid-state fluorescence with PLQYs of 22 % and 28 %, respectively, in powder. On the other hand, due to its small bandgap, the powder of III exhibits a lower PLQY of 9 % (Table 1). However, this value is still remarkable considering the emission in the NIR region (emission maximum of 800 nm).
In comparison, the optical properties of CzE dyes (IV and V) are blue-shifted, as expected from the lower donating capacity of carbazole (Cz) and their shorter π-bridge (E). In dilute chloroform solution, these two dyes are moderately (11 %) and weakly (< 1 %) emissive, respectively. The reduced PLQY of these dyes in solution may be attributed to enhanced intramolecular motions and the formation of a twisted configuration aound the π-bridge in solution, which is characteristic of AIEE dyes. Nevertheless, their crystalline powders are strongly emissive in the orange/red region, with PLQYs of 45 % at 640 nm and 33 % at 600 nm, respectively.
6
All dyes in this study showed strong solvatochromism due to their strong push-pull character (Figure S4 for dyes IV and V; see also ref for I-III,[30][31][31]). The Lippert-Mataga model was used to fit the Stokes shifts of the dyes to the solvent orientation polarizability (f) (Figure S5, Table S2).[34,35] The Onsager radii were estimated from Suppan’s equation[36] (see SI) using the density obtained from X-ray diffraction on single crystals.[31,33,37] From those Onsager radii (Table S2), dipole moment variations from 16~19.1 (I~ IV) to 9.6 D (V) were determined. Thus, the dipole moment increase upon excitation of dyes I-IV is approximately twice as strong as that of dye V. Finally, it is interesting to note that all dyes present large Stokes shifts (5000-7500 cm-1), also characteristic of their strong intramolecular CT, so low auto-absorption can be expected in the films.
The HOMO and LUMO levels of the dyes were estimated from cyclic voltammetry (CV) measurements conducted at 100 mV/s in degassed dichloromethane solutions using tetra-n-butylammonium perchlorate (TBAP) as supporting electrolyte (Figure 1c). The CV curves recorded at a vitreous carbon electrode revealed that the DPF dyes (I ~ III) are reversibly oxidized at similar oxidation peak potential values (0.67 V, 0.65 V and 0.67 V, respectively), which is consistent with a triarylamine-centered oxidation (N(Ar)3 N+(Ar)3). Conversely, these compounds were found to be irreversibly reduced over a quite broad potential range, i.e., from -0.75 to -1.5 V, with potential shifts varying with the electron-withdrawing degree (EWD) of the substituents introduced on the acceptor part. As shown in Figure 1c, increasing the strength of the EWD results in a large shift of the reduction potential towards more positive values, i.e., from Epeak =-1.33 V for dye I and -1.20 V for dye II to -0.92 V for dye III. The HOMO and LUMO energies (Table S1) determined from CV suggest that the DPF dyes have similar HOMO energy levels, approximately -5.2 eV, while their LUMO levels decrease with the EWD of the substituents, from -3.36 eV (I) to -3.75 eV
7
(III). The red-shift of absorption and emission for dyes I~III were well matched to the CV results.
The CV curves of the CzE dyes (Figure 1c) reveal that dyes IV and V are irreversibly oxidized at higher potential values than the DPF dyes, which is consistent with the fact that carbazoles are weaker donors than DP. It should be noted that dyes II and IV, featuring an identical acceptor group, are reduced at similar potential values, i.e., at -1.20 V and -1.14 V, respectively. The HOMO energies of dyes IV and V are approximately -5.6 eV, and the LUMO energies are -3.52 eV and -3.27 eV, respectively. Both electrochemical and optical bandgaps (Table S1) show the same tendency with a bandgap decrease in the order of dye V>
IV > I > II > III.
Geometry optimizations of the ground state of the dyes in vacuum were carried out using density functional theory (DFT) with the Gaussian 09 program[38] using the B3LYP functional and the 6-31G (d,p) basis set. The optimized structures and the HOMOs and LUMOs are represented in Figure S6. The DPF dyes and dye IV displayed rather distorted structures upon geometry optimization, possibly due to steric hindrance from the donor groups (Table S3) with a large angle (~ 35 ° between the donor and -bridge (AD Interestingly, the angles between the -bridge and the acceptor (AA were much smaller than AD. Dyes with a large angle sum (AD plus AA) form distorted structures projected from the central -bridge. These distorted structures were confirmed by the single crystal X-ray diffraction (XRD) data [31,33,37] of dyes I-III and V, which show larger AD than AA that mached well to the calculated results (Table S3). The interchromophore dye-dye stacking distance increased in the order I < II < V << III (FigureS7). Even though the dyes will probably arrange themselves in a different way in the amorphous thin films, especially in
8
host/guest systems, we can still expect similar steric hindrance and, thus, the same order of proximity between the dyes and their surrounding host molecules.
2.2. LEC properties of push-pull dyes without host and with single host
To examine the LEC properties of dyes, we first examined a simple device structure, without a host, where the emitting layer is composed of the dye mixed with tetrahexylammonium tetrafluoroborate (THAB) in a 4:1 molar ratio of dye to electrolyte. This layer was sandwiched between a 35 nm thick poly(3,4-ethylenedioxythiophene):poly(styrene sulfonate (PEDOT:PSS)-coated indium-tin oxide (ITO) anode and a 100 nm thick aluminum cathode (Figure 2, inset). Under a pulsed current (PC) driving mode (50 % duty cycle, 235Hz, Figure S8), red to NIR light emission was observed instantaneously (< 1 s) from the device built with DPF dyes (I-III) (Figure 2a and b). In the following sections, the films and devices with a dye in THAB will be called by the combination of the dye number and initial of THAB, e.g., I/T is the LEC device with dye I and with THAB as electrolyte, without a host.
The EL emission maximum (em) of I/T was observed at 630 nm, which is ~10 nm blue-shifted from the PL emission of the I/T film (642 nm). Both the EL and PL of I/T were strongly blue-shifted, by 44 and 32 nm, respectively, compared to the dye’s emission in chloroform (674 nm). Moreover, the absorption spectra of I/T films at 483 nm was also blue-shifted by 20 nm compared to the that of I in solution (Table 1) or in a host (see below). As described above and by XRD (Figure S7), dye I had the shortest dye-dye distances leading to large dye-dye interactions. The small π-A anglein the crystal structure allows stacking of I on the acceptor side. Thus, the blue-shifts in PL and EL can be attributed to strong dye-dye H-type stacking. The peak EL irradiance of the I/T device was quite low (22 µW/cm2), possibly due to aggregation induced quenching by H-type stacking of dyes and a high injection barrier (Table S4).
9
On the other hand, II/T showed relatively high EL emission (157 µW/cm2) with a em at 738 nm (Figure 2a and b), which agrees well with the PL emission maximum of the II/T thin film (737 nm). The EL was red-shifted by 20 nm compared to the PL of II in CHCl3 (Table S4), indicating that dye II does not form H-type stacking. Dye III showed an impressive EL at emof835 nm with a maximum irradiance of 47 µW/cm2. The red-shift of the EL and PL emissions of dyes II and III in THAB compared to those in CHCl3 can be attributed to the strong positive solvatochromism of the push-pull dyes. In contrast, no emission was observed from the IV/T and V/T devices, mainly due to their high injection barrier (Table S4).
In the dye/T devices, carrier transport is limited by the presence of traps, and the excitons generated in the p-n junction experience severe exciton-polaron quenching, reducing the EL emission.[10] Moreover, most push-pull dyes are known to be progressively quenched as the polarity of their medium increases. Indeed, the QY of those push-pull dyes decreased in higly polar solvents (Figure S4), which agreed well with previous reports [30,31].
To tackle those problems in LEC devices, a host/guest system was employed using the model developed for tris[2-(5-substituent-phenyl)-pyridinato]iridium(III) (Ir(R-ppy)3.[10] In this multicomponent host/guest system, excitons are trapped on isolated guest (dye) molecules, hindering exciton diffusion and quenching. Additionally, the use of a host could be beneficial for dye I, as the host molecules reduce the dye stacking described above. Furthermore, nonpolar host molecules would reduce the polarity of the active layer, which should increase the PL efficiency of the push-pull guests.
First, single host systems having only a p-type or n-type host were explored with dye I. Considering its energy level and p-type nature, poly(9-vinylcarbazole) (PVK) was selected as a p-type host,[10] while two different n-type hosts, BBOT[39,40] and OXD-7, were examined to tune the n-doping effect (Figure 2c). The weight ratio of the host (PVK, BBOT or
OXD-10
7):dye:THAB was 64.6:29:6.4. The energy levels of each component are represented in Figure 2d, showing the energy levels of dyes are included inside those of the host compounds. Moreover, the position of the oxidation and reduction potential of the dyes (Figure 1c) and of the hosts (ref[10] and Figure S9) suggests that doping of the guest is thermodynamically preferable to the host doping. This significantly eliminates traps in the doped region, increasing carrier mobility. Finally, it is important to note that THAB has a large electrochemical stability domain and should not generate side electrochemical reactions.
In the following sections, the devices will be named according to the combination of the initials of the constituents of the active layer (P for PVK, B for BBOT and O for OXD-7), e.g., I/PT represents the LEC device with dye I in a PVK host with THAB as the electrolyte, while I/PBT represents the LEC device of dye I with PVK and BBOT (dual host) with THAB as the electrolyte.
In the I/PT device, EL emission from the guest molecules was observed only at 655 nm (Figure 3a, blue), indicating complete energy transfer from PVK to the dye molecules. The red-shift of the EL emission (25 nm) and the PL emission (15 nm) of I/PT, compared those of to I/T, indicates less dye aggregation upon addition of the PVK host. However, the maximum intensity was slightly decreased to 14 µW/cm2 (3.7 Cd/m2), as presented in Figure 3b (top, blue). Compared to the other devices, I/PT operated at a low current density and high voltage, which may be originated from the resistivity of the I/PT layer. Indeed, PVK cannot be electrochemically reduced easily, preventing n-doping and generating unwanted side reactions near the cathode that hinder conductivity.[21] In addition, the electron injection barrier is still high, which could explain the low irradiance.
In the presence of an n-type host only, the EL spectra were blue-shifted, as compared to those of the I/PT devices, shifting to 641 nm for I/BT and 651 nm for I/OT devices (magenta and cyan line, respectively in Figure 3a and b top). More interestingly, the EL
11
intensities of I/BT (78 µW/cm2) and I/OT (151 µW/cm2) were greatly enhanced compared to those of I/PT or I/T devices, corresponding to 6-fold and 12-fold increases, respectively (Figure 3a). I/BT and I/OT emitted at similar voltage (Figure 3b) but their working voltage was much lower than that of I/PT. This could be attributed to the formation of an effective n-doped region by BBOT and OXD-7, which decreased the resistivity and increased the irradiance of I/BT and I/OT. It is noteworthy that this irradiance increase is correlated to the lowering of the injection barrier or trap depth sum, while the turn-on voltage (Von) of the
devices increased with increasing injection barrier sum or trap depth sum (Table S4 and Figure S10).
2.3. LEC properties of dye with dual hosts
A dual host system with both p- and n-type hosts was explored for dyes with THAB. The components were blended in a 32.3:32.3:29:6.4 weight ratio for PVK, the electron transporting host, the dye and THAB. The EL emission maximum was 635 nm and 660 nm for I/PBT and I/POT, respectively (red and green line, respectively, in Figure 3a and b top), and the EL irradiance was dramatically enhanced to 425 µW/cm2 and 386 µW/cm2, respectively. The more blue-shifted EL emission of I/PBT compared to I/POT is believed to originate from the lower polarity of BBOT (see later) rather than from aggregation, as there was no blue shift of the absorption of I in the I/PBT film (Table S5, Figure S20). Although it was experimentally dificult to obtain the same thickness of the active layer, due to the difference in the solubility and processability of the hosts (Table S4), the enhancement of EL irradiance was obvious. For I/PBT, the enhancement corresponded to a 19-fold increase compared to that of I/T and a 5-fold increase compared to that of the single host BBOT device (I/BT). Such dramatic enhancement of the dual host LEC system could be ascribed to the balancing of carrier mobility and a decrease in the trap depth.
12
Impedance spectroscopy was used to investigate the host’s effect on the device’s impedance and capacitance (Figures S11-13) with I/T, I/PT, I/POT and I/PBT. First of all,
I/PT showed negligible effect of the applied DC voltage (0 to 6 V range) on the resistance
and capacitance due to its high turn-on voltage and lack of n-doping capacity. On the other hand, in the I/T, I/POT and I/PBT devices, increased applied voltage results in lower impedance and higher capacitance. Upon electrochemical doping, electrical conductivity was enhanced, notably from traps suppression. The ionic conductivity of the devices was decrease due to the localization of ions near the electrodes by the electrical field. The high resistance values of I/PT and I/POT are well matched with their low current density operation. Finally, the largest ionic conductivity at high voltage was observed for I/PBT devices, which may be attributed to the favorable host-dye I interactions (Fig 4 c) that could provide well-ordered ionic channels for electrical conduction.
The influence of the dye concentration on the I/PBT device was investigated. As shown in Figure S14, the maximum emission intensity was increased as the dye concentration was increased up to 17.1 mol % in the mixture. A further increase in the dye concentration (to 23.2 mol %) led to an ~ 5 % decrease in the peak irradiance of the LEC, indicating that the optimum concentration of dye would be approximately 17 ~ 23.2 mol %. In contrast, the PL emission of I/PBT films with the same dye concentrations was inversely proportional to the dye concentration (Figure S14b). Both PL and EL showed a red-shift of the emission as the dye concentration was increased from 5 mol % to 23.2 mol %, even though this red-shift was more marked in PL (24 nm) than in EL (9 nm). The morphology of the film with 23.3 mol % was rougher than that of the films with lower dye concentrations, as determined from the SEM images (Figure S15). Thus, further studies on the LEC properties of other dyes and hosts with a dye concentration of approximately 17 mol % were performed.
13
Dyes II-V were investigated in POT and PBT devices. Figure 3b and c present the voltage and irradiance variations with different applied average current densities and the normalized EL spectra, respectively, for the POT and PBT devices. First, with the POT host, dye IV emitted red light (633 nm) with a peak irradiance of 35 µW/cm2, but the V/POT devices were still not emissive. Compared to the devices without a host (II/T), the EL emissions of II/POT and III/POT were blue-shifted by 23 and 10 nm, as expected from the lower polarity. The PL of dye II was also blue-shifted in II/POT. The maximum irradiance was more than doubled for dye II/POT, reaching 364 µW/cm2 . However, the irradiance of
III/POT was halved upon inclusion in this host system. This can probably be explained by
the mediocre overlap between the emission of the PVK/OXD-7 host (420 nm) and the absorption of dye III (Figure 3c, bottom), resulting in low Förster resonance energy transfer (FRET). On the other hand, the exciplex emission of the PVK/BBOT host (490 nm) perfectly overlaps with the absorption of dyes I and II in chloroform solutions and has a decent overlap with the absorption of III in CHCl3 (the absorption in the thin films is very close to the absorption in solution; see Figure S16a). Thus, the combination of PVK and BBOT should lead to a more efficient FRET to dye III compared to the PVK/OXD-7 pair. Moreover, the lower LUMO of BBOT (-3.16 eV, Figure 2d) should lead to more equilibrated doping states.
With this dual host, the irradiance of II/PBT was approximately 2.5 times higher than the II/T devices (Table 1) and increased ~10 % compared to II/POT, to reach 397 µW/cm2 at 705 nm. The irradiance of III/PBT was remarkably enhanced as compared to that of III/T (2.5-fold) and III/POT (almost 4 times), reaching a peak irradiance of 123 µW/cm2 at 800 nm.
IV/PBT emitted in the orange region (λem = 601 nm) with an irradiance of 41 µW/cm2, slightly increased compared to that of the IV/POT devices. Finally, V/PBT emitted yellow light (λem= 550 nm) with a modest peak irradiance of 0.63 µW/cm2.
14
Thus, the dyes showed a large enhancement of the EL intensities upon incorporation in dual host systems. In both POT and PBT devices, only emission from the guest dyes was detected, indicating complete energy transfer from the host to guest molecules. The emission of dyes was higher in the PBT devices than in the POT devices, probably due to the lower ELUMO of BBOT and less exciton quenching from the reduced polarity of the PBT films. Indeed, when comparing the dye/POT and dye/PBT films, a blue-shift of the PL and the EL was observed upon substitution of OXD-7 by BBOT. This polarity difference can be explained by the different geometry around the central aromatic (2,5-thiophene versus 1,3-phenyl) and different partial compensation of the two dipole moments from each acceptor group to the central core of these quadrupoles (calculated ground-state dipole moment of 6.2 D for OXD-7 and 1.3 D for BBOT, as shown in Figure S9b).
2.4. Effect of host on the working voltages and maximum brightness of the devices
Figure 3d presents a schematic diagram of the charge separation over a p–n junction, as well as the charge transport and radiative recombination in a dual host LEC device, at steady state under an applied electrochemical stimulus. Compared to the open circuit state (Figure S16b), the applied current generates the average probed voltage (Vap) (Figure 2b for
example) that ultimately triggers charge separation and radiation. It is noteworthy that the Vap
was sharply increased but doomed to start from the current that turns on irradiance (Figure 2b), which corresponds to Von. This semi-stable Vap region with a sharp increase in radiation
corresponds to the radiative recombination region. At a low current density, charge separation occurs as the dyes undergo a redox reaction. At the same time, charge balancing ions move towards each electrode. The cations on the n-doping side (and the anions on the p-doping side) of the p-n junction diffuse towards the emission region, resulting in an ionic concentration gradient over the junction. This opposing voltage generated by the diffusive ion
15
motion decreases the rise in Vap as it compensates for the electrostatic potential over the
junction.[41] As the ion drift and transport motion could be affected by the charge separation as well as the p- and n-doping, the voltage profile was largely affected by the dyes and host (Figure 4a and b). As shown in Figure 4a, Von was increased for a larger injection barrier, as
expected from the energy levels of dyes, host, and electrodes (Figure 2d). Interstingly, as the CT distance of dyes was increased, Von of the LECs was decreased, mainly due to that the
extended conjugation from the donor to acceptor may facilitate carrier transport.
A striking feature of the BBOT host is its lower Von and operating voltage compared to
those of the OXD-7 devices despite the similar injection barrier, trap depth and CT distance in both host systems (Figure 4a and Figure S10). The voltages at the maximum irradiance (Vmax)
were also decreased, from the POT devices (9-13 V) to the PBT devices (7-10 V) as summarized in Table S4. This voltage drop for the BBOT host system could originate from the lower bandgap of the PVK/BBOT host as well as the easier electrochemical doping of BBOT compared to OXD-7. Indeed, BBOT is reduced at -1.9 V vs Fc/Fc+ (Figure S9a), whereas OXD-7 at approximately -2.2 V vs Fc/Fc+.[10] In addition, considering the different anion and cation volumes (58 Å3 vs 450 Å3)[42], the ionic mobility of BF4- should be considerably higher than the mobility of THA+. This should lead to higher anion near the anode than cation concentration near the cathode and thus higher p-doping possibilities. Then, the effect of n-doping would be significantly large enough to differentiate the OXD-7 against BBOT.
On the other hand, the peak irradiances of dye/POT and dye/PBT were correlated with several parameters. The irradiance increased as the quantum yield (QY) and lifetime of dyes in solution increased (Figure 4d red and green, respectively). Moreover, it decreased as the electron trap depth or dipole moment transition of the emitting layer increased (Figure S17a and b), except for dye V, due to the enhanced barrier to overcome. Notably, the
16
correlation of the QY of dyes for the solid powder against peak irradiance was poor (Figure S17c), indicating that the dye-dye interaction or H-stacking of dyes are unlikely in the presence of host. Instead, dye-host interactions become important, and the host behaves like a solid solvent. Moreover, the irradiance was inversely proportional to the angle sum (AD plus AA) (Figure 4b, blue), except for dye V in PBT. As described above, dyes with large angles form distorted structures projected from the central -bridge. These distorted structures would have difficulty interacting with the host because of steric hindrance. Instead, Figure 4b indicates that dyes with more planar structures (low angle sum) could allow proximity between the dyes and their surrounding host molecules (Figure 4c), leading to larger energy transfer from the host to guest dyes and eventually to provide larger irradiance. Dye V in PBT was an outlier from these correlations, possibly due to the low peak irradiance arising from the high injection barrier sum.
As all the devices operate in different current and voltage ranges, it is of interest to compare their peak external quantum efficiency (EQE) and current efficiency . I/POT showed the highest peak EQE (0.49%). Interestingly, the peak EQEs of dye II are quite high considering its emission in the NIR region (Table S4 and Figure S17d).
Operation stability is of great importance for displays. The operation stability of
I/POT and I/PBT devices are shown in Figure 4d and e, respectively. It was investigated
upon turn-on and turn-off for 3 s with 3 measurements at each cycles at a similar emitted brightness of 20 Cd/m2. Both devices showed good switchability over multiple cycles, possibly due to the electrochemical stability of the push pull dyes involved. Notably, the EL intensity of LEC devices increased by 5 ~ 15 % within 5 cycles compared to the first turn-on and then remained stable even after 30 ~ 40 cycles. This increase could be caused by a difference in the doping and dedoping speeds resulting in a growth of the doped region between each cycle, thus emission enhancement. After 300 s, a small but obvious decrease of
17
the EL intensity is observed from the I/PBT device. This could be due to the higher average pulsed current (222 mA/cm2) application to I/PBT as compared to that for I/POT devices (11 mA/cm2), leading to higher joule heating, thus higher temperature and faster degradation. The stability was also investigated upon constant pulsed current application. The average voltage and irradiance variations for I/T (driven at 100 mA/cm2), I/POT (driven at 30 mA/cm2) and
I/PBT (driven at 111 mA/cm2) over time are shown in Figure S18. When driven with a constant pulsed current, a decrease of the voltage can be observed during the first 10-20 s and can be attributed to the electrochemical doping of the active layer. The peak irradiance was reached in a few seconds (I/POT) to 10-20 s (I/T and I/PBT). Decent stability was observed for I/T devices with a lifetime to half maximum irradiance (t1/2) of 2650 s. I/POT showed exceptional long-term stability at high irradiance, with an initial 30 % decrease (296 to 202 μW/cm2
) during the first 500 s of operation followed by only 20 % diminution over the next 19,500 s, leading to a t1/2 of more than 20,000 s (t1/2 > 5.5 h), and an overall progressive 10 % decrease of the voltage. The initial fast decrease of the irradiance could be due to shifting of the position of the p-n junction.[43] Finally, I/PBT devices showed lower stability than the others with a t1/2 of 90 s. For all devices, it is noteworthy that almost no spectral difference was observed between the emission spectra at maximum irradiance and at half maximum irradiance. The lower stability of I/PBT than the others could be due to over-doping [44] in
I/PBT in the stabilized regime, as this device showed the highest conductivity in impedance
spectroscopy. Such over-doping could lead to doping-induced exciton quenching and side reactions, to reduce the lifetime of the I/PBT device. To minimize over-doping effect from the constant curr ent experiment, current-off (turn off) state could be introduced between the current-on states as in the current on/off switching cycles above. In Figure 4e, current on/off cycles with 3 s intervals give significantly prolonged stability for the I/PBT device.
18
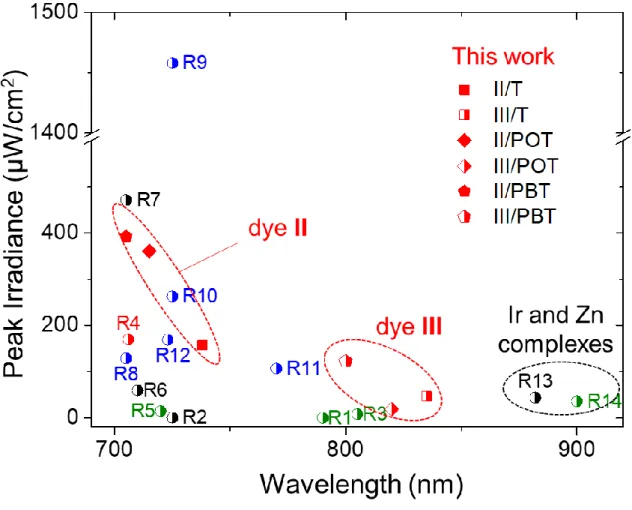
Figure 5 presents the maximum irradiance to emission wavelength comparison of NIR
(>700 nm) dyes used for LEC devices to date (the structures and references of RX are given in Figure S19). To the best of our knowledge, to date, only 3 LECs with emission maxima above 800 nm have been reported: 2 iridium complex-based LECs and one zinc porphyrin-based LEC (Figure S15).[17,45,46] Hence, LECs incorporating dye III are the most red-shifted metal-free LECs to date. Moreover, the maximum irradiance of the LEC incorporating II and
III are in the same range as polymer-based (blue dots), iTMC-based (black dots) or hybrid
(iTMC + organic dye or iTMC + polymer, green dots) LECs. These results are particularly remarkable because fluorescent dyes do not harvest triplet excitons, unlike phosphorescent LECs. These results show that well-optimized small dye-based LECs can compete with state-of-the-art polymer or iTMC LECs. Furthermore, this study sheds light on a design principle for yellow to NIR emitting push-pull dyes for LEC devices, taking advantage of their easy tunability of the emission wavelength from the D-π-A structure. In addition, the CT disctance of push-pull dyes could be a convenient tool to reduce working voltage and Von of LECs. The
host-guest system was necessary to enhance the irradiance of LECs made of push-pull dyes, which could be further enhanced by 1) optimizing dye-host interactions using a dye with a low distortion angle along the π bridge and acceptor, 2) energy tuning between the host and dyes, and 3) maximizing spectral overlap between the host and dyes.
3. Conclusion
Push-pull dyes presented high thermal stability, Φf, simple thin film processiblity, and high tunability in EL wavelength by controlling their structure and host in LECs. In particular, the fluorene-based dyes I-III showed high irradiance comparable to those of state-of-the-art iTMC-based NIR LECs due to their excellent fluorescence properties in solution and in the solid-state. This study sheds light on a design principle for yellow to NIR emitting push-pull
19
dyes for LECs, taking advantage of their easy tunability of the emission wavelength from the D-π-A structure. The dye III showed the most red-shifted metal-free LECs (~ 825 nm) up to date. In addition, the CT disctance of push-pull dyes could be a convenient tool to reduce working voltage and Von of LECs. These results are particularly remarkable because
fluorescent dyes do not harvest triplet excitons. Hence, several important design principles were put forward for high LEC emission from push-pull dyes: increased dye–host interaction via low distortion angle between the π-bridge and acceptor, fine energy tuning between host and dyes, and maximization of the spectral overlap between the host and dyes. Finally, we showed that replacing the electron transport material OXD-7 with BBOT led to an increase in the irradiance, arising from better energy transfer from BBOT to the dyes, as well as lower operating bias originating from the lower redox potential of BBOT.
4. Experimental Section
Materials: PVK (poly(9-vinylcarbazole) and THAB (tetrahexylammonium tetrafluoroborate)
were used as received from Sigma Aldrich. OXD-7 (1,3-bis[2-(4-tert-butylphenyl)−1,3,4-oxadiazo-5-yl]benzene) was purchased from TCI. BBOT (2,5-bis(5-tert-butyl-benzoxazol-2-yl)thiophene) was purchased from Alfa Aesar and used as received. Chlorobenzene and other solvents were HPLC grade [Aldrich, >99% purity]. Poly(3,4-ethylenedioxythiophene):poly(styrene sulfonate) (PEDOT:PSS) and pattered indium-tin-oxide (ITO) glass were purchased from Ossila and Wooyang GMS, respectively.
Fabrication of LECs: For the dye/T approach, solutions of the active layer were prepared by
dissolving dyes I-V at a concentration of 10 mg/mL with THAB in chlorobenzene with a dye/T molar ratio of 4:1. For the single host approach, dyes were dissolved at a concentration of 10 mg/mL in chlorobenzene, and host materials were added with a weight ratio of
20
host/guest/electrolyte = 64.6:29:6.4. For the multi host/guest approach, the solutions were prepared in a similar way, with a weight ratio of host1/host2/guest/electrolyte = 32.3:32.3:29:6.4. For the dye/PBT LECs, chlorobenzene was replaced with DMAC to maintain film quality. Patterned ITO glass substrates were cleaned by a 20 min ultrasonic bath in 500 ml of DI water and 5 ml of Hellmanex™ III, followed by 20 min in DI water and finally 20 min in acetone. The substrates were then dried in an oven at 80 °C for 1 h to remove any solvent residues before undergoing a UV-ozone treatment for 20 min. PEDOT:PSS (35 nm) was spin-coated on the substrates at 4000 rpm for 60 s before baking at 110 °C for 1 h. The substrates were then transferred into a dry N2-filled glovebox. The active layers were then spin-coated at 2000 rpm for 60 s and annealed for 1 h at 70 °C. Finally, a set of four Al (100 nm) electrodes was added on top of the active material by thermal evaporation under high vacuum (5*10–4 Pa) through a shadow mask.
Instruments and characterization: The LECs were driven by a pulsed current mode (235 Hz,
50 % duty cycle) generated by a Keithley 2400 sourcemeter controlled by a MATLAB code. The voltage and radiance of the LEC were measured upon application of a current ramp. Irradiances (from radiances) and EQE were calculated assuming Lambertian emission. TGA was performed on a Q50 analyzer from a TA instrument. DSC was performed on a DSC 200 F from Netzsch. Absorption spectra in solution were measured on a dual beam JASCO 670 spectrometer. Fluorescence spectra in solution and in powder were measured on a Horiba Jobin-Yvon Fluorolog-3® spectrofluorimeter equipped with red-sensitive Hamamatsu R928 or R2658 photomultiplier tubes and reference-corrected for both the excitation source light intensity variation (lamp and grating) and the emission spectral response (detector and grating). The Φf of IV was measured in dilute solution by a comparative method with rubrene as standard references. Absolute quantum yields in powder were measured as described by de
21
Mello et al.[47] and Porrès et al.[48] using an integrating sphere collecting all the emission (2π steradians covered with spectralon®, model F-3018 from Horiba Jobin Yvon). The sphere was calibrated with known standards (Coumarin 153, Rhodamine 6G, DMAMS, Erythrosine B and tetraphenylporphyrin). Absorption and fluorescence spectra of thin films were measured on a Perkin-Elmer lambda 750 spectrophotometer and a Konica Minolta CS-2000 spectroradiometer, respectively (with excitation at 365 nm from a UV lamp). The lifetimes of the dyes in chlorobenzene were in the nanosecond range (Figure S3b). The transient decay of dyes I ~ IV can be fitted with a monoexponential, with lifetimes of 2.5, 2.1, 1 and 0.8 ns, respectively. Dye V was fitted with three exponentials. The intensity-weighted average lifetime for V was calculated to be 2.1 ns with the following formula:
(1)
From the three exponentials, the lifetimes of V were determined to be 0.2 (67 %), 3 (21 %) and 10.9 (12 %) ns, which could possibly be attributed to Z/E photoisomerization in solution. The fastest and major weight (67 %) of 0.2 s is reported in Table 1 and correlated to Figure 4b (green).
The brightness and EL spectra (380-780 nm) of the LEC devices were measured with a Konica Minolta CS-2000 spectroradiometer. Finally, LEC spectra in the 780-940 nm range were obtained with an Avaspec-2048 optical fiber spectrometer corrected in the NIR region by using the fluorescence of 4-dimethylamino-4'-nitrostilbene (4,4'-DMANS).[49] Conversion from radiance to irradiance was done assuming Lambertian emission. The impedance spectroscopy analysis was carried out with a universal potentiostat [model CHI 624B (CH Instruments, Inc.)].). The devices were measured in the frequency range from 200 kHz to 1 Hz and with an amplitude of 10 mV. The data were analyzed using the model circuit presented in Figure S11.
22
Cyclic voltammetry experiments were conducted at a concentration of 1 mM under an argon atmosphere (glove box) in a standard one‐ compartment, three‐ electrode electrochemical cell using a Biologic ESP-300 potentiostat equipped with a 1 A/48 V booster and a linear scan generator. TBAP was used as the supporting electrolyte (0.1 m) in anhydrous dichloromethane. The vitreous carbon (= 3 mm) working electrodes were polished with diamond paste before each recording. A platinum wire counter electrode was used. The Ag+/Ag reference electrode was made of a silver wire immersed in a solution containing a known concentration of Ag+ (AgNO3 (10-2 M) + tetrabutylammonium perchlorate (0.1M) in acetonitrile). The HOMO and LUMO energy level was calculated from the oxidation (reduction) onset as:
(2) (3)
The thickness of the PEDOT:PSS and the active layer were measured by cross-cut SEM using a field emission scanning electron microscope (JEOL, IT-500HR, imaged after 90 s of Pt coating) and a stylus profilometer (Bruker, DektakXT).
Supporting Information
Supporting Information is available from the Wiley Online Library or from the author.
Acknowledgements
M.R. and J.H. contributed equally to this work. This research was supported by a National Research Foundation (NRF) grant funded by Korean government (Ministry of Science, ICT & Future Planning, MSIP) through the Global Research Lab (GRL: 2016K1A1A2912753), Creative Materials Discovery Program (2018M3D1A1058536), and AOARD, Air Force Office of Scientific Research (AFOSR) under the grant number FA9550-19-S-0003.
Author Contributions
E.K. directed the research project and supervised the experimental design. M.R. and J.H. conducted the experimental research and data analysis. C.B., Y.B., M.R. and C.A. synthesized the fluorescent materials. J. K., S.K. and D.K. contributed to the experimental measurements and characterizations. The manuscript was written by M.R., J.H. and E.K.
23
Competing financial interests
The authors declare no competing financial interests.
Data and materials availability
All data is available in the main text or the supplementary materials.
Received: ((will be filled in by the editorial staff)) Revised: ((will be filled in by the editorial staff)) Published online: ((will be filled in by the editorial staff))
References
[1] Q. Pei, G. Yu, C. Zhang, Y. Yang, A. J. Heeger, Science 1995, 269, 1086. [2] F. AlTal, J. Gao, J. Appl. Phys. 2016, 120, 115501.
[3] S. B. Meier, D. Tordera, A. Pertegás, C. Roldán-Carmona, E. Ortí, H. J. Bolink, Mater. Today
2014, 17, 217.
[4] S. Tang, L. Edman, Top Curr Chem (Z) 2016, 374, 40.
[5] R. D. Costa, A. Pertegás, E. Ortí, H. J. Bolink, Chem. Mater. 2010, 22, 1288.
[6] H. L. Filiatrault, G. C. Porteous, R. S. Carmichael, G. J. E. Davidson, T. B. Carmichael, Adv.
Mater. 2012, 24, 2673.
[7] J. Gao, Curr. Opin. Electrochem. 2018, 7, 87.
[8] K. M. Maness, R. H. Terrill, T. J. Meyer, R. W. Murray, R. M. Wightman, J. Am. Chem. Soc.
1996, 118, 10609.
[9] R. D. Costa, E. Ortí, H. J. Bolink, F. Monti, G. Accorsi, N. Armaroli, Angew. Chem. Int. Ed.
2012, 51, 8178.
[10] S. Tang, A. Sandström, P. Lundberg, T. Lanz, C. Larsen, S. van Reenen, M. Kemerink, L. Edman, Nature Communications 2017, 8, 1190.
[11] D. Tordera, S. Meier, M. Lenes, R. D. Costa, E. Ortí, W. Sarfert, H. J. Bolink, Adv. Mater.
2012, 24, 897.
[12] T. Sakanoue, F. Yonekawa, K. Albrecht, K. Yamamoto, T. Takenobu, Chem. Mater. 2017, 29, 6122.
[13] S. Tang, W.-Y. Tan, X.-H. Zhu, L. Edman, Chem. Commun. 2013, 49, 4926.
[14] Z. B. Hill, D. B. Rodovsky, J. M. Leger, G. P. Bartholomew, Chem. Commun. 2008, 0, 6594. [15] A. Pertegás, D. Tordera, J. J. Serrano-Pérez, E. Ortí, H. J. Bolink, J. Am. Chem. Soc. 2013,
135, 18008.
[16] M. D. Weber, J. E. Wittmann, A. Burger, O. B. Malcıoğlu, J. Segarra-Martí, A. Hirsch, P. B. Coto, M. Bockstedte, R. D. Costa, Adv. Funct. Mater. 2016, 26, 6737.
[17] M. Mone, S. Tang, P. Murto, B. A. Abdulahi, C. Larsen, J. Wang, W. Mammo, L. Edman, E. Wang, Chem. Mater. 2019.
[18] P. Lundberg, E. M. Lindh, S. Tang, L. Edman, ACS Appl. Mater. Interfaces 2017, 9, 28810. [19] P. Lundberg, Y. Tsuchiya, E. M. Lindh, S. Tang, C. Adachi, L. Edman, Nat. Commun. 2019,
10, 1.
[20] S. Kanagaraj, A. Puthanveedu, Y. Choe, Adv. Funct. Mater. 2019, 1907126. [21] S. Tang, H. A. Buchholz, L. Edman, J. Mater. Chem. C 2015, 3, 8114. [22] C.-L. Lee, C.-Y. Cheng, H.-C. Su, Org. Electron. 2014, 15, 711.
[23] B. N. Bideh, C. Roldán-Carmona, H. Shahroosvand, M. K. Nazeeruddin, J. Mater. Chem. C
24
[24] H. J. Bolink, L. Cappelli, E. Coronado, P. Gaviña, Inorg. Chem. 2005, 44, 5966. [25] S. Wang, X. Li, S. Xun, X. Wan, Z. Y. Wang, Macromolecules 2006, 39, 7502.
[26] H. J. Bolink, E. Coronado, R. D. Costa, P. Gaviña, E. Ortí, S. Tatay, Inorg. Chem. 2009, 48, 3907.
[27] S. Tang, P. Murto, X. Xu, C. Larsen, E. Wang, L. Edman, Chem. Mater. 2017, 29, 7750. [28] J.-H. Hsu, H.-C. Su, Phys. Chem. Chem. Phys. 2016, 18, 5034.
[29] M. Klikar, P. Solanke, J. Tydlitát, F. Bureš, Chem. Rec. 2016, 16, 1886.
[30] Z. Zheng, F. Caraguel, Y.-Y. Liao, C. Andraud, B. van der Sanden, Y. Bretonnière, RSC Adv.
2016, 6, 94200.
[31] M. Rémond, Z. Zheng, E. Jeanneau, C. Andraud, Y. Bretonnière, S. Redon, J. Org. Chem.
2019, 84, 9965.
[32] A. Zampetti, A. Minotto, F. Cacialli, Adv. Funct. Mater. 2019, 29, 1807623.
[33] S. Redon, G. Eucat, M. Ipuy, E. Jeanneau, I. Gautier-Luneau, A. Ibanez, C. Andraud, Y. Bretonnière, Dyes Pigm. 2018, 156, 116.
[34] E. Lippert, Zeitschrift für Elektrochemie, Berichte der Bunsengesellschaft für physikalische
Chemie 1957, 61, 962.
[35] N. Mataga, Y. Kaifu, M. Koizumi, BCSJ 1956, 29, 465. [36] P. Suppan, Chem. Phys. Lett. 1983, 94, 272.
[37] X. Yan, M. Remond, Z. Zheng, E. Hoibian, C. Soulage, S. Chambert, C. Andraud, B. Van der Sanden, F. Ganachaud, Y. Bretonnière, J. Bernard, ACS Appl. Mater. Interfaces 2018, 10, 25154.
[38] M. Frisch, G. Trucks, H. Schlegel, G. Scuseria, M. Robb, J. Cheeseman, G. Scalmani, V. Barone, B. Mennucci, G. Petersson, H. Nakatsuji, M. Caricato, X. Li, H. Hratchian, A. Izmaylov, J. Bloino, G. Zheng, J. Sonnenberg, M. Hada, M. Ehara, K. Toyota, R. Fukuda, J. Hasegawa, M. Ishida, T. Nakajima, Y. Honda, O. Kitao, H. Nakai, T. Vreven, J. Montgomery, J. Peralta, F. Ogliaro, M. Bearpark, J. Heyd, E. Brothers, K. Kudin, V. Staroverov, R.
Kobayashi, J. Normand, K. Raghavachari, A. Rendell, J. Burant, S. Iyengar, J. Tomasi, M. Cossi, N. Rega, J. Millam, M. Klene, J. Knox, J. Cross, V. Bakken, C. Adamo, J. Jaramillo, R. Gomperts, R. Stratmann, O. Yazyev, A. Austin, R. Cammi, C. Pomelli, J. Ochterski, R.
Martin, K. Morokuma, V. Zakrzewski, G. Voth, P. Salvador, J. Dannenberg, S. Dapprich, A. Daniels, Farkas, J. Foresman, J. Ortiz, J. Cioslowski, D. Fox, Gaussian 09, Gaussian, Inc.,
Wallingford CT 2009.
[39] C. Adachi, T. Tsutsui, S. Saito, Appl. Phys. Lett. 1990, 56, 799. [40] G. Lewińska, A. Puszyński, J. Sanetra, Synth. Met. 2015, 199, 335.
[41] P. Matyba, K. Maturova, M. Kemerink, N. D. Robinson, L. Edman, Nature Mater. 2009, 8, 672.
[42] H. Banda, B. Daffos, S. Périé, Y. Chenavier, L. Dubois, D. Aradilla, S. Pouget, P. Simon, O. Crosnier, P.-L. Taberna, F. Duclairoir, Chem. Mater. 2018, 30, 3040.
[43] R. Sun, C.-T. Liao, H.-C. Su, Org. Electron. 2014, 15, 2885.
[44] N. Kaihovirta, A. Asadpoordarvish, A. Sandström, L. Edman, ACS Photonics 2014, 1, 182. [45] C.-C. Ho, H.-F. Chen, Y.-C. Ho, C.-T. Liao, H.-C. Su, K.-T. Wong, Phys. Chem. Chem. Phys.
2011, 13, 17729.
[46] G.-Y. Chen, B.-R. Chang, T.-A. Shih, C.-H. Lin, C.-L. Lo, Y.-Z. Chen, Y.-X. Liu, Y.-R. Li, J.-T. Guo, C.-W. Lu, Z.-P. Yang, H.-C. Su, Chem. Eur. J. 2019, 25, 5489.
[47] J. C. de Mello, H. F. Wittmann, R. H. Friend, Adv. mater. 1997, 9, 230.
[48] L. Porrès, A. Holland, L.-O. Pålsson, A. P. Monkman, C. Kemp, A. Beeby, J Fluoresc 2006,
16, 267.
26
Figure 1. (a) Structures of dyes I-V. (b) Molar absorption coefficients (dashed) and
normalized fluorescence (solid line) of dyes I (red), II (blue), III (black), IV (orange), and V (green) in CHCl3 (2.5 μM), excited at their absorption maximum. (c) Cyclic voltammograms of dyes I-V (1 mM) in degassed DCM solutions using tetrabutylammonium perchlorate as the electrolyte (0.1 M), glassy carbon as the working electrode, platinum as the counter electrode, Ag/Ag+ as the reference electrode and a scan rate of 100 mV/s.
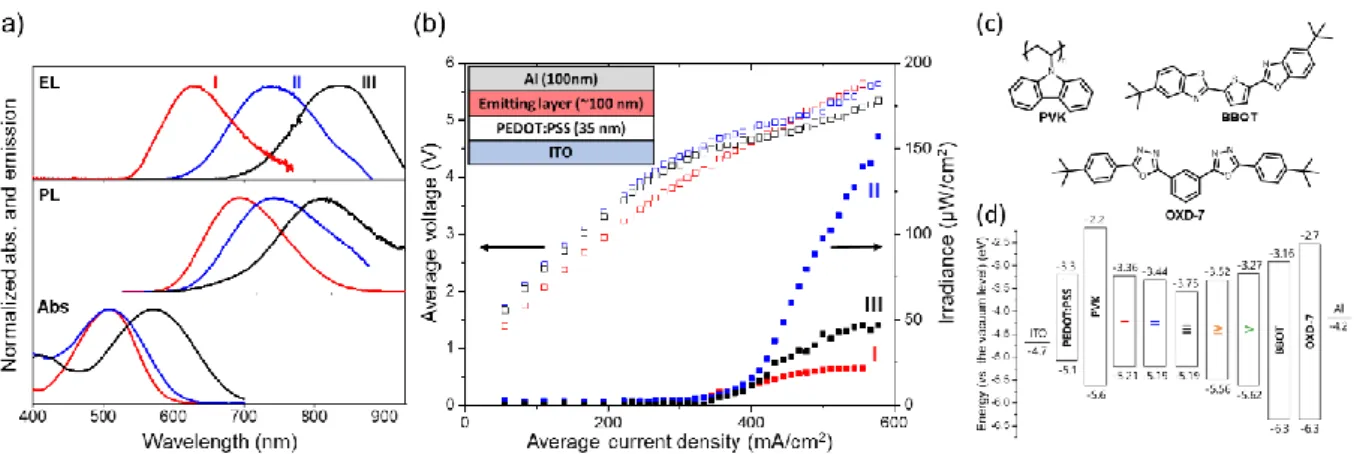
Figure 2. (a) EL spectra (top) of the LEC device with dyes I (red), II (blue), and III (black)
in THAB (4:1 mol. ratio) compared to their photoluminescence spectra (middle) and absorption (bottom) in chloroform solution (2.5 mM). The EL spectra were acquired with a spectroradiometer (below 780 nm) and then with a corrected optical fiber spectrometer. (b) The voltage (empty square) and irradiance (filled) variations under increasing applied average current density for dyes I (blue), II (red), and III (black) in THAB. Inset : Schematic diagram of the LEC structure. (c) The chemical structure of the hosts. (d) Schematic energy level diagram of the dyes and host.
27
Figure 3. (a) EL spectra of the I/T (dotted black), I/PT (blue), I/OT (cyan), I/BT (magenta), I/PBT (red) and I/POT (green) devices at their maximum EL intensity. (b) The voltage
(empty square) and irradiance (dots) variations with the applied average current density of the devices of dye I in different medium (top), of dyes/PBT devices (middle) and of the dyes/POT devices (bottom). (c) Normalized EL emission spectra of the dye/PBT devices (top) and of the dye/POT devices (middle) compared to the normalized dye absorption spectra in chloroform and host/T film PL emission spectra (bottom, gray area: POT film and purple area: PBT film) for dye I (red), II (blue), III (black), IV (orange), and V (green). The EL spectra were acquired with a spectroradiometer (before 780 nm) and then with a corrected optical fiber spectrometer. (d) Schematic diagram illustrating the working mechanism of the LECs taking into account the ionic size difference (blue circles: THA+, red circles: BF4-, black circles: holes (+) and electrons (-), red lightning bolt: light emission).
28
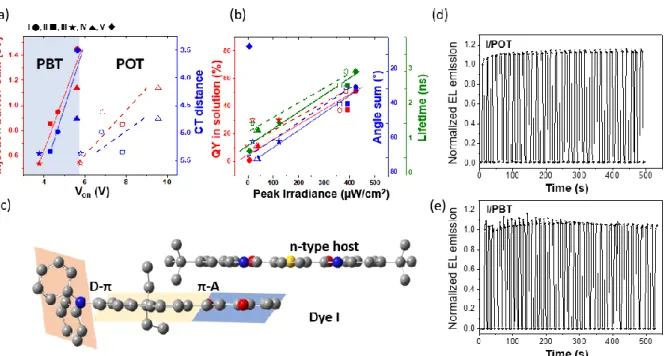
Figure 4. (a) Correlation between the device turn-on voltage (Von) and the injection barrier sum (red) and CT distance (blue) for dye I (circle), II (square), III (star), IV (triangle) and V (diamond) in the /PBT (filled shaped) and /POT (open shapes) devices. (b) Correlation of the peak irradiance with the QY yield in solution (red) lifetime in solution (green) and the angle sum (blue, AD + AA) for dye I (circle), II (square), III (star), IV (triangle) and V (diamond) in the /PBT (filled shaped) and /POT (open shapes) devices. (c) Optimized structures of I and BBOT showing the small AA and possible dye-host interactions on the acceptor side. (d) Stability of the I/POT devices upon 34 cycles of turn-on (~3 s) and turn-off (~3 s) driven by an average pulsed current of 11 mA/cm2. (e) Stability of the I/PBT devices upon 41 cycles of turn-on (~3 s) and turn-off (~3 s) driven by an average pulsed current of 222 mA/cm2.
29
Figure 5. Comparison of the maximum irradiance of NIR LECs presented herein (square,
diamond, pentagon forms) and published previously (half-filled circles; the structures and references of R1-R14 are given in Figure S19). The color of the symbols corresponds to the emitter's category: black for metal complex emitter (Ir, Ru, Zn), green for metal complex with organic dye or polymer hybrid, red for organic dye, and blue for organic polymer. When needed, conversion from radiance to irradiance was done assuming Lambertian emission.
Table 1. Optical and electrochemical properties of the dyes in solution and crystalline powder
Dye λabsa [nm] λPLb) [nm] Φfc) [%] τd) [ns] λPLe) [nm] Φff) [%] CTg) [Å]
Dye/PBT (Dye/POT) LECs λPLn) [nm] λELo) [nm] Irr p) [µW/cm2] I 508j) 674j) 51j) 2.5 655 22 4.98 650 (660) 635 (660) 425 (386) II 509k) 718l) 37k) 2.1 710 28 5.34 725 (730) 705 (715) 393 (364) III 570k) 788k) 30k) 1 800 9 5.37 > 780(> 780) 800 (825) 123 (19) IV 425 625 11l) 0.8 640 45 4.74 615 (620) 601 (633) 41 (35) V 440m) 530m) <1m) 0.2 600 33 3.51 570 (-q)) 550 (-q)) 0.63 (-q)) a)
Maximum absorption wavelength, b)maximum fluorescence wavelength, and c)fluorescence quantum yield of dyes in CHCl3 solution. d)Lifetime in chlorobenzene solution. e)Maximum fluorescence emission and f)fluorescence quantum yield in solid-state (crystalline powder) measured with calibrated integrated sphere. g)Calculated CT distances. h)HOMO (EHOMO,CV), LUMO (ELUMO,CV) energy, and bandgap (Eg,CV) determined from CV (Figure 1c). i)Optical bandgap measured from the onset of the absorption spectra in chloroform. j)From ref[30], k)
From ref[31]. l)Measured using rubrene as reference (Φf = 27 % in MeOH). m)From ref[33]. n)
30
electroluminescence wavelength of dyes in PBT (POT) devices. p)Peak irradiance of electroluminescence for dyes in PBT (POT) devices. q)No emission was detected.
31
Push-pull NIR dyes are used as emitters in light-emitting electrochemical cells. Control
of the host energy levels and interactions with the dyes enables strong NIR emission, up to 835 nm, with peak irradiances comparable with polymer or transition metal complex light-emitting cells.
Keyword
organic light-emitting electrochemical cells, fluorescent materials, near-infrared, host/guest
Push-Pull Dyes for Yellow to NIR Emitting Electrochemical Cells
M. Rémond+, J. Hwang+, S. Kim, C. Bucher, Y. Bretonnière, C. Andraud, D. Kim, and E. Kim*