HAL Id: tel-01230595
https://tel.archives-ouvertes.fr/tel-01230595
Submitted on 18 Nov 2015HAL is a multi-disciplinary open access archive for the deposit and dissemination of sci-entific research documents, whether they are pub-lished or not. The documents may come from teaching and research institutions in France or abroad, or from public or private research centers.
L’archive ouverte pluridisciplinaire HAL, est destinée au dépôt et à la diffusion de documents scientifiques de niveau recherche, publiés ou non, émanant des établissements d’enseignement et de recherche français ou étrangers, des laboratoires publics ou privés.
Modélisation du comportement mécanique de la neige à
partir d’images microtomographiques
Pascal Hagenmuller
To cite this version:
Pascal Hagenmuller. Modélisation du comportement mécanique de la neige à partir d’images microto-mographiques. Mécanique des matériaux [physics.class-ph]. Université de Grenoble, 2014. Français. �NNT : 2014GRENU042�. �tel-01230595�
Pour obtenir le grade de
DOCTEUR DE L’UNIVERSITÉ DE GRENOBLE
Spécialité : Sciences de la Terre et Univers, EnvironnementArrêté ministériel : 7 aout 2006
Présentée par
Pascal HAGENMULLER
Thèse dirigée parMohamed NAAIM et co-encadrée parGuillaume CHAMBONpréparée àIrstea Grenoble & CNRM-GAME/CEN dans l’Ecole DoctoraleTerre, Univers, Environnement
Modélisation
du
comportement
mécanique de la neige à partir
d’images microtomographiques
Thèse soutenue publiquement le17/12/2014, devant le jury composé de :
M. Martin SCHNEEBELI
Directeur de recherche, WSL-SLF, Président M. Edward ADAMS
Professeur, Montana State University, Rapporteur M. Farhang RADJAÏ
Directeur de recherche, Université de Montpellier, Rapporteur M. Henning LÖWE
Chargé de recherche, WSL-SLF, Examinateur M. Samuel MORIN
Chargé de recherche IPEF, CEN, CNRM-GAME, Examinateur M. Mohamed NAAIM
Directeur de recherche, IRSTEA, Directeur de thèse M. Guillaume CHAMBON
Chargé de recherche, IRSTEA, Co-encadrant de thèse M. Frédéric FLIN
i
Résumé
Caractériser les propriétés mécaniques de la neige est un défi majeur pour la prévi-sion et la prédétermination du risque d’avalanche. Du fait du grand nombre de types de neige et de la difficulté à effectuer des mesures sur ce matériau très fragile, la compréhension de la relation entre la microstructure de la neige et ses propriétés mé-caniques est encore incomplète. Cette thèse aborde ce problème par le biais d’une ap-proche de modélisation mécanique basée sur la microstructure tridimensionnelle de neige obtenue par microtomographie aux rayons X. Tout d’abord, afin d’automatiser et améliorer la segmentation des images microtomographiques, un nouvel algorithme tirant profit de la minimisation de l’énergie de surface de la neige a été développé et évalué. L’image air-glace est ensuite utilisée comme entrée géométrique d’un mod-èle éléments finis où la glace est supposée élastique fragile. Ce modmod-èle permet de reproduire le comportement fragile en traction et révèle le comportement pseudo-plastique apparent causé par l’endommagement microscopique, ainsi que la forte hétérogénéité des contraintes dans la matrice de glace. Pour reproduire les grandes déformations impliquant le ré-arrangement de grains, un modèle par éléments dis-crets a ensuite été développé. Les grains sont identifiés dans la microstructure en utilisant des critères géométriques dont la pertinence mécanique a été démontrée, et décrits dans le modèle par des blocs rigides de sphères. Le comportement simulé en compression est dominé par le rôle de la densité mais révèle également des dif-férences liées au type de neige. Enfin, pour distinguer le degré de cohésion entre les types de neige, un indicateur microstructurel a été développé et s’est avéré être fortement corrélé aux propriétés mécaniques et physiques du matériau.
Abstract
Characterizing the complex microstructure of snow and its mechanics is a major challenge for avalanche forecasting and hazard mapping. While the effect of envi-ronmental conditions on the snow metamorphism, which leads to numerous snow types, is fairly known, the relation between snow microstructure and mechanical properties is poorly understood because of the very fragile nature of snow. In order to decipher this relation for dry snow, this thesis presents a modeling approach of snow mechanics based on the three-dimensional microstructure of snow captured by X-ray microtomography and the properties of ice. First, in order to automatically process the microtomographic data, we take advantage of the minimization of the snow surface energy through metamorphism to efficiently binary segment grayscale images. Second, assuming an elastic brittle behavior of the ice matrix, the tensile strength of snow is modeled via a finite element approach. The model reveals an apparent pseudo-plastic behavior caused by damage, and the highly heterogenous stress distribution in the ice matrix. Third, we develop a discrete element model, accounting for grain-rearrangements and the creation/failure of inter-granular con-tacts. The grains, geometric input of the model, are detected in the microstructure with mechanically-relevant criteria and described as rigid clumps of spheres. The model evidences that the compression behavior of snow is mainly controlled by den-sity but that the first stage of deformation is also sensible to the snow type. Last, the inter-granular bonds, recognized to be critical for the mechanical properties, are characterized through a new microstructural indicator, which effectively highly correlates with the simulated mechanical and physical properties.
iii
Remerciements
Le manuscrit est terminé, la thèse est soutenue mais le plus important reste à faire: remercier les personnes avec qui j’ai travaillé et échangé.
Tout d’abord je souhaite remercier mes encadrants de thèse. Merci Guillaume d’avoir toujours gardé ta porte ouverte et d’avoir compris instantanément mes ques-tions scientifiques. Je pense que tu m’as guidé dans une bonne direction pour la thèse et la suite avec une réflexion profonde, précise et honnête. Merci Mohamed pour les discussions scientifiques mais aussi et surtout de tes conseils pour tout ce qui tourne autour de la science: la vie quotidienne, les gens et leur personnalité, les ficelles du corps des IPEF. Merci à “Microstructure” du CEN et surtout à Fred et Bernard. Ils ne sont pas sur la liste officielle des encadrants mais sans eux ma connaissance de la neige serait bien moins moindre. J’espère avoir la chance de continuer à travailler avec vous tous. Pour l’instant, c’est bien parti !
Je tiens également à remercier les membres de mon jury. Merci Martin pour la présidence de ce jury et une gestion parfaite du timing (une question pas facile de Farhang en moins!). C’est avec Martin et Thiemo Theile que j’ai découvert la microstructure de la neige en Master 2 à Davos. Merci Farhang et Edward pour votre lecture détaillée de mon manuscrit, votre intérêt pour mon travail et la pertinence de vos commentaires en mécanique. Merci également Edward pour avoir fait le déplacement depuis le Montana. Merci Henning pour avoir évalué ma soutenance et reviewé en profondeur bon nombre de mes articles. Merci Samuel pour tes retours toujours très efficaces et pour avoir soutenu, avec succès, ma candidature au CEN.
Merci à mes collègues de bureau. Merci Nejib pour ton humour décapant et les Bobines mémorables. Johan, j’espère qu’on sera bientôt collègues au CEN, on ferait une team d’enfer. Zhu, bon courage pour la suite. Gaetan (vu le temps que tu as passé dans mon bureau, je te compte parmi les collègues de bureau), merci pour les discussions enflammées avec Raphael sur les conditions de ski, la taille au patin et l’effet "mamie" pour relacher la pression. Faut que vous passiez dans mon bureau admirer la décoration chartrousine.
Mes remerciements vont également à l’équipe ETNA pour une ambiance de travail productive et dans la bonne humeur. Merci Evgeny pour nos discussions sur le matériau de neige dans un monde irstéen d’écoulement et de zonage. Merci aux doctorants avec qui j’ai partagé galères et bières. Merci Fred O. pour tes bons mots et nos échanges sur nos chevilles d’acier. Merci Manu, Hervé, Xavier pour me rappeler qu’après les modèles, il y a une réalité sur le terrain. Merci Christian pour ton humour et les conseils sur les vélos. Merci à Martine pour une gestion vraiment efficace des missions. Merci à Gwenola pour une gestion pas facile des travaux. Au passage, je ne remercie pas le concours de circonstance qui fait que j’ai pu profité, de A à Z, du marteau-piqueur et que j’observe un bâtiment tout neuf de ma fenêtre au CEN, sans y avoir jamais mis les pieds.
Merci à mes amis et à ma famille qui sont venus de loin pour assister à ce moment important et qui ont un peu fait de moi ce que je suis aujourd’hui (et qui m’ont bien aidé pour le pot). Trois docteurs pour débroussailler à la Chabreuye, papa serait
fier de nous, autant pour le diplôme que pour les choses simples. Mériem, merci pour ce qui est le plus important.
Contents
Résumé . . . i Abstract . . . ii Remerciements . . . iii 1 Introduction 5 1.1 Context . . . 5 1.1.1 Avalanche danger . . . 5 1.1.2 Avalanche formation . . . 8 1.1.3 Snow materials . . . 10 1.1.4 Snow mechanics . . . 131.1.5 General objective of the thesis. . . 16
1.2 Present state of snow mechanics. . . 17
1.2.1 Operational avalanche forecasting . . . 17
1.2.2 Research. . . 24
1.2.3 Scientific questions and approach . . . 33
1.3 Structure of the thesis . . . 35
1.A Appendix . . . 39
1.A.1 Description of the calculation of the shear strength τmax in MEPRA . . . 39
2 Energy-based binary segmentation of snow microtomographic images 41 2.1 Introduction . . . 42
2.2 X-rayµCT images . . . 44
2.2.1 Sampling andµCT measurement procedure . . . 44
2.2.2 Images artefacts: noise and fuzzy transition between materials 46 2.3 Method . . . 47
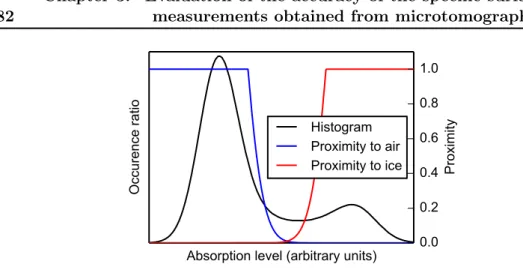
2.3.1 Threshold-based segmentation. . . 48
2.3.2 Energy-based segmentation . . . 50
2.4 Results. . . 54
2.4.1 Segmentation of a reference 2D image . . . 54
2.4.2 Segmentation of snow 3D images . . . 58
2.5 Conclusion and discussion . . . 64
2.A Appendix . . . 67
2.A.1 Link between graphs and binary energy . . . 67
2.A.2 Measurement of binary object surface area with graphs. . . . 67
2.A.3 Minimization algorithm . . . 68
3 Evaluation of the accuracy of the specific surface area measurements obtained from microtomographic data 71 3.1 Introduction . . . 72
3.2.1 Data set . . . 74
3.2.2 Segmentation methods . . . 76
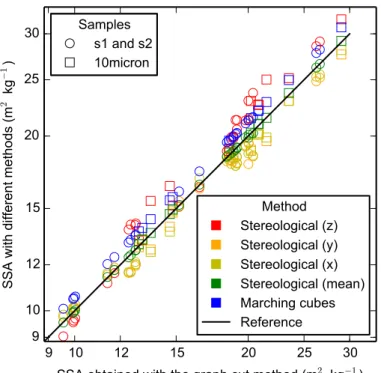
3.2.3 Surface area computation . . . 82
3.3 Results. . . 83
3.3.1 Surface area estimation . . . 83
3.3.2 Sequential filtering . . . 85
3.3.3 Energy-based approach . . . 90
3.3.4 Comparison between images and methods . . . 93
3.4 Conclusion. . . 94
4 Numerical simulation of microstructural damage and tensile strength of snow 97 4.1 Introduction . . . 98
4.2 Data and methods . . . 98
4.2.1 Snow and sample preparation . . . 98
4.2.2 Experimental methods . . . 99
4.2.3 Numerical simulation. . . 100
4.3 Results. . . 100
4.3.1 Microscopic aspects of snow failure . . . 100
4.3.2 Macroscopic aspects . . . 101 4.4 Discussion . . . 102 4.4.1 Microscopic features . . . 102 4.4.2 Macroscopic features . . . 103 4.5 Conclusion. . . 104 4.A Appendix . . . 105
5 Snow as a granular material: assessment of a new grain segmentation algorithm 109 5.1 Introduction . . . 110
5.2 Materials and methods . . . 112
5.2.1 Dataset . . . 112
5.2.2 Geometrical segmentation algorithm . . . 112
5.2.3 Mechanical model . . . 116
5.3 Results. . . 116
5.3.1 Sensitivity of the geometrical grain segmentation to its pa-rameters . . . 116
5.3.2 Mechanical evaluation . . . 117
5.4 Discussion and application to various snow types . . . 121
5.4.1 Non-uniqueness of the segmentation . . . 121
5.4.2 Representativeness of the mechanical evaluation . . . 122
5.4.3 Application to different types of snow microstructures . . . . 126
Contents 3
6 Microstructure-based modeling of snow mechanics: a discrete element
approach 131
6.1 Introduction . . . 132
6.2 Materials and methods . . . 134
6.2.1 Dataset . . . 134
6.2.2 Snow microstructure representation . . . 134
6.2.3 Discrete element model . . . 136
6.2.4 Boundary conditions . . . 140
6.3 Results. . . 141
6.3.1 First results . . . 141
6.3.2 Sensitivity of the model to its parameters and modeling as-sumptions . . . 146
6.3.3 Application of the model to different snow microstructures . . 153
6.4 Conclusion. . . 155
7 Characterization of the snow microstructural bonding system through the minimum cut density 159 7.1 Introduction . . . 160
7.2 Snow images . . . 164
7.3 Methods . . . 165
7.3.1 Minimum cut density. . . 165
7.3.2 Thermal and elastic properties . . . 167
7.4 Results. . . 169
7.4.1 Minimum cut density. . . 169
7.4.2 Thermal conduction and elasticity . . . 173
7.4.3 Correlation with minimum cut density . . . 173
7.5 Discussion and conclusion . . . 173
7.5.1 Low connectivity of the ice matrix . . . 173
7.5.2 The minimum cut density as a microstructural indicator . . . 177
7.A Appendix . . . 179
7.A.1 Evolution of the minimum cut density with metamorphism . 179 7.A.2 Specific grain contact area . . . 181
7.A.3 Computation on limited volume sizes . . . 182
8 Conclusion and perspectives 185 8.1 Conclusion. . . 185
8.1.1 New modeling tools for snow mechanics . . . 185
8.1.2 An insight into the brittle behavior of snow . . . 187
8.2 Perspectives . . . 189
8.2.1 Microtomography of snow . . . 190
8.2.2 Snow mechanics . . . 191
Chapter 1
Introduction
Contents 1.1 Context . . . 5 1.1.1 Avalanche danger . . . 5 1.1.2 Avalanche formation . . . 8 1.1.3 Snow materials . . . 10 1.1.4 Snow mechanics . . . 131.1.5 General objective of the thesis . . . 16
1.2 Present state of snow mechanics . . . 17
1.2.1 Operational avalanche forecasting. . . 17
1.2.2 Research. . . 24
1.2.3 Scientific questions and approach . . . 33
1.3 Structure of the thesis . . . 35
1.A Appendix . . . 39
1.A.1 Description of the calculation of the shear strength τmax in MEPRA . . . 39
1.1
Context
1.1.1 Avalanche danger
An avalanche is a rapid gravity-driven flow of a significant snow mass on a moun-tainous slope. Every year, snow avalanches kill about one hundred people in the Alps and cause important material damage on human infrastructures.
Historical perspective. No attention would be paid to avalanches if nobody lived in the mountains. The first accidents are reported by military troops crossing the Alps to invade new territories behind this natural rampart. For instance, around 218 before Christ, Hannibal climbed into the Alps to attack Rome [Jenkins,2000]. His troops had to face avalanches when they crossed high-altitude paths, as re-ported: "There where the path is intercepted by glistening slope, Hannibal pierces the resistant ice with his lance. Detached snow drags the men into the abyss and snow falling rapidly from the high summits engulfs the living squadrons" (Silius Italicus, [Jenkins,2000]). As people settled in the remotest valleys of the European Alps in search of new living space (ex. Walser, Alemanni between the 12th and
Figure 1.1: Artist’s view of avalanches in the 18th century (from “Neue und voll-staendige Topographie der Eydgnosschaft”, David Herrliberger, 1754-1758).
14thcentury), death tolls began to rise. Avalanches were source of fear and thought as a fatality (Figure 1.1). However, progressively, people learned to live in secure places by continuously rebuilding the destroyed houses. In medieval times, people recognized that clearing of forest could significantly increase the avalanche danger. In consequence, for example in France, the administration (“Eaux et Forêts”) set regulations of forest clearing in exposed areas (e.g. Barèges, Pyrénées in 1860) and, in 1899, started the "carnet d’avalanches" where avalanche events were systemati-cally reported [de Crécy,1965]. In Switzerland, which is proportionally much more exposed to avalanches than France, first experiments [e.g. Bader and Niggli, 1939] are conducted on snow in the 1930’s and a laboratory (SLF) specifically dedicated to the study of snow is created in 1942. With the development of ski tourism and hydroelectricity, more knowledge on snow and avalanche is required and in the 1950’s, experiments on snow are started at Col de Porte, Chartreuse, French Alps. In February 1970, the dramatic accidents of Val d’Isère1 and Passy2, stirred public opinion and highlighted the lack of the French avalanche risk management [Ancey,
1998]. Six months later, Saunier’s commission proposed the creation of a national association for the study of snow and avalanches (ANENA), the establishment of the nivology division in the CERAFER (now Irstea) and the development of the activities of center for snow study (CEN, Météo-France) [Saunier,1970].
Current costs of avalanches. Numerous defense structures have been built and successfully prevented from countless infrastructure damage. However, the catas-trophic avalanche cycle of winter 1998-1999 in the European Alps3 recalled that
1
The 10th February 1970, 39 young people were killed by an avalanche in their chalet in Val d’Isère, France
2The 5thApril 1970, a mudslide killed 77 people in a sanatorium in Passy, France 3
1.1. Context 7
1981-1982
1985-1986
1990-1991
1995-1996
2000-2001
2005-2006
2010-201
1
2012-2013
Winter season
0
5
10
15
20
25
30
35
40
45
Number of fatalities
Ski touring
Off-pist skiing
Figure 1.2: Avalanche fatalities of backcountry skiers in France during the period 1981-2013. Note that the fatalities in other outdoor sports, such as ice climbing or mountaineering, and due to avalanche are not taken into account in this figure. Data from http://www.anena.org.
avalanches are still threatening people and infrastructure in the Alps [Glass et al.,
2000]. Besides death toll and infrastructure damage, the economy of mountainous area is deeply impacted by the avalanche hazard: non-constructible land, evacuation of people at risk4, closing of highly frequented roads5, etc. Nowadays avalanches are also threatening an increasing number of recreationists. An average of 30 fatalities per year in France are attributed to avalanches during outdoor hobbies including backcountry skiing (Figure1.2).
Risk management. Two approaches of avalanche risk management can be dis-tinguished: short-term forecast and long-term prevention (hazard mapping).
• Short-term forecast: Météo-France provides, on a daily basis during the winter season, an avalanche bulletin on a regional scale (Figure1.3a). This bulletin consists in an estimation of the avalanche activity (frequency of release and size of the avalanche) and the stability of the snowpack. The avalanche danger is given on a international scale between 1 (low) and 5 (very high) and de-tails on the avalanche type and on the most favorable conditions for a release are described. It is mainly intended for ski patrols, backcountry skiers but it also serves as warning system for local authorities in charge of infrastructure safety. The avalanche forecaster builds the bulletin with snowpack measure-ments, its own expertise and the results of a forecasting model (SAFRAN-CROCUS-MEPRA) which computes a stability index as a function of the past and modeled weather conditions [Durand et al.,1999]. The model helps
4
e.g. in February 2012, 600 people were evacuated from Barèges, France because of high avalanche risk.
5e.g. the Mont-Blanc tunnel between France and Italy was closed the 31th December 2011 because of high avalanche risk
the forecaster in pointing out the range of elevations and aspects at which the snowpack undergoes processes affecting its stability [Durand et al.,1999]. However, the predictability of the avalanche danger is limited and relies on how the avalanche forecaster heuristically weights the influence of the diverse contributory factors as terrain, meteorological conditions, observations of the snowpack etc.
• Long-term prevention: Hazard mapping informs about the spatial extent of the risk and is used to regulate urbanism. This type of hazard map exists for industrial (explosion, leaking of chemical, etc.) and natural hazards (flood-ing, wildfire, avalanche, etc.). In France, the avalanche hazard map (PPRA) distinguishes four main zones (Figure 1.3b): (1) the red zone where all con-structions are forbidden, (2) the dark blue zone where new concon-structions are forbidden but existing ones are allowed and should be protected, (3) the light blue zone where new constructions are allowed but under conditions that they support a certain mechanical load and (4) a green zone where the forest should be maintained because it has a protective role. This mapping results from a compromise between considering the maximum avalanche extent/intensity and the commitment of economical development in remote alpine valleys. The es-timation of the intensity and the frequency of an avalanche for a given path is primarily based on historical data, as direct observations of avalanche de-position or indirect observations on the damage tracks left by the avalanche [de Crécy,1980]. However, this kind of data is not available everywhere and on sufficiently long period to be representative of rare but very intense avalanche events. Therefore statistical models must be coupled with physically-based models to overcome the limitations of missing historical data [Gaume,2013]. Risk management for long-term prevention still requires better understanding of the physics of the phenomenon even though it was already improved since the description of an avalanche as a "snow ball" (painting of Figure 1.1). Even if, at present, the occurrence of a single avalanche event cannot be predicted in time and space, avalanches are not random events but result from a complex interaction of contributory factors. The release process can be studied and modeled to go toward better hazard mapping and short-term forecasting [Schweizer et al.,
2003].
1.1.2 Avalanche formation
Understanding the processes at the origin of an avalanche release is critical for short-term forecasting but also for long-short-term prevention which requires the knowledge of snow rheological properties and the size of the released volume of snow. Snow avalanches result from the interplay between three elements: (1) snow properties (controlled by the weather conditions, vegetation, etc.), (2) topography (slope/gravity) and (3) a triggering element (physical: change in snow properties as temperature increase; mechanical: new falling snow, skier, explosive, earthquake) [Goetz,2010].
1.1. Context 9 MONT-BLANC 3 4!5 N S E O
Départs spontanés : fréquents, !. et gros notamment en altitude.
Déclenchement skieurs : nombreuses
plaques et accumulations de neige soufflée.
1800 m
(a) Example of short-term avalanche forecasting for the Mont-Blanc massif, France. Adapted from www.meteofrance.com.
N E
Floria Floria FloriaFloriaFloriaFloriaFloriaFloriaFloria
Moulin des Praz Moulin des Praz Moulin des Praz Moulin des Praz Moulin des Praz Moulin des Praz Moulin des Praz Moulin des Praz
Moulin des Praz
Le Vorgeat Le Vorgeat Le Vorgeat Le Vorgeat Le VorgeatLe VorgeatLe VorgeatLe Vorgeat
Le Vorgeat 58X 58X 58X 58X 58X 58X 58X 58X 58X 59X 59X 59X 59X 59X 59X 59X 59X 59X 54X 54X
54X54X54X54X54X54X54X 56AB56AB56AB56AB56AB56AB56AB56AB56AB
56 56 56 56 56565656 56bisbisbisbisbisbisbisbisbisA'A'A'A'A'A'A'A'A'
55X 55X 55X 55X 55X 55X 55X 55X 55X 57V 57V 57V57V57V57V57V57V57V 60V 60V 60V 60V 60V60V60V60V 60V !"/#0%&//"/ !"/#0%&//"/ !"/#0%&//"/ !"/#0%&//"/ !"/#0%&//"/!"/#0%&//"/!"/#0%&//"/!"/#0%&//"/ !"/#0%&//"/ !"/#$%&'$"11"/ !"/#$%&'$"11"/ !"/#$%&'$"11"/!"/#$%&'$"11"/!"/#$%&'$"11"/!"/#$%&'$"11"/!"/#$%&'$"11"/!"/#$%&'$"11"/!"/#$%&'$"11"/
!"/#2-34!!"/ !"/#2-34!!"/ !"/#2-34!!"/!"/#2-34!!"/!"/#2-34!!"/!"/#2-34!!"/!"/#2-34!!"/!"/#2-34!!"/!"/#2-34!!"/ !"/#5-%$"&1/ !"/#5-%$"&1/ !"/#5-%$"&1/ !"/#5-%$"&1/ !"/#5-%$"&1/!"/#5-%$"&1/!"/#5-%$"&1/!"/#5-%$"&1/ !"/#5-%$"&1/ !"/#4!"11"/ !"/#4!"11"/ !"/#4!"11"/ !"/#4!"11"/ !"/#4!"11"/ !"/#4!"11"/ !"/#4!"11"/ !"/#4!"11"/ !"/#4!"11"/ Forêts à fonctions de protection Construction interdite Entretien et protection de l’existant Urbanisable sous conditions
}
(b) Example of avalanche hazard mapping for urbanism (in french “Plan de Pre-vention du Risque Avalanche”, PPRA). Adapted for readability purpose from PPRA of Chamonix.
Figure 1.3: Avalanche risk management: short-term forecast (a) and long-term prevention (b).
Two types of release are usually distinguished: loose snow avalanches and slab avalanches [Schweizer et al.,2003].
• Loose snow avalanches start at a single point at the snow surface. While the
snow mass with low cohesion moves down the slope, the avalanche progres-sively spreads in a triangular shape and gains volume by eroding the snow surface. Their release can occur during a snowfall of very light and cold fresh snow or during a temperature increase which decreases the friction angle be-tween snow grains or increases the water content. They can be artificially released by backcountry skiers but accidents can be avoided since the skier who triggered the avalanche is generally upstream the avalanche flow.
• Slab avalanches are the most dangerous because they involve much larger
snow volumes. Moreover, Schweizer and Lütschg[2000] showed that fatalities of recreationists due to avalanches are nearly exclusively (99%) caused by slab avalanches. The snowpack is layered vertically. Each layer has its own prop-erties determined by its history (snow fall, temperature, wind, etc.). When two successive layers are badly connected or because the thin layer in between is very weak (the weak layer), the upper layer(s) (the slab) can slide entirely on the lower layer (the basal layer) which creates a slab avalanche (Figure 1.4a). In details, the release of a slab avalanche involves two different failure processes (Figure 1.4b). First, the weak layer fails in shear and compression along a crack parallel to the slope (the basal crack). Then, the loss of shear cohesion between the slab and the basal layer creates tension in the slab which fails along a crown crack. Note that the basal crack can spread up and down the slope; the crown crack can thus be upslope of the triggering factor, as a skier. This explains why slab avalanches are more dangerous for skier than
30◦ bed surface (release area) deposition area crown flank stauchwall
(a) Slab avalanche nomenclature. The nomenclature is as de-scribed by Perla [1977]. The background avalanche image is taken from [Sigrist,2006].
gravity layered snowpack air ground TENSION COMPRESSION SHEAR old settled snow wind packed snow weak layer recent snow crown crack basal crack slope angle
(b) Example of a slab configuration in the release area.
Figure 1.4: Slab avalanche release.
loose snow avalanches since the skier can be anywhere on the released slab.
1.1.3 Snow materials
Much about the avalanche release processes remains unknown because of the com-plexity and the variability of the snowpack [Schweizer et al.,2003]. To better un-derstand the release mechanisms, there is clear need for comprehensive constitutive modeling of snow, which is currently missing [Shapiro et al.,1997]. One reason for this missing link in the avalanche knowledge might be the lack of industrial funding for research on snow mechanics. Indeed, compared to typical construction materials, snow is less valuable for commercial activities. Another reason is the existence of not only one snow material, but numerous snow materials characterized by a wide range of microstructural patterns. Besides, snow is a very fragile material, which makes experiments difficult to conduct.
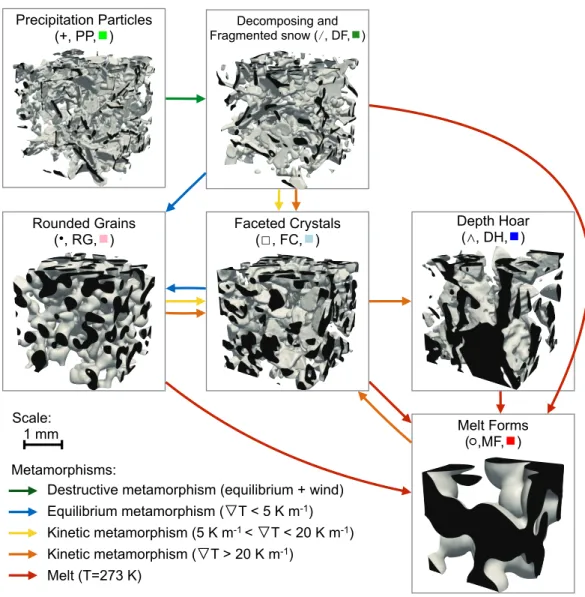
Snow on the ground consists of snow crystals, which formed in the atmosphere by water vapor deposition on freezing nuclei. Atmospheric temperature and water supersaturation control the morphology of these snowflakes, which can thus have variable shapes and sizes (stellar dendrite, plate, column, etc.). Once on the ground, the snowflakes evolve rapidly with time (within hours and days), depending on envi-ronmental conditions like temperature, temperature gradient and forces applied to the snowpack. This process is called metamorphism. The different initial snowflake shapes and the various environmental conditions on the ground yield a wide range of microstructural patterns, variable in time and space. These different patterns are classified in snow types according to an international classification [Fierz et al.,
2009]. Symbols and codes of the main snow types are shown in Figure 1.5. Snow metamorphism on the ground can be explained by three main processes:
1.1. Context 11
• Vapor transport: Snow exists on the ground at homologous temperature above 0.9, i.e. its temperature is generally higher than 90% of its melting point using the Kelvin scale. Its density ranges roughly between 20 kg m−3 and 500 kg m−3. The high homologous temperature and porosity promote intense water vapor exchanges (ice sublimation, vapor transport, vapor deposition) between ice zones, which modify the shape and the bounding of the ice ma-trix. The metamorphism primarily due to vapor exchanges is active on dry snow and is of two different types: equilibrium and kinetic. Equilibrium meta-morphism occurs when there is almost no heat flux in the snowpack, i.e. when the temperature gradient ∇T is low (∇T ≤ 5 K m−1). It rounds the snow grains and thickens the ice matrix by promoting vapor transport from convex zones to concave zones [e.g. Flin et al.,2004,Vetter et al.,2010] (Figure1.5). Therefore, it tends to stabilize the snowpack. Kinetic metamorphism is due to temperature gradients (∇T > 5 K m−1), which induce vapor fluxes in the snow microstructure. It creates plane facets and sharp edges [e.g. Calonne et al.,2014,Schneebeli and Sokratov, 2004] (Figure 1.5). When the temper-ature gradient is very high (∇T > 20 K m−1), depth hoar forms. In both cases, kinetic metamorphism tends to decrease the stability of the snowpack. Faceted crystals and depth hoar are of particular interest since theses types of snow are often involved in slab avalanche releases as the component of the weak layer [Duclos,1998].
• Melt: The melting/refreezing cycle rounds the grains and increases their sizes [Colbeck,1975]. The cohesion depends on the liquid water content: without any liquid water, the bonds are icy and very strong, if the water content is moderate, liquid water creates moderate capillary cohesion forces, if the water content is very high, liquid water plays the role of lubricant and decreases drastically snow cohesion.
• Mechanical load: Because of its high porosity, snow is a very fragile material. Because of its high homologous temperature and crystalline nature, it also exhibits a pronounced creep behavior. It is thus very sensitive to external mechanical stress. First, wind can break falling snowflakes or eroded snow grains into smaller parts [Fierz et al., 2009]. The small snow grains sinter easily together and form a cohesive layer often involved in avalanche release as a slab. Second, snow own weight can enhance its deformation [Chandel et al.,
2007]. For instance, a deeply buried snow layer will densify and stabilize faster than the top layer. Lastly, numerous ski tracks or snow grooming also modifies the snow structure.
In summary, snow can be declined in numerous different materials characterized by a certain microstructure i.e. size, shape and spatial arrangement of grains. The microstructure evolves in time with metamorphism at a scale of the order of 10−4m. The microstructure of snow and the ice properties control the snow properties in-cluding mechanical properties at the snowpack scale (10−1 m) relevant for avalanche
Precipitation Particles
(+, PP, ) Fragmented snow (Decomposing and !, DF, )
Rounded Grains (", RG, ) Depth Hoar (#, DH, ) Melt Forms ( ,MF, ) Faceted Crystals ($, FC, ) Metamorphisms: Equilibrium metamorphism ( T < 5 K m-1) Kinetic metamorphism (5 K m-1 < T < 20 K m-1) Kinetic metamorphism ( T > 20 K m-1) Melt (T=273 K)
Destructive metamorphism (equilibrium + wind) Scale:
1 mm
Figure 1.5: Metamorphism of snow induced by vapor transport and melt. The code and symbols for each snow type are indicated on top of each 3D image. The 3D images of the snow microstructure were obtained with X-ray microtomography.
1.1. Context 13
release.
1.1.4 Snow mechanics
1.1.4.1 General points
Mellor[1975] defines snow mechanics in the following terms: “Narrowly defined, snow mechanics deals with forces and displacements in all forms of snow, i.e. with the kinematics, dynamics and energetics of snow in both condensed and dispersed states. More broadly defined, it also embraces the underlying physics of processes relevant to mechanical behavior, and the useful but disconnected empiricism associated with snow engineering, avalanche prediction, etc.”. Let us focus on the narrow definition of snow mechanics and illustrates the aim of this science by two typical and simple questions:
• What is the maximum force Ft a cylindrical sample can hold if one pull on it along its symmetry axis? Ft defines the tensile maximum resistance force F of the sample, a variable that depends on the size of the sample. The material variable characteristic of the tested snow microstructure is the strengthσt de-fined as the ratioσt= F/S where S is the circular cross-section of the sample. By repeating this test several times on similar microstructure patterns, I can reasonably define the strengthσt characteristics of the tested snow type. Be-ing able to predictσtfor different snow types is of great interest for avalanche forecasting since the tensile failure properties of snow control the opening of the crown crack. However, can I extrapolate the obtained strength to slab con-figuration? Do I obtain the same value if I pull on a bigger sample, in another direction and with a different speed? This raises the question of the effects of size, microstructural anisotropy and strain rate. Therefore, characterizing the tensile strength of a snow microstructural pattern is not only depending on the microstructure itself but on the chosen loading conditions (direction, strain rate) and the chosen scale.
• How much the snow densifies because of its own weight? Answering this ques-tion consists, in material science vocabulary, to determine the volumetric strain during a creep experiment. Does temperature have an effect on the defor-mation? Does the crystalline orientation (the fabric) of each individual ice crystals impact the overall behavior? This example points out that the me-chanical behavior of snow is also a function of the environmental conditions, which drive the material properties of ice, and the complete snow microstruc-ture including the crystalline fabric and not only the spatial arrangement of ice and pores.
In general, one goal of snow mechanics is to find a model (constitutive model), which links forces and displacements or stresses σ and strains ε. As mentioned before, the relationsσ = f (ε) or ε = g(σ) (constitutive equations) might depend on the geometrical microstructure, the strain rate, temperature, the crystallographic
microstructure, the sample history, etc. The challenge of snow mechanics is to find as universal as possible relations and to know their range of validity. Given the wide range of possibilities for each contributing factor, this is a big challenge. To set the context of this PhD, let us focus on two of the main factors: strain rate and microstructure.
1.1.4.2 Effects of strain rate
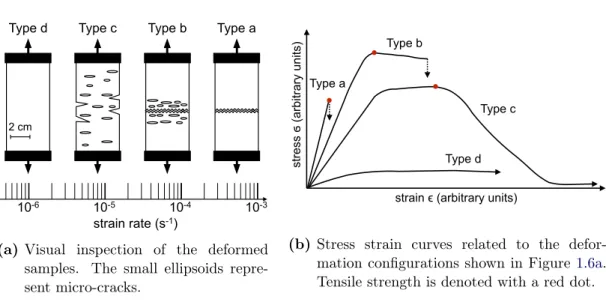
Narita [1983] conducted one of the most comprehensive study on one type of load: tension. To investigate the behavior of snow under tensile stress, he performed sev-eral tests within a wide range of strain rates, temperatures, densities and examined whether the results obtained on small-sized specimens in laboratory were represen-tative of the ones obtained at the scale of an avalanche slope in the field. Narita distinguished four types of deformations under tension according to the imposed constant tensile strain rate ˙ε (Figure 1.6):
• Type (a) with 10−4 s−1 < ˙ε. It corresponds to a visco-elastic regime char-acterized by a linear relation σ = E· ε between stress σ and strain ε with E = E( ˙ε) the Young’s modulus. Note that the linear relation between stress and strain exists at small strains for the four described types of deformations, i.e. independently of the strain rate. Fracture occurs suddenly with a sharp failure surface. This type of regime is called “brittle” regime.
• Type (b) with 7.0 × 10⁻⁵ < ˙ε < 2.4× 10⁻⁴ s−1. It corresponds to a visco-elastic and plastic behavior. Fracture occurs after the stress has reached a plateau and significant pseudo-plastic strain. The formation of micro-cracks around the final failure surface can be observed. This deformation regime is called “ductile” failure.
• Type (c) with 1.0×10⁻⁶ < ˙ε < 7.0×10⁻⁵s−1. It is similar to the deformation regime observed on type (b) but there is no clear failure surface and the stress decreases smoothly to zero after reaching its maximum value. There is notable formation of micro-cracks throughout the sample.
• Type (d) with ˙ε < 7.0 × 10⁻⁶ s−1. The sample deforms continuously without the formation of micro-cracks even for large strain (up to 0.3). This deforma-tion regime is called “creep”.
The observations by Narita illustrate the effect of strain rate on the overall defor-mation regime. The different types of defordefor-mations are due to different mechanisms activated at the microstructural level such as elasticity, damage (micro-failure) or plasticity. Deciphering the macroscopic mechanical behavior of snow cannot be unlinked to the processes occurring at the microscopic level. These processes are governed by the microscopic ice properties which depend on temperature and crys-tal orientation, and the microscopic strain rate distribution which depends on the imposed macroscopic strain rate and the microstructure.
1.1. Context 15
strain rate (s-1)
10-6 10-5 10-4 10-3
2 cm
Type d Type c Type b Type a
(a) Visual inspection of the deformed samples. The small ellipsoids repre-sent micro-cracks.
strain ϵ (arbitrary units)
stress ϭ (arbitrary units) Type d Type c Type b Type a
(b) Stress strain curves related to the defor-mation configurations shown in Figure 1.6a. Tensile strength is denoted with a red dot. Figure 1.6: Qualitative description of four types of deformation and fracture of
snow under uniaxial tensile strain. Adapted from [Narita,1983]. 1.1.4.3 Effects of microstructure and density
The tensile tests with different snow density and temperature conducted by Narita also show that strength tends to increase with density and decreases with temper-ature. He observed variations of strength with density in the range between 250 and 450 kg m−3, of the same order of magnitude as those observed with strain rate in the range ˙ε ∈ [10−6, 10−3] s−1. Narita noted that “the structure of snow [...] i.e. diameter, length, orientation and number of ice bonds [..] is likely to have a predominant effect on the strength of snow rather than the density itself".
Mellor[1975], Shapiro et al.[1997] reviewed the most important results of snow mechanics. They recognized the importance of the microstructure in controlling snow’s mechanical properties. However, in practice, a majority of the experimental studies determines the mechanical properties of snow and its density but give no further information of its microstructure. A few studies characterize the microstruc-ture mainly in term of snow type in the international classification. However, the discrete classification in snow types does not account for the continuum between snow types and the bonding between snow grains expected to be a critical mechan-ical predictor. Therefore, the mechanmechan-ical properties are usually plotted and fitted only against density [e.g.Mellor,1975] (Figure1.7). As shown for the Young’s mod-ulus and the tensile strength on Figure1.7, the usual phenomenological mechanical parameterization based on density shows a large scatter for a fixed density. For instance, Keeler and Weeks [1968] showed that two snow samples with the same density but different microstructures may have strengths differing by as much as a factor of four. The scatter observed on Figure 1.7b is even bigger, about two or-ders of magnitude, and can be attributed to the effect of microstructure (other than density) and strain rate. This scatter decreases but remains important if the snow types are distinguished, indicating that the snow type classification is not sufficient
(a) Young’s modulusE as function of snow
density ρ. Compilation of
microstruc-ture based simulations and experimen-tal data from [Hagenmuller et al.,
2014a, Kry, 1975b,Maeno et al., 1978,
Marshall and Johnson, 2009, Mellor,
1975, Scapozza, 2004, Schweizer and Camponovo,2002,Sigrist,2006].
(b) Domain of tensile strengthσt as
func-tion of snow densityρ for different
mea-surement procedures: centrifugal data (e.g. [Upadhyay et al., 2007]), in situ data (e.g. [McClung,1979]) and other laboratory measurements (e.g. [Narita,
1983]). Taken from [Borstad,2011] who compiled experimental data with over 2000 strengths tests from 20 different sources. See [Borstad,2011] for details. Figure 1.7: Young’s modulus and tensile strength of snow as a function of snow
density.
to describe the snow microstructure [e.g.Jamieson,1988]. Therefore, there is a need to derive microstructural descriptors relevant for snow mechanics that go beyond the first order characterization by density. Since a similar status by Shapiro et al. (“developing a method of using microstructural properties as an indicator of defor-mational response to load still remains to be done” [Shapiro et al.,1997]), different approach linking microstructure and mechanical properties were proposed and are summarized in section 1.2.
1.1.5 General objective of the thesis
In summary, avalanches are still a major danger in mountainous area by threatening human infrastructures and activities. Therefore, there is a social need for short-term avalanche prediction and long-term prevention. However much about the release process remains unknown, which limits the predictability of an avalanche event. In practice, the forecasting of avalanche occurrence probabilities still relies on heuristic approach or on sparse historical data. One limiting point to understand the release mechanism is the complexity of snow and its mechanics. While the effect of
meteo-1.2. Present state of snow mechanics 17
rological and environmental conditions on the snow metamorphism is fairly known, the relation between snow microstructure and mechanical properties is poorly un-derstood. Strain rate controls the deformation mechanisms at the microstructural level and will be determinant to formulate a constitutive model of snow. The usual characterization of the snow microstructure only with density is not complete since it fails to describe the wide variety of microstructural patterns of snow.
The objective of this thesis is to better understand the mechanisms active at the microstructure scale when snow deforms and fracture to go toward a mechanical constitutive law accounting for microstructure in a more precise way. Given the wide range of deformation types, snow types, environmental conditions, etc. this challenge is too large for a single PhD. Therefore, I will limit this study to a certain range of possibilities and only consider:
• dry snow (T < 0oC),
• relatively high strain rates (10−4 s−1 < ˙ε), relevant for slab avalanche releases, • apparently homogeneous snow samples which evolve because of deformations
and not “thermodynamic” metamorphism, • small samples of volume on the order of 1 cm3.
The present study aims to explore the link between the geometrical microstructure of snow and its bulk mechanical properties, assuming that ice behaves in a brittle regime. It is based on the current state of knowledge presented in the next section.
1.2
Present state of snow mechanics
In this section, we focus on the incorporation of microstructure indicators in con-stitutive modeling of snow mechanics. First, attention is paid to the description of the snowpack by avalanche forecasters and especially on how the snow microstruc-ture is characterized in the mechanical module (MEPRA) of the French operational avalanche risk forecasting model (SAFRAN-CROCUS-MEPRA). Then the present state of academic research in this domain is summarized.
1.2.1 Operational avalanche forecasting
In many countries with snow-covered mountains, avalanche-forecasting services warn the public by issuing occurrence probabilities for a certain region [Schweizer et al.,
2003]. We describe briefly here the avalanche forecasting conducted by Météo-France, which is similar to the ones conducted abroad. We especially pay attention on the characterization of the snow material.
Météo-France provides on a daily basis between December and May an avalanche bulletin (BRA) which estimates the type and intensity of the avalanche activity on a massif scale (about 150 km2, ex. massif de la Chartreuse). The avalanche activity is detailed for different altitudes, exposures and time slots. As mentioned before, the
release of an avalanche results from the interplay of several contributing factors, some of which are poorly understood. Therefore, the avalanche risk cannot be predicted in a fully deterministic manner but its prediction results from a human expertise. The avalanche forecaster bases his analysis on: (1) field observations (atmospheric conditions, snow stratigraphy, record of past avalanche activity) and (2) the results of a snow mantle evolution model (SAFRAN-CROCUS-MEPRA).
1.2.1.1 Field observations
To follow and forecast the evolution of the snowpack and its stability, the snowpack is measured systematically during the winter season at different time/spatial resolution and level of details. This information is then gathered by Météo-France.
First, more than 100 sites mainly located between 1500 and 2000 m altitude throughout the Alps, Pyrenees and Corsica constitute an observation network (“réseau nivométéorologique”, [Pahaut and Giraud,1995]). This network comprises a major-ity of ski patrols. On each site, manual measurements are conducted twice a day (around 8h and 13h) to record cloud, temperature, wind, precipitation, total snow depth, new snow depth, blowing snow and past avalanche activity.
Second, in order to complete these first observations, detailed measurements of the snow profile from the ground to the surface are conducted on a large number of sites in the observation network. This measurement requires digging a snow pit and is therefore time-consuming. It is not done on a daily basis but at least once a week. To define the different snow layers, every change in snow characteristics is identified manually by detecting changes in snow “aspect” and hardness. Then the snow type, grain size, density, water content and hand hardness are measured for each layer according to a standard protocol described by Fierz et al. [2009] (Figure 1.8). The snow type and grain size are estimated under magnifying glasses (x10). The penetration resistance (or ram hardness) is also measured via a ramsonde [Bader and Niggli,1939]. Ram and hand hardness are important mechanical measurements of the snowpack since they are linked to the cohesion of the snowpack and thus to its stability.
Last, about thirty automatic measurement stations “Nivose” covering the French massifs record air temperature, wind, snow height and humidity with a time reso-lution of about 1h [Lecorps and Sudul,1991]. They are complementary to the ob-servation network “réseau nivométéorologique”, since they can be installed in places difficult to reach in winter and can cover a wider range of altitude and a finer time resolution.
1.2.1.2 MEPRA model
The avalanche forecaster has to synthesize the information provided by the observa-tion network in order to provide an evaluaobserva-tion of the avalanche activity for the next day. However, given the variety of snow profiles and weather conditions at different locations, it is very difficult to capture the entire snowpack evolution and to point
1.2. Present state of snow mechanics 19 0 20 40 60 80 100 120
Penetration resistance (daN)
0 20 40 60 80 100 120 Height (cm) 20 Temperature (15 10°C) 5 0
f1 f2 diam dur hu mv tel ci 0
20 40 60 80 100 120 ◦◦ 1.0 4 1 389 0 -◦• 0.6 2 1 300 0 -◦ 0.7 3 1 305 0 -◦ 1.2 4 1 336 0 -∧ 0.8 2 1 224 0 2.0 ∧ 0.5 2 1 186 0 0.3 + / - 1 1 67 0
-Figure 1.8: Measured snow profile at Col de Porte (Chartreuse, France) on the 13/02/2012. On the left, the blue bars represent the ram strength and the black line the temperature profile. The green horizontal bars represent the ram strength calculated by MEPRA (see below) based on the snow layer measurements (right). The red stars indicate the layers in which some samples were collected for microtomography. On the right, "f1 f2" denotes the primary and secondary snow types, "diam" the diameter of the grains, "dur" the hand hardness, "hu" the humidity of the layer, "tel" the liquid water content in % and "ci" the shear strength in kPa measured by a rotational vane. Ice layers are plotted in light blue.
out situations that can lead to instability [Pahaut and Giraud,1995]. The hundred of measurement points are distributed throughout the Alps according to the altitude and exposure, the mesh network is thus very large and localized instability-prone conditions can be masked. In addition, the survey of the internal snow profile is only conducted once a week and; in case of very unstable weather conditions, the time res-olution of this observation is thus insufficient to estimate snowpack changes [Pahaut and Giraud, 1995]. In order to help the forecaster, Météo-France developed in the 1990’s, the automatic avalanche forecasting system SAFRAN-CROCUS-MEPRA (SCM) [Durand et al., 1999]. At present, this model is a secondary help for the avalanche forecaster but is intended in the future to provide a deterministic evalua-tion of the avalanche risk by progressively incorporating research results. SAFRAN estimates meteorological parameters affecting snowpack evolution. Based on the output of SAFRAN, CROCUS simulates the physical processes inside the snowpack to reproduce the evolution of the snowpack. MEPRA is an expert system which analyses the mechanics of the snowpack modeled by CROCUS to deduce natural and accidental avalanche risks. To describe the great variability of topographic situ-ations, the system SCM simulates the snow-cover evolution and its stability for many typical slopes, elevations and aspects, representative of the different French massifs. In the following, we focus on the description in SCM of the snow microstructure and its link to mechanical properties.
In CROCUS, the microstructure of snow in each snow layer is described by density ρ, age A, liquid water content dl and sequantitive descriptors of the mi-crostructure morphology: dendricity d, sphericity s, historical variable h and grain size gs [Brun et al., 1992, Vionnet et al., 2012]. In fact, the description of the snow microstructure is directly inspired from snow pit observations (Figure1.9) and corresponds to a continuous parameterization of the discrete classification in snow type. Grain size gs represents the diameter of grains observed in the field. Den-dricity d characterizes freshly fallen snow and varies from 1 (recent snow) to 0 (no recent snow); it roughly represents the remaining initial geometry of snow crystals in the layer, and decreases over time in a given layer. Sphericity s ranges between 0 (angular grains) and 1 (rounded grains) and describes the ratio of rounded ver-sus angular shapes. It is arbitrarily fixed at 0.5 for precipitation particles. The historical variable h records whether the snow layer had been in contact with liq-uid water or has undergone temperature gradient metamorphism. The variable h is discrete (1: has been angular, 2: has been in contact with liquid water but was never angular, 3: has been in contact with liquid water and has been angular, 4: has undergone several melt-freeze cycles and was never angular, 5: has undergone several melt-freeze cycles and has been angular, 0: all other cases). The snow type is a function of d, s, h and gs (Figure 1.9). Note that semi-quantitative relations between dendricity d and sphericity s, on the one hand, and geometric quantities such as curvatureκ, perimeter P and area a, on the other hand, can be derived from 2D images of snow grains [Bartlett et al.,2008,Lesaffre et al.,1998]. However, the evolution of the morphological variables was parameterized with (d,s) deduced from manual observations and linking (d,s) and (κ, P , a) requires additional adjustment
1.2. Present state of snow mechanics 21
parameters. Recently, Carmagnola et al. [2014] rewrote the original equations of CROCUS formulated with d, s and gs in terms of s and the optical diameter dopt
(details in [Warren, 1982]), which is a well-defined variable and measurable in the field: d = dopt−4+s
s−3 andgs= (4− s) with dopt and gs in mm. This is a first step
to-ward a complete physical parameterization of CROCUS on variables unambiguously defined and measurable.
+
+ /
! /
! /
Sphericity Dendricity 0 1 1 0.5 0.3 0.6 0.8 Sphericity 0 0.2 0.5 0.8 1 0 1 2 3 Historical data ! ! ! ! ! ! ! ! !! !! ! ! ! ! ! ! ! ! ! ^ ^ ^ ! ! ! ^ ^ ^ ! ! "^ ^ " ! ! "^ ^ " ! " " " " " " ! !" !" ! " ! " ! " ^ " "^ ^ "/
!
/
!
!
/
$$$!
(a) Dendritic snow. Note that gs is
arbi-trarily set to 0.3 mm for all dendritic snow (d > 0).
+
+ /
! /
! /
Sphericity Dendricity 0 1 1 0.5 0.3 0.6 0.8 Sphericity 0 0.2 0.5 0.8 1 0 1 2 3 Historical variable ! ! ! ! ! ! ! ! !! !! ! ! ! ! ! ! ! ! ! ^ ^ ^ ! ! ! ^ ^ ^ ! ! "^ ^ " ! ! "^ ^ " ! " " " " " " ! !" !" ! " ! " ! " ^ " "^ ^ "/
!
/
!
!
!
(b) Non dendritic snow. The size of the disk represents the grain sizegs (small
disk gs < 0.5 mm, intermediate 0.5 < gs< 1.0 mm, large 1.0 mm < gs).
Figure 1.9: Recent snow is described in terms of dendricity and sphericity (a), and the “evolved” snow is defined by its grain size, sphericity and history (b). Color and symbol correspond to the international classification [Fierz et al.,2009]. If the snow type does not correspond to a unique type in the classification, it is described by two symbols. The first symbol (left or top) is the primary snow type, the second symbol (right or bottom) is the secondary snow type.
MEPRA [Giraud, 1992] deduces one risk level for natural avalanches and one for skier-triggered slab avalanches, based on the snowpack simulated by CROCUS. To compute these levels, MEPRA uses several “expert rules”. For instance, if the snowpack stability increases from low to moderate, then the natural risk is relatively low since all potential avalanches should have already released. MEPRA is also based on a static stability index S computed for each layer and defined as:
S = τmax τn+ τs
, (1.1)
whereτmax is the shear strength of the layer,τnthe shear stress due to the weight of
snow andτs is a possible additional stress due to a skier. The value ofS quantifies
the volume of snow above the potential failure layer, and additional expert rules not described here. The shear strength τmax is a function of snow density ρ, type of grains (s, d, gs,h) and the volumetric liquid-water content dl. The relation between τmaxand the CROCUS output variables are empirical and obtained by adjustments on experimental data collected by J.-P. Navarre in the 1990’s (unpublished work). This relation is of the general form:
τmax = C· (10−4· ρ2− 0.6) + 0.12 (1.2) whereC is a factor which depends on the snow type and the volumetric liquid water content:
C = Csph(s, h)· Cden(d)· Cmts(gs, d, s)· Cf e(dl, ρ)· Cf re(dl, ρ, h, s, Cmts). (1.3) The coefficients Csph,Cden, Cmts, Cf e,Cf re respectively account for the effects of sphericity, dendricity, grain size, liquid water content and freeze-melt cycle on the shear strength. These coefficients are piecewise linear functions adjusted according experimental data and an expert analysis (see Appendix 1.A.1). Figure1.10 shows the modeled τmax as a function of density from dendritic snow. The parameteri-zation of MEPRA is an “expert” parameteriparameteri-zation also including qualitative knowl-edge on the influence of the morphology of grains on the bulk mechanical properties. Nevertheless, the complexity of the parameterization and the numerous cases distin-guished on arbitrary threshold values tends to indicate that the current description of the microstructure might be not the most suited to characterize the mechanical properties of snow. The use of many adjustments variables in equations 1.2 and 1.3 also reveals our incomplete understanding of the link between microstructure and mechanical properties. Note that in order to evaluate MEPRA against snow mantle observations the ramsonde strength is also computed by MEPRA (G. Gi-raud, unpublished). The measured and modeled snow profiles are shown in Figure 1.8. The main structure of the measured ramsonde profile is fairly characterized by MEPRA and shows the absence of a dry slab structure (Figure 1.8). However, an important deviation from the measured penetration resistance is observed. Note that this deviation is partially due to the spatial variability of the snow mantle at the scale of a snow pit but it also reveals the difficulty to provide an accurate pa-rameterization of the snow mechanical properties based on the current description of the snow morphology.
In summary, the formalism used to describe the snow microstructure in the sys-tem SCM is based on snow-pit observations. This provides a direct mean to compare simulations and observations. However, observations of the snow microstructure are mainly qualitative and restricted to a certain a number of classes (snow types in the international classification), whereas the mechanical properties are continuous. Moreover, the characterization of morphology (size and shape) of separated grains misses information about the connection between the snow grain which are de-terminant to estimate mechanical properties [Colbeck, 1997]. In consequence, the parameterization of mechanical properties in MEPRA requires many adjustment parameters.
1.2. Present state of snow mechanics 23
80
100
120
140
160
180 200
Density (kg m
−3)
0.0
0.5
1.0
1.5
2.0
2.5
3.0
3.5
4.0
Shear strength (kPa)
Snow type
PP
PP-DF
DF
DF-RG
DF-FC
Figure 1.10: Shear strength computed by MEPRA as a function of density. For
PP, d∈ [0.8, 1] and s ∈ [0, 1]. For PP-DF, d ∈ [0.6, 0.8] and s ∈ [0, 1].
For DF, d ∈ [0.4, 0.6] and s ∈ [0, 1]. For DF-RG, d ∈ [0.0, 0.4] and
1.2.2 Research
The challenge of snow mechanics is to relate stress and strain with a parameteri-zation taking into account strain rate, microstructure, temperature etc. Two main approaches to go toward constitutive modeling of snow can be distinguished: “de-scriptive” studies and “explicative” studies. In other words, these approaches are called “constitutive equations based on continuum theories” and “constitutive equa-tions based on the structure” bySalm [1982] or “descriptive and experimental stud-ies” and “microstructural studstud-ies” byMellor[1975] andTheile[2010] or “correlation studies” and “causation studies” by Shertzer [2011]. The first approach consists in the measurement of mechanical properties under a certain range of experimental conditions and the formulation of an empirical model based on correlations between the observed properties and microstructural indicators or loading conditions. The second approach is intended to be explicative. A physical model is proposed based on assumptions of micro-mechanisms and on the microstructure geometry. Then, the model is compared against experimental data. If the agreement between the model predictions and experiments is good, the given assumptions are expected to be valid or, at least, to be relevant to predict the macroscopic behavior).
In the present state of the art, studies of both approaches will be presented with a more detailed focus on the second approach since this PhD work belongs to this explicative approach. Experimental methods to characterize the microstructure and to measure mechanical properties are prerequisite to both approaches and will be presented first.
1.2.2.1 Observations of the microstructure
The simplest and most common method to observe the snow microstructure in the field is by magnifying glasses (x10). A few individual grains are extracted from the snowpack and the grain size and grain shape are estimated visually. From these observations, a snow type is determined according to the international classification [Fierz et al.,2009]. The classification is not entirely deterministic since it relies on the interpretation of the observer based on limited information (size and shape). Moreover, fitting a continuum of microstructural patterns into a discrete classifica-tion inevitably requires arbitrary thresholds between types. For instance, endless discussions to choose between RG/FC (primary type is rounded grains, secondary type is faceted crystals) or FC/RG are common! To decrease variability due to various human observers, Lesaffre et al. [1998] automatized the evaluation of grain characteristics from digital grain images.
The observation of individual grains does not allow characterizing the bonding between grains. To overcome this limitation and in order to analyse the connectivity of the ice matrix, thin sections were rapidly used by snow scientists [e.g.Bader and Niggli,1939]. A block of snow is slowly immersed in a liquid chemical with a negative melting point (e.g. acid diethyl ester [Kry,1975a] or diethyl phthalate [Good,1987]). The mixture is then frozen to obtain a solid block which is cut in thin slices. The thin slices reveal the geometry of the microstructure including the bonding system
1.2. Present state of snow mechanics 25
in a certain plane. Under polarized light, the crystallographic structure can also be revealed [e.g. Quervain,1983]. Arnaud et al. [1998] used preferential etching of the crystal boundaries to determine the crystallographic structure on thick sections. With stereological methods, 3D characteristics of the snow microstructure can be derived [e.gKry,1975a]. However, the assumptions used to convert measurements from 2D thin sections into 3D microstructural parameters are often overly simplified, e.g. the bonds are assumed to be planar and circular [Alley,1986].
Good[1987] performed the first 3D reconstruction of a snow sample by combining a series of images of parallel thin sections. This method, called serial sectioning, is very time-consuming and rarely applied. The images of the successive slices are combined to create a 3D image of the microstructure. It allows deriving directly 3D properties which are difficult to extract from 2D data, especially properties linked to the connectivity of the ice matrix. A 3D image represents a huge amount of information. In the 1990’s, the computing power was not able to efficiently analyse this wealth of data. Nowadays, computing power has tremendously increased and 3D imaging has become common. Theile and Schneebeli[2011] used serial sectioning and the preferential sublimation at grain boundaries [Arnaud et al.,1998] to detect crystallographic grain boundaries in a 3D sample. Serial sectioning remains the only method to obtain the 3D crystallographic structure with no limitations on the number of crystals.
Brzoska et al. [1999] conducted the first X-ray microcomputed tomography (µCT) on a snow sample. µCT uses back-projection algorithms to obtain 3D data from several radiographs recorded at different projection angles. µCT measures the 3D distribution of the X-ray attenuation coefficient, which differs between materials with different chemical composition and density. With this method, a snow sample can be imaged (e.g. a volume of 10003 voxels with a side-length of 10 µm) within one hour without any manual interactions. Moreover, µCT can be conducted with-out destroying the sample and therefore the time evolution of microstructure can be directly followed [Calonne et al.,2013,Schneebeli and Sokratov,2004]. Very fragile and unstable samples collected in the field can be impregnated to avoid damage during transport and to block thermodynamic metamorphism [Flin, 2004, Heggli et al.,2009]. In this case, the imaging procedure is destructive since the impregna-tion product cannot be completely removed from the snow sample. Roscoat et al.
[2011a] used X-ray diffraction contrast tomography (DCT) to reveal simultaneously the geometrical and crystallographic structure of snow. However, DCT is still under development and limited to about one hundred of different crystals, because of the difficulty to match each crystal to its diffraction spot.
1.2.2.2 Mechanical measurement techniques
The focus in this section is on the measurements of material properties of homoge-neous snow. Many field tests exist to estimate the stability of a slope and to detect potential weak layers, such as the compression test, the extended column test, the Rutschblock or the saw test. Reiweger et al.[2010] also estimated the shear strength
of the weak layer - slab system in a cold laboratory. These measurements are es-sential to understand the release of an avalanche but from a material science point of view, they are already too complex to be able to understand the role of the mi-crostructure on the overall behavior, because they characterize a system composed of different snow layers. I propose below an overview of measurements methods of homogeneous snow, an exhaustive list of which can be found in the reviews ofMellor
[1975] and Shapiro et al.[1997].
Brittle failure properties To measure the mechanical hardness of a snowpack, Haefeli [Bader and Niggli,1939] developed the ramsonde from penetrometers used in soil mechanics. The hardness is linked to the compression strength of snow at high strain rate. To improve the ability to detect thin layers in snow and to determine snow mechanical properties, Schneebeli and Johnson [1998] developed a new version of the ramsonde, a small diameter cone penetrometer called SMP. The small tip (5 mm diameter) of the SMP measures a highly variable force caused by the rupturing of microstructural elements in the snow. SMP force measurements are linked to the snowpack stability. However, exact interpretation of the SMP signal as a function of snow strength is not completely understood. For instance, Herwijnen
[2013] showed that the compaction zone around the SMP tip is far from negligible and has to be accounted for when interpreting SMP force measurements.
The shear strength of alpine snow is an important parameter in avalanche stabil-ity evaluation. Several investigators have indexed the shear strength of alpine snow using in situ shear frames, in situ shear vanes, in situ rotary vanes or laboratory shear apparatus (see Perla et al. [1982] for references). Strong effects of apparatus geometry and loading rate are present in the shear indices. Barbero et al. [2013],
Podolskiy et al. [2014] developed a new shear apparatus with a possible control of the normal pressure and shear strain rate.
Perla[1969] used cantilever beams to determine an index for tensile strength of snow. Kirchner et al.[2004] also used cantilever beams to measure snow strength and showed that there is no size dependence (at the scale around 0.1 m) of strength but that the measured strength distribution exhibits a very low Weibull modulus, which indicates that strength measurements can be contaminated with large statistical errors. Sigrist [2006] used cantilever beam tests and three-point bending tests to measure strength. He also used pre-cracked samples to measure toughness in mode I and II. Upadhyay et al. [2007] used a centrifugal machine to measure the tensile strength of snow. Note the excellent review of tensile strength measurements from
Borstad [2011].
Elastic properties Elastic properties of snow are difficult to measure because elasticity is limited to very small strains and snow is very fragile. Nakaya [1959] measured the visco-elastic properties by a transversal vibration method. Sigrist
[2006] used cyclic loading device (developed by F. Hempel) oscillating at 100 Hz.