HAL Id: tel-02075327
https://hal.univ-lorraine.fr/tel-02075327
Submitted on 21 Mar 2019
HAL is a multi-disciplinary open access archive for the deposit and dissemination of sci-entific research documents, whether they are
pub-L’archive ouverte pluridisciplinaire HAL, est destinée au dépôt et à la diffusion de documents scientifiques de niveau recherche, publiés ou non,
Effects of management and climate on the plant
functional diversity related to ecosystem services of
permanent grasslands in Europe
Simon Taugourdeau
To cite this version:
Simon Taugourdeau. Effects of management and climate on the plant functional diversity related to ecosystem services of permanent grasslands in Europe. Agronomy. Université de Lorraine, 2014. English. �NNT : 2014LORR0039�. �tel-02075327�
AVERTISSEMENT
Ce document est le fruit d'un long travail approuvé par le jury de
soutenance et mis à disposition de l'ensemble de la
communauté universitaire élargie.
Il est soumis à la propriété intellectuelle de l'auteur. Ceci
implique une obligation de citation et de référencement lors de
l’utilisation de ce document.
D'autre part, toute contrefaçon, plagiat, reproduction illicite
encourt une poursuite pénale.
Contact : [email protected]
LIENS
Code de la Propriété Intellectuelle. articles L 122. 4
UNIVERSITE DE LORRAINE
ÉCOLE DOCTORALE: RP2E
Laboratoire Agronomie et Environnement UMR 1221 UdL-INRA Nancy-Colmar Agroscope Institut des sciences en durabilité agronomique (IDU) Zürich
THESE de Doctorat
Présentée et soutenue publiquement le 11/03/14 pour l'obtention du grade de docteur de l'université de lorraine (spécialité: sciences agronomiques)
par
Taugourdeau Simon
Effects of management and climate on the plant functional diversity
related to ecosystem services of permanent grasslands in Europe
Composition du jury:
Rapporteurs: Dr John Finn Chercheur Teagasc (IRL)
Dr Danièle Magda Directeur de recherche INRA (FR)
Examinateurs: Pr Andreas Lüscher Responsable de groupe Agroscope (CH)
Pr David Mouillot Professeur Université de Montpellier II (FR) Pr Johannes Isselstein Professeur Université Göttingen (GE) Directeurs de thèse: Pr Sylvain Plantureux Professeur Université de Lorraine (FR)
Abstract
Permanent grasslands can provide a large diversity of ecosystem services. They are found in contrasted conditions in terms of management and climate in Europe. These conditions induce a wide variety of grassland types that differ in their vegetation and are expected to differ with respect to the provision of ecosystem services. Because ecosystem functioning in grassland has been shown to be linked to plant functional diversity criteria, we put forward that these functional diversity criteria can be used to evaluate the provision of ecosystem services. These criteria are influenced by the management and the climate. The overall objective of this PhD program is to assess the effects of management and climate on the plant functional diversity related to ecosystem services of permanent
grasslands. The first step of the PhD program was to select 29 functional diversity criteria related to 8
ecosystem services (quantity of forage, forage quality, stability of the forage production, biodiversity conservation, pollination carbon sequestration, dryness resistance and nitrogen fertility). This selection was made using experts' interview and literature survey. The second step was to evaluate inaccuracies in the calculation of the 29 functional diversity criteria from functional trait databases and different sets of botanical surveys. The third step was to estimate the functional diversity criteria from management and climate data using ―Random Forests‖ methodology. The results show that the climatic variables had generally more effect on the functional diversity than the management ones. Furthermore, for some climatic conditions, the management does not affect some functional diversity criteria. Among the 29 functional diversity criteria, only 8 have more than 40 % of their variance explained by the management and climate variables.
Keywords Functional diversity, climate, management, ecosystem services, permanent grasslands Résumé
Les prairies permanentes peuvent fournir une grande diversité de services écosystémiques. Elles se trouvent dans des conditions contrastées en termes de gestion et de climat en Europe. Cette diversité de conditions induit une grande variété de types de prairies différant par leur végétation et leur fourniture en services écosystémiques. Certains travaux suggèrent que le fonctionnement des écosystèmes prairiaux peut être directement relié à des critères de diversité fonctionnelle végétale. Ces critères, qui pourraient être utilisés pour évaluer les services écosystémiques, sont influencés par la gestion et le climat. L'objectif de ce doctorat est d'évaluer les effets de la gestion et du climat sur la diversité fonctionnelle végétale liée à des services écosystémiques des prairies permanentes. La première étape a consisté à sélectionner 29 critères de diversité fonctionnelles liés à 8 services écosystémiques (quantité de fourrage, qualité du fourrage, stabilité de la production de fourrage, conservation de la biodiversité, pollinisation, la séquestration du carbone, résistance à la sécheresse et fertilité azotée). Cette sélection a été faite à partir d‘interviews d‘experts et d‘une revue de la littérature. La deuxième étape a consisté à évaluer différentes inexactitudes dans le calcul des 29 critères de diversité fonctionnelle à partir de bases de traits fonctionnels et différents jeux de relevés botaniques. La troisième étape a consisté à évaluer les critères de diversité fonctionnelle à partir des données de gestion et de climat, en utilisant notamment la technique mathématique des forêts de Breiman. Les résultats montrent que les variables climatiques ont généralement plus d'effet sur la diversité fonctionnelle que celles de gestion. En outre, pour certaines conditions climatiques, la gestion n'affecte pas certains critères de diversité fonctionnelle. Parmi les 29 critères de diversité fonctionnelle, seulement 8 critères avaient plus de 40% de leur variance expliquée par la gestion et le climat.
Mots clés: diversité fonctionnelle, climat, gestion agricole, services écosystémiques prairies
Table of content
Acknowledgements ... 2
Résumé élargie en Français de la thèse ... 3
A. Introduction ... 3
B. Première partie : Sélection de critères de diversité fonctionnelle reliés aux services écosystémiques des prairies permanentes. ... 4
C. Deuxième partie : estimation des imprécisions dues à l’utilisation des bases de traits fonctionnels et de relevés botaniques. ... 4
D. Troisième partie : Effets de la gestion et du climat sur la diversité végétale fonctionnelle des prairies permanents. ... 6
E. Conclusions de la thèse ... 7
Introduction ... 9
I. Ecosystems as a source of human well-being ... 9
F. Benefits that the ecosystems provide for mankind ... 9
G. Human impact on ecosystems ... 9
H. How to preserve or improve the provision of ecosystem services? ... 9
II. Grassland: an important but threatened provider of ecosystem services in Europe 10 A. Definition of grassland ... 10
B. State and dynamics of grassland in Europe ... 11
C. Grassland ecosystem services ... 12
D. The Multisward project ... 13
III. Quantification of the ecosystem services ... 14
A. Direct quantification: ecosystem services and process measurements ... 14
B. Plant biodiversity as an indicator of ecosystem functioning and ecosystem services .... 15
C. Utilization of vegetation criteria in evaluating tool of ecosystem services ... 20
IV. Effect of management on functional diversity of grassland ... 21
A. Selection of functional trait at individual scale by management and climate ... 22
B. Effect of management and climate on functional diversity ... 22
V. Objectives, hypotheses, and research strategy ... 23
Chapter 1: Selection of functional diversity criteria linked to grassland ecosystem services ... 25
Abstract Chapter 1 ... 25
I. Objective ... 26
II. Selection of the ecosystem services... 26
A. Choice of the ecosystem services for the study ... 26
B. Description of the selected ecosystem services and their quantification ... 28
III. Subdivision of the ecosystem services into ecosystem functions, processes and states ... 29
A. Biodiversity conservation and pollination ... 30
V. Chapter Conclusion ... 34
Chapter 2: Estimation of the errors in the calculation of functional diversity criteria from databases ... 45
Abstract Chapter 2 ... 45
I. Introduction ... 46
A. Different errors on the utilization of functional trait databases ... 46
B. Utilization of different datasets of botanical survey ... 46
II. A framework for the utilization of functional trait database with only one value per species regarding the intraspecific variability of functional trait ... 48
A. Abstract ... 48
B. Introduction ... 48
C. Material &Methods... 51
D. Results ... 56
E. Discussion ... 62
III. Filling the gap in traits databases Use of ecological hypotheses to replace missing data 68 A. Summary ... 68
B. Introduction ... 69
C. Materials and methodology of imputation of missing data ... 71
D. Results of imputation methods at the species level ... 74
E. Discussion of the accuracy of the imputation methods ... 78
F. Effects of the imputation methods for the calculation of functional diversity indices ... 79
G. Conclusions ... 85
IV. Effect of the deletion of the minor species in the calculation of functional diversity 87 A. Objective ... 87
B. Material and methods ... 87
C. Results ... 88
D. Discussion ... 89
V. Functional diversity-area relationship in permanent grassland ... 91
A. Abstract ... 91
B. Introduction ... 91
C. Materials and Methods ... 91
D. Results ... 92
E. Conclusion ... 92
VI. Chapter Discussion ... 94
A. Difference between the components of functional diversity ... 94
B. Conclusion ... 95
Chapter 3: Effects of management and climate on plant functional diversity in permanent grasslands and estimation of plant functional diversity from climate and management. ... 96
Abstract chapter 3 ... 96
I. Context /Objective ... 97
II. Presentation of the dataset ... 98
III. Choice of Statistical Analyses ... 113
IV. Assessments of the general trends between management, climate and diversity of grasslands, ... 114
A. Objective ... 114
B. Material and methods ... 115
C. Results ... 118
D. Discussion ... 120
E. Conclusions ... 122
V. Conditional effect assessments: Estimating functional diversity of grasslands from agricultural management and climatic conditions ... 122
A. Objective ... 122
B. Materials and methods ... 122
C. Results ... 123
D. Discussion ... 128
E. Conclusion ... 131
VI. Chapter conclusion ... 131
A. Conclusions on the effects of management and climate on functional diversity ... 131
B. General trends versus conditional effects ... 133
C. Results of the random forest on all the functional diversity criteria ... 137
D. Predicting functional diversity: why so much error? ... 138
General Discussion ... 140
I. Principal conclusions of the different chapters ... 140
II. Evaluation of ecosystem services from management using functional diversity ... 142
III. Addition of the inaccuracies for a future evaluation of ecosystem services ... 143
A. Addition of the inaccuracies ... 143
B. How to improve the evaluation of ecosystem services? ... 145
IV. Conclusions ... 147
Bibliography ... 148
Annexes ... 164
Annex I: Progress report on the effect of grassland management on grassland biodiversity from the field to the landscape level as input for Task 3.4 and 3.5 ... 165
A. Summary ... 165
B. Introduction ... 166
C. Short summary of the effects of agricultural management on plant specific richness .. 167
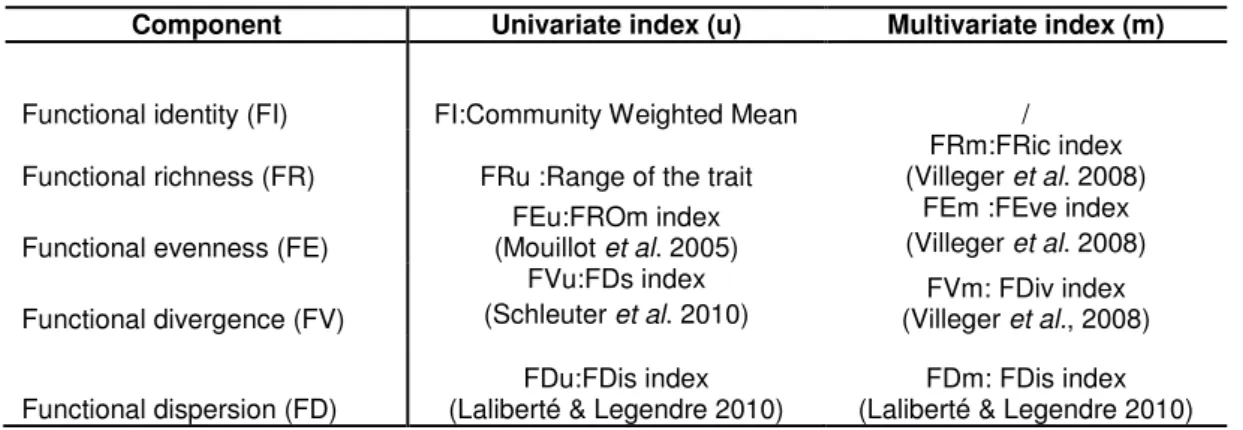
D. The components of functional diversity and their indexes ... 168
E. Choice of functional traits for this study... 170
F. Specific leaf area (SLA) ... 170
G. Leaf Dry Matter Content (LDMC) ... 173
H. Leaf nitrogen content (LNC) ... 174
I. Flowering date ... 176
J. Rooting depth (RD)... 177
K. Relative abundance of legumes ... 179
L. Relative abundance of entomophilous species ... 180
D. Results and Discussion ... 189 E. Acknowledgements ... 190 F. References ... 191
List of Figures Introduction
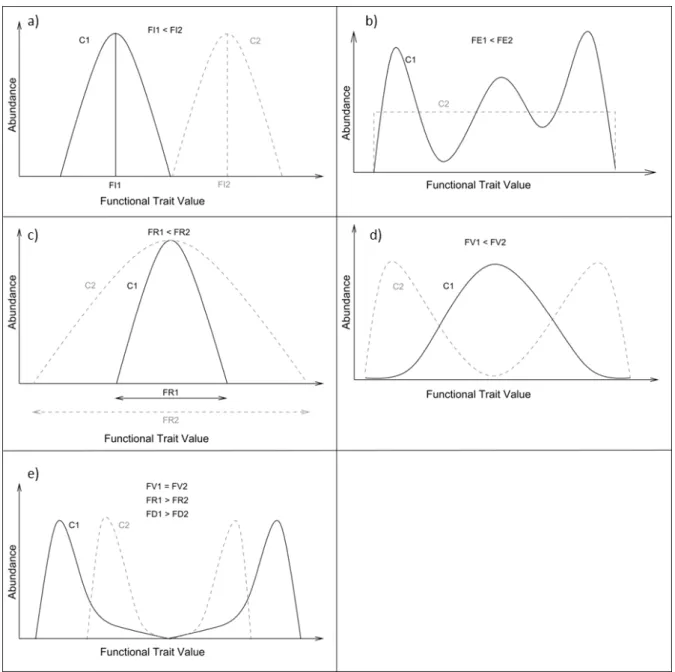
Figure1: Area under permanent grassland (light green) in most European countries (1995) (European Commission, 2008) ... 11 Figure.2: Relation between the number of species and the ecosystem functions. ... 16 Figure 3: Schematic illustration of the different components of functional diversity ... 18 Figure.4: Distribution of trait–service relationship information by ecosystem processes
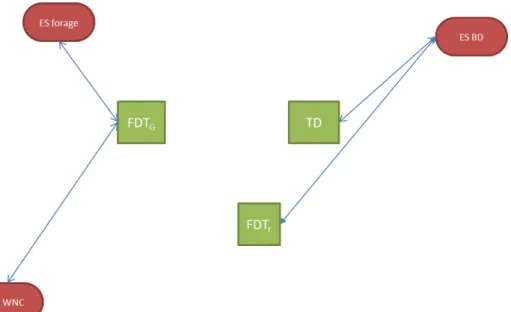
assessed.. ... 19 Figure 5: Conceptual schema based on hypotheses on the relationships between ecosystem
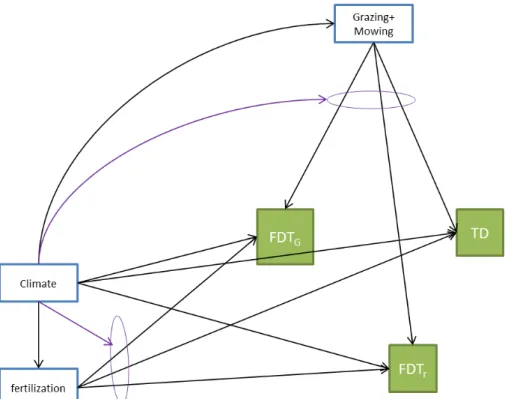
services and functional diversity. ... 20 Figure 6: Conceptual schema based on hypotheses on the effect of climate and management
on functional diversity. ... 23 Figure.7: Conceptual model of the hypothesis on the relationships between ecosystem services,
functional diversity, management and climate. ... 24 Chapter1
Figure1. 1 List of ecosystem services for agroecosystems adapted from le Roux et al.,(2008). 27 Figure1.2: Modification of the conceptual model regarding the outcome of the first chapter. .... 34 Figure.1.3: Conceptual model of carbon cycle in grassland used during the interview. ... 36 Figure.1.4: Conceptual model of nitrogen cycle in grassland used during the interview. ... 36 Figure.1.5 : Conceptual model of water cycle in grassland used during the interview. ... 37 Chapter 2
Figure2. 1: Schematic illustration of the different components of Functional Diversity used for the calculations. ... 49 Figure2. 2: Effect of intraspecific variability on the R Pearson coefficient between functional
diversity indexes before and after computation of intraspecific variability on the plant grassland community (CR3 type) with a convergence pattern.. ... 57 Figure2. 3: The three points to check before the use of a functional trait database.. ... 67 Figure2. 4: General procedure of estimation of errors for the imputation of missing data. ... 71 Figure2. 5: Evolution of the MRdAE of 5 imputation methods in the herbaceous sub-database
with different percentages of missing data for 8 traits ... 75 Figure2. 6: General procedure for the assessment of the effects of the imputation methods for
the calculation of functional diversity indices. ... 80 Figure2. 7 Effect of percentage of missing data on the R Pearson coefficient between functional diversity indices calculated without missing data and with imputed data ... 84 Figure.2.8: Effect of deletion of species on the R Pearson coefficient between Functional
diversity indexes before and after the deletion of species. ... 89 Figure2. 9: Evolution of selected biodiversity criteria with sampling area for 5 grasslands. ... 93 Chapter 3
Figure.3.1: Cumulative distribution of a set of functional diversity criteria in the three datasets: ... 100 Figure.3.2: Cumulative distribution of functional diversity criteria in the three datasets ... 101 Figure.3.3: Distribution of the climatic variables.. ... 105
Figure.3.5:a) Principal component analysis on the different management and climatic variables. b)Dendrogram issue of agglomerative nesting using the Ward method on the MIC
dissimilarity ... 112
Figure3. 6: Different structural equation model tested. ... 117
Figure3. 7: PCA on the climatic and management variables ... 118
Figure.3.8: Importance of the different variables of management and climate. ... 124
Figure.3.9: Regression trees on biodiversity variables from management and climate variables . ... 125
Figure.3.10: Difference in term of management between the different leaves of the regression trees.. ... 126
Figure3.11: Conceptual schema based on results on the effect of climate and management on functional diversity. ... 132
Figure3. 12: Conceptual schema based with new hypothesis after the results of the effect of climate and management on functional diversity. ... 133
Figure.3.13: Relationships between the biodiversity criteria from the dataset , the predicted from the SEM and the predicted from the random forest. ... 134
Figure.3.14: Relationships between the biodiversity criteria on the dataset (real one), the predicted from the SEM and the predicted from the random forest.. ... 135
Figure.3.15: 3D representation of the intensity latent variable from the Structural equation model, climate latent variables from SEM and the number of species. ... 136
Figure.3.16: 3D representation of the intensity latent variable from the Structural equation model, climate latent variables from SEM and the functional identity of SLA.. ... 137
General Discussion FigureD.1 Conceptual schema based on new hypothesis, following the results of the effects of climate and management on functional diversity. ... 141
List of Table
Chapter 1 Table.1.1: Ecosystem Services selected ... 28Table.1 2 Ecosystem: services and their measurements ... 29
Table.1.3: List of the experts interviewed for the selection of functional diversity criteria with their organization and the services of their expertise. ... 32
Table.1 4: List of Functional diversity criteria, their description, abbreviation and the number of processes, for which the criterion has been identified as strongly relevant. ... 35
Table 1.5: Relationships between functional diversity criteria and the ecosystem process/ state linked to the carbon sequestration. ... 38
Table 1 6: Relationships between functional diversity criteria and the ecosystem process/ state linked to nitrogen fertility.. ... 39
Table.1.7: Relationships between functional diversity criteria and the ecosystem process/ state linked to dryness resistance. ... 40 Table.1.8: Relationships between functional diversity criteria and the ecosystem process/ state
Table.1.11: Relationships between functional diversity criteria and the ecosystem process/ state
linked forage services.. ... 44
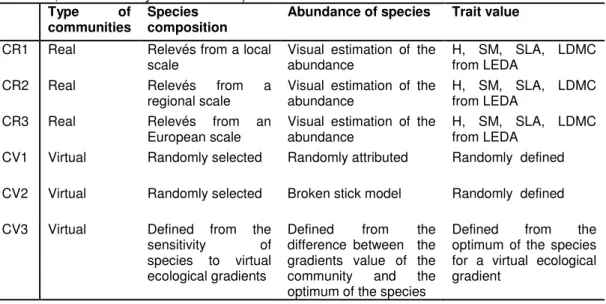
Chapter 2 Table 2. 1: Types of communities used for the simulation ... 54
Table 2. 2: Functional diversity indexes used and their abbreviations... 55
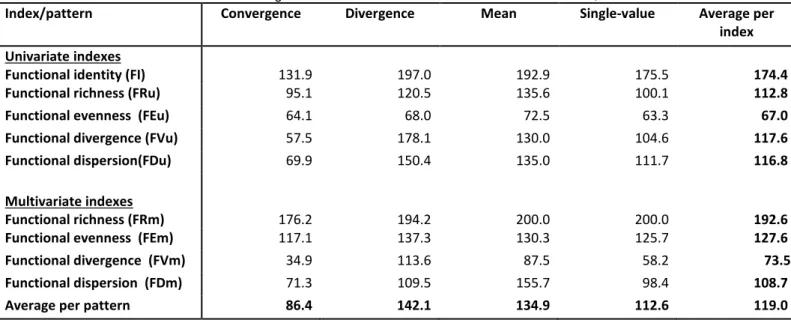
Table 2. 3: Average robustness threshold of each index per pattern of ITV. . ... 59
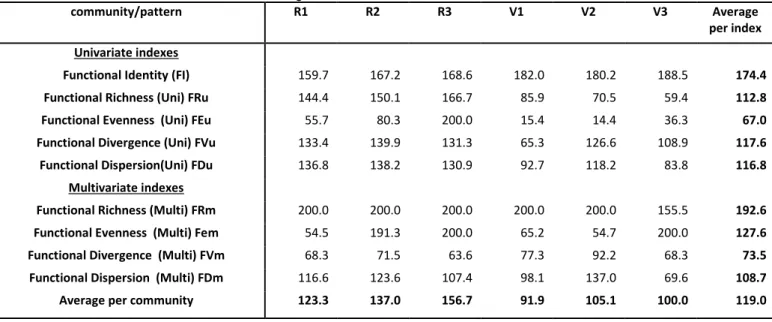
Table 2. 4: Average robustness threshold of each index per type of community.. ... 60
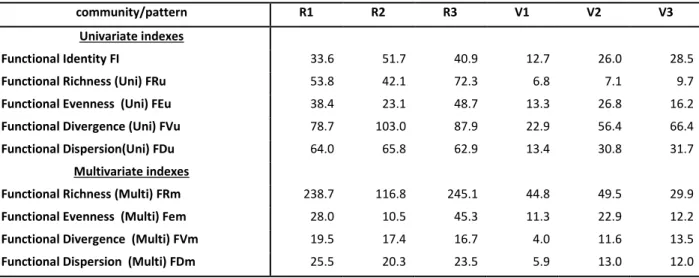
Table 2. 5. Average coefficient variation for robustness threshold of each index per pattern of ITV. ... 61
Table 2.6: MRdAE(median relative absolute error) for each imputation method in the two sub-databases, averaged over all percentages of missing data (1 to 46%). ... 76
Table 2.7 Effect of percentage of missing data on the MRdAE (median relative absolute error) for the four methods applied to the two sub-databases.. ... 77
Table 2.8 :Percentage of missing data at which the p-value of the correlation between the ranking of the communities calculated without missing data and with imputed data became not significant for 5 of the 100 sets of communities. ... 83
Table.2.9 Functional diversity indexes used ... 87
Table.2.10: Abundance threshold to the deletion of less abundant species for the different indexes of functional diversity. ... 90
Table 2.11: Relationships between area and biodiversity ... 92
Table.2.12: Level of confidence on the calculation of the different criteria of vegetation for the different error tested in this chapter. ... 95
Chapter 3 Table.3.1: List of the functional diversity criteria studied with the distribution of their values in the datasets ... 102
Table.3.2: Proportion of the different type of yearly use in the different datasets in percentage ... 105
Table.3.3: Proportion of the type of first use in the different datasets in percentage ... 106
Table.3.4 Proportion of plots with 0, 1, 2 or 3 cuts per year in the different datasets in percentage ... 106
Table.3.5: Livestock coefficients by type of animals used to transform number of animals into livestock units. ... 107
Table3.6: Proportion of plots with 1, 2, 3 or 4 and more utilization per year in the different datasets in percentage ... 108
Table.3.7: Coefficients of quantity of nitrogen for the type of organic fertilization. ... 108
Table.3.8: Coefficients of quantity of nitrogen for the animal dejection per LU per days ... 109
Table.3.9: List of the different variables of management and climate used ... 110
Table.3.10: Scoring of the different analysis methods regarding their capacity to assess conditional effects, general trends, relationships between variables and prediction of the functional diversity criteria ... 114
Table.3.11: Results of the partition of variances for the CWMSLA, CWMLNC, CWMOFL and number of plant species criteria ... 119
Table.3.12: Standard estimates of the model 2 and model 4 for the four diversity criteria. For the abbreviation see Table 3.9 . ... 121
Table.D.1 Scoring (out of 5) of the accuracy of the different services regarding the errors at the different levels for different criteria and process ... 144
Acknowledgements
I would like to thank:My two supervisors: Sylvain Plantureux and Olivier Huguenin-Elie
The four different members of my monitoring PhD committee: Bertrand Dumont, Pascal Vittoz, Bernard Jeangros and Frédérique Louault
The different examiners of my PhD committee; Andreas Lüscher, John Finn, Daniel Magda, Johannes Isselstein and David Mouillot
The different colleagues who help me during the PhD, Bernard Amiaud, Knut Hovstad, Jean Villerd, Manuel Schneider and Gilles Martel
For their works the students I supervised: Marine Benoiste, Tiphaine Audic, Lucie Sempé and Cécile Domenicone
The different partners of MULTISWARD for their feedback and for the funding of my work
The different people who read and corrected my different productions: Didier, Louise, Caroline and Olivier
All the experts to all the experts who participate in this work
All my PhD and Post doc colleagues for the good ambiance: in particular Aline, Nicolas, Abdelhak, Célia ,Sissi, Mathilde , Guilhem, Estelle, Flore, Charles, Sandro, Rosalinde, Sebastien , Dani , Carsten, Hermel , Nina and Barbel,
Also the members of the two teams of LAE and ART: especially Nadia, Béatrice, Françoise, Séverine, Sophie, Romain, Alex, Thamara, Dani, Andy, Matthias and Philippe
The different master students in passage in the two team especially Béatrice, Nicolas, Claire, Anne, Faline, Kev, Thibaud, Renaud, Marie Line, Ellena, Mathilde, Elise and Quentin.
The different members of the Jeunes Ecologistes and EELV for my militating time during this work especially Vincent, Thomas, Damien and Marine
The musical support of the Going Quantum podcast and the BBC essential mix To finish to all I forgot
Résumé élargi en français de la thèse
A. Introduction
Les services écosystémiques sont les services rendus par les écosystèmes à l‘humanité qu‘ils soient ou non d‘ordre économique. De très nombreuses recherches portent sur la fourniture des services écosystémiques. Celle-ci est cependant menacée par la dégradation des écosystèmes par l‘humanité. Les activités humaines par ses émissions de gaz à effet de serre est responsable du changement climatique. Ce changement climatique a un fort impact sur le fonctionnement des écosystèmes. L‘activité humaine est aussi responsable de la diminution de la biodiversité (extinction d‘espèces ou homogénéisation des écosystèmes). La préservation de la fourniture des services écosystémiques est un enjeu majeur pour l‘humanité. Différentes incitations ont été mises en place pour préserver et augmenter la fourniture de services écosystémiques. Pour les écosystèmes anthropisés, ces incitations sont sous la forme de subventions ou de labels.
Parmi les écosystèmes anthropisés, les prairies permanentes sont sans doute l‘écosystème le plus important en termes de surface en Europe. De plus, les prairies permanentes apportent une grande diversité de services écosystémiques tels que la production de fourrage, la conservation de la biodiversité ou la séquestration de carbone. La fourniture en services écosystémiques varie entre les prairies permanentes. Il serait important de pouvoir évaluer les différences de provision de services écosystémiques.
La diversité fonctionnelle végétale pourrait être un bon indicateur de la fourniture des services écosystémiques des prairies permanentes. La diversité fonctionnelle peut être définie comme l‘ensemble des valeurs de traits fonctionnels d‘une communauté. Les traits fonctionnels sont des caractéristiques mesurables d‘un individu qui sont reliées aux performances de cet individu. De nombreuses études ont montré un lien entre diversité fonctionnelle et de nombreux services écosystémiques pour les prairies permanentes. Dans certaines études, la diversité fonctionnelle a déjà été utilisée comme indicateur des services écosystémiques. Cependant l‘utilisation de la diversité fonctionnelle a certaines limites. La mesure de la diversité fonctionnelle est laborieuse et donc une évaluation rapide et avec une large échelle spatiale est impossible. De plus dans les prairies permanentes, la diversité fonctionnelle n‘est pas directement gérée par les éleveurs seulement influencé indirectement à l‘opposition des prairies semées (temporaire).
Il serait intéressant de pouvoir développer une méthode pour estimer la diversité fonctionnelle à partir d‘autres facteurs comme la gestion et le climat. En effet ces deux facteurs ont une influence sur la diversité fonctionnelle végétale. De plus selon certaines études, les effets de la gestion sont différents selon les conditions climatiques. Les connaissances actuelles sur l‘effet du climat et de la gestion sur la diversité fonctionnelle ne sont pas suffisantes pour permettre une estimation de la diversité fonctionnelle. En effet, les effets d‘interactions entre le climat et la gestion n‘ont été que peu étudiés. De plus, les variables de la diversité fonctionnelle liées aux services écosystémiques ne sont pas forcément les variables pour lesquelles les effets du climat et de la gestion sont les mieux connues. Peu d‘études ont évalué la qualité de l‘estimation de la diversité fonctionnelle à partir de la gestion et du climat.
Dans un second temps, nous avons testé les effets de la gestion et du climat sur les critères de diversité fonctionnelle sélectionnés.
Nous ne disposions pas d‘estimations quantifiées du niveau de fourniture des services écosystémiques rendus par les prairies. Nous avons donc effectué la sélection des critères de diversité fonctionnelle en se basant sur la littérature et sur les expertises de chercheurs en écologie et en agronomie. Pour tester l‘effet de la gestion et du climat, nous avons utilisé 3 jeux de données déjà obtenus provenant de différentes régions en France et en Suisse et contenant des informations sur le climat, la gestion et des relevés botaniques. Afin de calculer la diversité fonctionnelle, nous avons combiné les relevés botaniques et des bases de traits fonctionnelles.
Le manuscrit est séparé en trois chapitres : Le premier chapitre porte sur la méthode de sélection des critères de diversité fonctionnelle liés aux services écosystémiques des prairies permanentes. Le second chapitre porte sur différentes études des imprécisions dues à l‘utilisation de bases de traits fonctionnels. Le dernier chapitre porte sur les effets du climat et de la gestion sur la diversité fonctionnelle.
B. Première partie : Sélection de critères de diversité fonctionnelle
reliés aux services écosystémiques des prairies permanentes.
L‘objectif de cette partie était de sélectionner des critères de diversité fonctionnelle reliés à des services écosystémiques. La première étape fut de choisir les services écosystémiques d‘étude. Nous sommes partis d‘une liste de services écosystémiques proposée pour les agro-ecosystèmes. Nous n‘avons gardé que les services pertinents pour les prairies permanentes et qui seraient reliés avec la diversité fonctionnelle. Nous avons finalement sélectionné huit services écosystémiques (quantité et qualité de fourrage produits, stabilité des caractéristiques fourragères durant l‘année, séquestration de carbone, fertilité azotée du sol, résistance à la sécheresse, pollinisation et conservation de la biodiversité).
Nous avons choisi des variables permettant d‘évaluer chaque service. Nous avons ensuite identifié les processus écosystémiques impliqués dans la réalisation de ces services. Nous avons ensuite fait des entretiens avec des experts et une revue de la littérature pour trouver des critères de diversité fonctionnelle reliée à ces processus écosystémiques. Au final, vingt-neuf critères de diversité fonctionnelle ont été sélectionnés permettant d‘évaluer huit services écosystémiques. Parmi ces vingt-neuf critères, dix était des pourcentages d‘abondance relative de certains groupes de plantes (comme le pourcentage de légumineuses) et dix autres étaient calculés à l‘aide de traits fonctionnels et d‘indice de diversité fonctionnelle.
C. Deuxième partie
: estimation des imprécisions dues à l‘utilisation
des bases de traits fonctionnels et de relevés botaniques.
L‘objectif de cette partie était d‘évaluer différentes erreurs liées à l‘utilisation d‘une base de traits fonctionnels et des relevés botaniques à la place de
l‘importance des données manquantes dans le calcul de la diversité fonctionnelle. Nous avons d‘abord évalué l‘effet des données manquantes au niveau des espèces. Nous avons pour cela utilisé environ un millier d‘espèces pour lesquelles aucune valeur ne manquait pour neuf traits fonctionnels. Nous avons ensuite supprimé aléatoirement certaines valeurs de traits et ainsi créé une série de bases de traits avec une proportion croissante de données manquantes. Différentes méthodes d‘imputation ont ensuite été utilisées pour remplacer les données manquantes par des valeurs estimées: certaines très simples (remplacement par la moyenne ou la médiane des valeurs existantes), d‘autres reposant sur des hypothèses écologiques (similarité fonctionnelle entre espèces ou corrélation entre les traits) et une méthode complexe basée sur une série de différentes imputations (multiples imputations en chaine). Nous avons ensuite comparé les valeurs de traits d‘origine (avant la délétion des valeurs) et les valeurs de traits après les imputations afin d‘évaluer la qualité du remplacement.
Parmi les méthodes d‘imputation, les méthodes basées sur des hypothèses écologiques (relations entre les traits et proximité fonctionnelle entre les espèces) et la méthode d‘imputation en chaine d‘équation donnaient de meilleurs remplacements des données manquantes que les méthodes mathématiques simples. Le niveau d‘erreur induit par les données manquantes dépendait de la distribution des valeurs de traits dans la base de traits. Plus la distribution des traits fonctionnels était normale plus la qualité du remplacement était bonne. Nous avons ensuite testé les effets des données manquantes et des méthodes d‘imputation sur le calcul d‘indices de diversité fonctionnelle. Pour cela nous avons utilisé un jeu de 700 relevés. Nous avons créé une base de traits avec les espèces présentes dans ces relevés. Afin d‘avoir une base de traits sans données manquantes, nous avons fait une première imputation. Sur cette base de traits, nous avons effacé un pourcentage variable de valeurs de traits puis remplacé ces données manquantes avec différentes méthodes d‘imputations. Différents indices de diversité fonctionnelles ont été calculés avec la base de traits sans données manquantes et les différents bases de traits avec des données manquantes imputées. Nous avons ensuite comparé ces deux types d‘indices. En choisissant la bonne méthode d‘imputation, la majorité des critères de diversité fonctionnelle peuvent être calculés avec 30% de données manquantes.
Dans les bases de traits fonctionnels, pas plus d‘une valeur par trait est en général présente. Cependant, les traits fonctionnels peuvent varier fortement au sien d‘une espèce. Cette variabilité intraspécifique ne peut donc pas être prise en compte lors de l‘utilisation de la base de traits. Nous avons donc fait des simulations pour quantifier les effets de la variabilité intraspécifique sur le calcul de la diversité fonctionnelle. Pour cela nous avons utilisé 6 différents types de communautés (3 virtuelles et 3 jeux de communautés de prairies permanentes à des échelles spatiales différentes). Nous avons inséré virtuellement de la variabilité intraspécifique suivant 4 méthodes différentes (la valeur du trait dans la base est la moyenne du trait pour l‘espèce, la valeur de trait n‘est pas la moyenne du trait pour l‘espèce, le trait de l‘espèce varie de la même façon que le trait moyen de la communauté et le trait varie à l‘opposé du trait moyen de la communauté). La variabilité a été insérée avec différentes amplitudes de 1% à 200%. Les critères de diversité calculés avec la variabilité intraspécifique ont été comparés avec les critères de diversité calculés sans variabilité intraspécifique. Sur l‘ensemble des simulations certains critères étaient très affectés par la variabilité intraspécifique, d‘autres moins. De ces résultats, nous avons pu établir
d‘une espèce), si le trait au sein d‘un espèce varie dans le même sens que le trait moyen de la communauté le long d‘un gradient, le critère est moins robuste à la variabilité intraspécifique. (3) il faut évaluer l‘amplitude de la variabilité intraspécifique du trait, plus le trait est variable moins le critère est robuste à la variabilité intraspécifique.
Une autre problématique avec l‘utilisation combinée des bases de traits et de relevés botaniques est la présence d‘espèces dans les relevés botaniques qui ne sont pas présents dans la base de traits (espèces non identifiées, espèces seulement présentes aux stades juvéniles dans les prairies comme les arbres, etc). Ces espèces non présentes dans les bases de traits peuvent avoir une abondance relativement importante et induire une erreur. Nous avons donc évalué quelle quantité de l‘abondance dans un relevé peut être supprimée sans trop influencer le calcul de la diversité fonctionnelle. Pour cela, nous avons progressivement supprimé les espèces peu abondantes dans des relevés botaniques et comparé les indices de diversité fonctionnelle calculés sur ces relevés avec suppression et les relevés d‘origines.
La dernière problématique que nous avons étudiée concernait les différences de protocoles. En fait dans les jeux de données que nous avons utilisés les protocoles de relevés botaniques différents en particulier en termes de surfaces de relevés. Nous avons effectué sur 16 prairies permanentes des relevés botaniques sur neuf surfaces différentes. Nous avons ensuite étudié les relations entre la diversité fonctionnelle et la surface de relevés botaniques afin de proposer des méthodes de correction et d‘évaluer les erreurs dues aux différences de surfaces de relevés.
A partir de ces quatre études, nous avons proposé un niveau de précision de l‘estimation de chacun des vingt-neuf critères de diversité fonctionnelle. Ce niveau de précision ne sera pas utilisé pour éliminer certains des critères de diversité fonctionnelle mais uniquement pour mieux comprendre les résultats de l‘effet de la gestion et du climat sur la diversité fonctionnelle.
D. Troisième partie : Effets de la gestion et du climat sur la diversité
végétale fonctionnelle des prairies permanents.
L‘objectif de cette partie était de tester les effets de la gestion et du climat sur la diversité fonctionnelle végétale des prairies permanentes. Pour cela nous avons combiné 3 jeux de données existants. Le premier contenait les informations pour 140 prairies dans différentes régions de France (issu du travail sur la typologie nationale des prairies permanentes). Le second contenait 70 prairies du massif vosgien (issu du travail sur la typologie des prairies permanentes du massif vosgien). Le dernier contenait des informations pour 229 prairies dans deux régions des Alpes suisses. Les vingt-neuf critères de diversité fonctionnelle sélectionnés dans la première partie furent calculés à l‘aide des bases de traits LEDA, TRY et Eflorasys. Dix-neuf variables de gestion et du climat ont été calculées sur l‘ensemble des prairies. Six variables climatiques : l‘altitude, la température moyenne entre avril et octobre, la température moyenne entre octobre et avril, la somme des précipitations pendant l‘année, la somme des précipitations en été et une estimation de la production d‘herbe potentielle. Huit variables décrivant l‘utilisation de l‘herbe : le type d‘utilisation annuelle
température à la date de la première utilisation. Et pour finir trois variables décrivant les apports en azote (minéral, organique et totaux).
Nous avons testé les corrélations entre ces variables. Les variables climatiques et celle de la période de première utilisation étaient fortement corrélées. Les variables d‘utilisation étaient corrélées entre elles, ainsi que les variables de fertilisation. Le lien entre les variables de climat et celles d‘utilisation-fertilisation était faible. Ces différents variables étaient très variables sur l‘ensemble du jeu de données.
La première étape de notre analyse était d‘identifier des tendances générales sur l‘ensemble du jeu de données. La première étape fut de regarder les corrélations entre les 19 variables de gestion et du climat et les 29 critères de diversité fonctionnelles. Nous avons trouvé certaines tendances dans notre jeu de données. Par exemple, le nombre d‘espèces végétales augmente avec l‘altitude à l‘inverse du trait agrégé de la teneur en azote des feuilles. Les mêmes tendances furent observées avec la date de première utilisation. Cependant ces résultats sont difficiles à interpréter en raison des fortes interrelations entre les variables climatiques et de gestion. Pour cela nous avons effectué une partition de variances pour voir l‘importance des interrelations entre les variables de climat et de gestion. L‘interrelation entre les quatre groupes de variables avait un fort pouvoir explicatif sur les critères de diversité fonctionnelle. Afin de pouvoir décorréler les effets des différents variables, nous avons utilisé des modèles d‘équations structurelles. Nous avons testé différentes hypothèses de relations entre les différentes variables de climat, de gestion et de diversité fonctionnelle. Avec les modèles d‘équations structurelles, nous avons pu séparer les effets de certains des effets du climat et de gestion. Cependant les modèles d‘équations structurelles n‘étaient pas suffisamment ajustées pour être totalement interprétés.
Nous avons aussi testé la présence d‘effets conditionnels (l‘effet d‘une variable conditionnelle des valeurs d‘une autre variable; interaction). Pour cela nous avons utilisé des analyses de la famille des arbres de régression. Nous avons d‘abord utilisé une forêt de Breiman pour identifier les importantes variables de climat et de gestion. Le climat avait généralement plus d‘importance dans l‘estimation des critères de diversité fonctionnelle que la gestion. Parmi les variables de gestion, les variables d‘intensité de gestion comme l‘index d‘utilisation de l‘herbe avaient plus d‘importance que les variables de types de gestion comme le type d‘utilisation dans l‘année. Nous avons ensuite construit des arbres de régression à partir des variables importantes identifiées par la forêt de Breiman. Ces arbres nous ont permis d‘identifier des effets conditionnels. Par exemple, pour les prairies avec un hiver doux, nous n‘avons pas trouvé d‘effets de gestion sur certains critères de diversité fonctionnelle comme le nombre d‘espèces végétales ou le trait agrégé de la teneur en azote des feuilles. L‘estimation des critères de diversité fonctionnelle était meilleure lorsque les effets conditionnels étaient pris en compte. Certains des vingt-neuf critères de diversité fonctionnelle étaient très bien expliqués par les variables de gestion et de climat (nombre d‘espèces végétales, trait agrégé de la teneur en azote des feuilles, de la date de floraison et la surface spécifique foliaire). D‘autres critères étaient très mal expliqués par le climat et la gestion comme le trait agrégé de la hauteur végétative ou la teneur en matière sèche des feuilles.
l‘expertise et de la littérature. Ces informations pourraient être utilisées pour construire de véritables outils d‘évaluation des services écosystémiques utilisant la diversité fonctionnelle. Nous avons aussi montré que certains de ces critères de diversité fonctionnelle pouvaient difficilement être calculés à partir de bases de traits fonctionnels. Si outils d‘évaluation de services écosystémiques étaient disponibles, les résultats issus de notre travail sur les effets de la gestion et du climat sur la diversité fonctionnelle pourraient être utilisés pour estimer cette diversité fonctionnelle.
Nous avons en effet trouvé que certain de ces critères était fortement influencés par le climat et la gestion des prairies permanentes. Ces critères estimés pourraient être ensuite utilisés dans les outils d‘évaluation des services écosystémiques (une évaluation en deux étapes).
Introduction
I.
Ecosystems as a source of human well-being
A. Benefits that the ecosystems provide for mankind
Ecosystems provide various benefits for mankind and contribute to the human well-being. Human well-being can be considered as an unifying concept of the objective and subjective factors which constitute health and quality of life (Sarvimäki, 2006). Ecosystem benefits can be directly economic such as the sale of agricultural goods. Ecosystems benefits are also environmental benefits such as climate regulation or biodiversity conservation. These benefits have an economic impact but this impact is difficult to appraise (Fisher et al., 2011). Some ecosystem benefits have no direct commercial value such as esthetic and ethical benefits.
Ecosystem services are the ecosystem's characteristics used to realize the ecosystem benefits. Ecosystem benefits are obtained by the interaction between human beings and ecosystem services (Boyd and Banzhal, 2007). A benefit may rely on several ecosystem services. The term ―ecosystem services‖ was much popularized by the Millennium Ecosystem Assessment (MEA, 2003). The term ―ecosystem services‖ is now used in a lot of publications especially in economy and in ecology (8 111 publications with the term ecosystem services in the web of science in May 2013) and a new journal named ―Ecosystem services‖ was created recently (http://www.journals.elsevier.com/ecosystem-services/). The importance taken by the ecosystem services in research and in our society is due to the consequences of the strong degradations of ecosystems under human impact. These degradations induce a loss of ecosystem services and so of ecosystem benefits
B. Human impact on ecosystems
Human activities have several impacts on ecosystem functioning (Vitousek, 1997). These impacts are direct by replacing of native and complex ecosystems by simpler ecosystems (Foley et al., 2005), or indirect by changing the environmental conditions. In example, human activities induce an increase of greenhouse gases (CO2, CH4 …) in
the atmosphere with different consequences on ecosystems like climate change. Modification of the climate has a strong impact on the ecosystems (Vitousek, 1997). Another strong impact of human activities on ecosystem is the loss of biodiversity (Sala et al., 2000). This biodiversity loss comprises two different aspects. The first aspect is the extinction of species at the global scale. Under the human influence, the current extinction rate is 100 to 1000 times higher than in the general dynamic of biodiversity (Pimm et al., 1995). The second aspect is the simplification of ecosystems (less species inside an ecosystem) and biotic homogenization (difference of species between ecosystems becoming less important) (McKinney and Lockwood, 1999). It was suggested that a more diverse ecosystem in term of species provides more ecosystem services (Grime, 1998; Hector et al., 1999; Yachi and Loreau, 1999; Lehman and Tilman, 2000; Loreau, 2000, 2003; Hooper et al., 2005; Diaz et al., 2007a).
The preservation of the delivery of ecosystem services has to be one major goal for humanity during the current century. Measures are necessary to protect or/and to improve the provision of ecosystem services.
these protections. Nature reserves are in concurrence with other human activities and so generally restrained to very small areas. This strategy of strict conservation cannot be the only way to protect or improve the global provision of ecosystem services (Gomez-Baggethun and Perez, 2011). Ecosystems managed by humans also provide ecosystem services (Costanza et al., 1998). Managed ecosystems are agro-ecosystems, managed forests and aquatic ecosystems with fisheries or aquaculture. For these ecosystems, regulation goals have to favor management systems that induce ecosystem services.
The first way to improve the provision of ecosystem services is regulations in form of restriction. In several countries, some restrictions in the management of these ecosystems are imposed by law. One example is the limitation of fertilization in the area close to aquatic elements in EU (Directive91/676/CEE, 1991).
States also propose incentives in the form of subventions. Subventions are generally linked to management specifications that are supposed to produce more ecosystem services (late utilization of the grassland, presence of agro-ecological infrastructure).
The economic market also exerts incentives. Certification is a way for the consumer to recognize "ecosystem services friendly” products. A large number of labels exist with different specifications. Another option is to directly link the user of ecosystem services to the ―manager‖ of the ecosystem. Users provide payment to the ecosystem managers in return of some obligations on their management (Pagiola, 2008).
These different incentives could be useful for the maintenance of ecosystem services. To be efficient, the provision of ecosystem services has to be valued and quantified. Economic valuation of ecosystem services relies on different aspects (Fisher et al., 2011) (Sanchrico and Springborn, 2010). The second aspect is the quantification of the provision of ecosystem services and the understanding of its drivers (climate, management…). Quantification methods have to be proposed for all types of ecosystem.
Grassland is the most important managed ecosystem in term of surface (around 40 percent of terrestrial surface of the Earth) (Pedro Silva et al., 2008) and is also important in term of quantity and diversity of ecosystem services it provides.
II.
Grassland: an important but threatened provider of ecosystem
services in Europe
A. Definition of grassland
Grasslands are ―lands covered by herbaceous plants with less than 10 percent of tree and shrub cover‖ (UNESCO). Grasslands are generally managed for forage production. Several classifications of the grasslands can be made regarding the type of use (pasture and meadow) or the intensity of human influences (temporary grassland, semi-natural or natural grassland …). The most common distinction is made regarding the time during two renovations of the vegetal cover (reseeding). Temporary grasslands are regularly reseeded and generally inserted in a crop rotation. On the contrary, permanent grasslands last for several years without being reseeded and are not inserted in a crop rotation. However, the difference made between permanent
Introduction
B. State and dynamics of grassland in Europe
In the European Union (27 countries), permanent grassland represents 57 million ha (de Viellegher and Van Gils, 2010). It corresponds to 13% of the total surface and 33% of the agricultural surface. Percentage of permanent grassland is very different between countries. The permanent grassland represents more than half of the agricultural surface in some European countries (in and outside EU). For other countries, this percentage is very low (Finland 1%, Greece 7%, and Denmark 9%). The temporary grassland represents 9.7 million ha. From a geographical point of view (Figure.1), the permanent grassland is present close to the ocean (Ireland, Netherlands, North West of France), in these regions, grass productivity is high (de Viellegher and Van Gils, 2010). Permanent grasslands are also found in mountain areas such as the Alpine regions. In these regions, permanent grassland is the only sustainable type of agriculture because of the harsh climatic conditions and the difficult topography for mechanization (de Viellegher and Van Gils, 2010).
Figure1: Area under permanent grassland (light green) in most European countries (1995) (European Commission, 2008)
Between 1967 and 2007, 7 million ha of grassland disappeared in the EU-6 (Belgium, France, Germany, Netherlands, Italy and Luxembourg). This decrease can be explained by the increasing use of high yield forage crops like maize or
In mountain areas, unproductive grasslands are abandoned and naturally transformed into forests. The transformation of agricultural land into urban and constructed areas also contributed to the decrease of grassland area.
However, this decrease has stopped since 2003. The enforcement of new policies with some incentives to maintain grasslands is one reason to this stop. But the increase of the price of the cereals may induce transformation of grasslands into crops. The decrease of grassland areas may have a consequence on the whole society by decreasing the provision of ecosystem services from grasslands.
C. Grassland ecosystem services
1. Forage services:
For farmers, forage production is the main service of the grassland area, as it provides a direct economic benefit. In order to harvest this forage production, the grassland can be directly grazed or cut to stock forage for the winter (and sometimes for the summer). Productivity of grassland is very heterogeneous depending on agricultural management, pedo-climatic conditions and botanical composition (Jeangros et al., 1994). Permanent grasslands are generally less productive than other forage crops. However, some permanent grasslands reach the productivity of temporary grasslands (Delaby et al., 1996; Launay et al., 2011). The quantity of forage production is not the only factor describing forage production. The timing of biomass production is also important, especially at the farm scale. In the case where all the plots have to be harvested at the same time, the workload would be high and forage would be lost. Possibility of grazing during the summer is also important. Absence of grass production during dry periods in summer would oblige farmers to use stored forage. Forage quality is also an important aspect of forage production. Forage quality is generally described by the nutrient content (energy, protein, …) and the digestibility of the forage (Baumont et al., 2012). The quality of animal products (cheese, meat…) can be linked to the presence of some plant species in the grassland (Farruggia et al., 2008). Some cheeses can only be produced with some type of forage to maintain the quality and the typicality of the product like the "Comté" (Décret n°2007-822, 2007) .
2. Environmental services:
Water quality depends of the load of pesticides and nutrients entering the ground and surface waters by leaching or runoff. For grasslands, the utilization of pesticides is very low in comparison to other crops (Raison et al., 2008). Grasslands also have a limiting effect on phosphorus leaching (Le Gall et al., 2009) and the leaching of nitrates is very low on extensively managed grasslands (Vertes et al., 2010; Peyraud et al., 2012a), and only occurs for high rates of nitrogen fertilization (more than 150 N.ha-1.year-1).
Permanent grasslands are very important in terms of carbon sequestration. They can be a sink for carbon, and a sequestration 0.5 to 0.7 t of C ha-1 year-1 has been
reported (Peeters and Hopkins, 2010).
The presence of vegetal cover during the whole year induces low erosion. The loss of soil by erosion is much less under a grassland that under a crop culture (0.3 versus 3.6 t ha-1year-1) (Cerdan et al., 2010).
Introduction
3. Biodiversity conservation and tourism/esthetic value:
Grasslands have a higher biodiversity in comparison to forage crops. First, the plant biodiversity of grassland is high, especially for the old permanent grasslands. The intercommunity diversity (β diversity) is also very high: more than thousand species were found in grassland botanical surveys conducted in West Europe (Plantureux and Amiaud 2010). Grassland can also contain endangered plant species. The grassland procures a habitat for a wide range of animal taxa. Some of them are only found in grassland communities (Isselstein et al., 2005). A lot of birds and butterflies species depend on grassland habitats (Sanderson et al., 2008; Bruckmann et al., 2010).
Grasslands create typical landscapes. They are considered the society as more natural than crops and are generally preferred in terms of esthetic (Bugalho and Abreu, 2008). In some regions, the presence of grasslands is a key point for the tourism (Mountain area, ―bocage‖, and wetland). Finally tourism is often associated with local typical products produced on grassland (cheese and meat).
Grasslands thus provide a large set of ecosystem services. This multi-provision of ecosystem services is called multifunctionality (Le Goffe, 2001). The value of the ecosystem services provided by a grassland was estimated at 600 € ha-1
(Chevassus-au-Louis et al., 2009). However a large diversity of types of permanent grasslands exists (from the sea level to more than 2000 meters). Some of the previous services only depend on the presence of a vegetal cover while other rely on the vegetation characteristic and so would be very different between the different types of grasslands. To improve the assessment of the ecosystem services and propose new incentive schemes, the evaluation must therefore take this diversity of types of grasslands into account.
The numerous relationships found between the diversity of the vegetation (functional or taxonomical) and some ecosystem functions motivated some authors to propose the utilization of this diversity to assess ecosystem services.
The understanding and the evaluation of these different services would be a key issue to propose new subventions and so to maintain grassland. A FP7 project (MULTISWARD project) was financed by the EU to improve the knowledge on the effects of plant diversity on grassland multifunctionality and propose evaluation tools.
D. The Multisward project
The aim of the FP7 MULTISWARD research project (www.multisward.eu) is to support developments and innovations in grassland use and management in different European farming systems (including low-input and organic), pedo-climatic and socio-economic conditions.
MULTISWARD goals were to (i) enhance the role of grasslands at farm and landscape levels to produce environmental goods and to limit the erosion of biodiversity and (ii) to optimize economical, agronomical and nutritional advantages for the development of innovative and sustainable ruminant production systems. One objective of MULTISWARD is to assess ways of combining high production efficiency with optimal provision of regulating and supporting services from grasslands at farm to regional levels.
The first step to this evaluation is to quantify the provision of ecosystem services. The next part of the Introduction presents different possibilities to quantify ecosystem services. This PhD was funded by the project.
III.
Quantification of the ecosystem services
A. Direct quantification: ecosystem services and process measurements
The measurement of ecosystem services rely either on direct measurements of services or on estimations of the ecosystem processes and functions related to these services. The measurement of the processes and functions are useful to understand the effect of global changes on ecosystem functioning and then on ecosystem services. Examples of direct measurements of the production of goods, of services supported by the biogeochemical cycles and of biodiversity conservation are presented below.
1. Measurements of the production of goods
Production of goods may be directly quantified or estimated by the quantity of goods harvested. However, the harvest quantity is not always representative of the quantity of goods presents. For grasslands, the real quantity of forage produced can be underestimated in case of late harvest (senescent parts of plants not harvested). The estimation of the biomass production of grazed plots is also laborious.
Another difficulty is to compare the production of goods between different types of ecosystems, even for the good. It is hard to compare the production of a monoculture and a polyculture (intercropping and agroforestery for example). The use of only the harvest quantity of one species always under-evaluates the production of the polyculture. Indicators are proposed to assess the production of mix cultures like the land equivalent ratio (Mead and Willey, 1980). For grassland, if one species is harvested for other purposes (spices, medicinal herbs) this problem will occur between the evaluations of the forage production and the harvest of these species. Another way is to calculate the economic value of all the goods provided (Correia et al., 2010). The ecosystem services of goods production do not only concern the quantity of goods but also the quality of the goods produced. The quality may be evaluated by numerous indicators: some very objective (quantity of energy, content of some molecule, economics value…) and more subjective (taste, color, typicality …) (Warmke
et al., 1996; Kub ckov and Grosch, 1998).
2. Measurements of the ecosystem services linked to biogeochemical cycles Several ecosystem services rely on the biogeochemical cycles. Some of these ecosystem services can be directly measured, like carbon sequestration (increase in soil carbon) (Conant et al., 2001) or erosion (quantity of sediments in runoff water). Some other services can only be quantified by the measurement of the processes related to these services. The measurement of the processes/functions between atmosphere and the plant-soil complex are generally studied by the gaseous exchanges between these two pools (Goulden et al., 1996; Novick et al., 2004).
3. Measuring the ecosystem services linked to biodiversity conservation
Biodiversity cannot be measured as a whole. Indeed, biodiversity is the concept describing the diversity of all forms of life. It is always measured for only parts of its components and is often described by the number of plant species..
Measurements cannot be realized on all the different communities present in an ecosystem. Subsampling is generally used to quickly assess biodiversity, which
Introduction
necessary. Several authors propose that biodiversity can be used as an indicator of ecosystem services (see next paragraph).
B. Plant biodiversity as an indicator of ecosystem functioning and
ecosystem services
In ecology, a major assumption is that biodiversity supports of ecosystem services and positively affects the ecosystem functioning (Solbrig, 1991; Naeem et al., 1994).
1. Theoretical hypothesis beyond the positive effect of biodiversity on ecosystem functioning
Different mechanisms can explain this positive effect of biodiversity. The first mechanism is the complementary effect. With a high biodiversity, more ecological niches are present in the community. More ecological niches may induce a complementarity in term of resource uptake (Hooper, 1998). In more diverse communities, the number of different root systems is high and so the competition for the soil nutrients would be less important. Plant biomass and other processes may be higher. Secondly, with a higher biodiversity, the probability to have a species (or individuals) with a higher performance will be more important (Hector et al., 1999). A higher biodiversity may also increase the probability of positive effects between two species.
The last hypothesis is the insurance hypothesis (Yachi and Loreau, 1999; Mouquet et
al., 2002; Loreau, 2003). Highly diverse communities may be more able to resist
change. With more diversity, it is more likely to find a species adapting to the change. The diversity would thus allow maintaining the functioning of ecosystem in changed environnement condition.
2. Links between the number of species and the ecosystem functions
The first studies used the number of species as descriptor of biodiversity (Hector et
al., 1999; Roscher et al., 2005 ).
In the majority of the experimental studies, the number of species has a positive effect on the productivity of the ecosystem, on the resistance to invasion and globally on ecosystem functions. Positive effect is due for one part to the sampling effect and for another part to the complementarily effect (Hector et al., 1999). However
in natura, the productivity of ecosystem and the number of species is negatively
linked (Mittelbach et al., 2001). The same paradox was also found for the resistance to invasive species: the number of invasive species is higher in very diverse ecosystems (Naeem et al., 2000).
Regarding these opposite results, a global synthesis was performed (Hooper et al., 2005). The missing gap between these two types of observations was the effect of the environment on ecosystem functioning and on biodiversity. Indeed, the best environmental conditions for a high biomass production (fertility soil, disturbance regime) are also the worst environmental conditions for high specific richness. So the general trend between biodiversity and production is negative. However, in the same conditions, biodiversity may have a positive effect on the ecosystem functioning (Figure.3).
Figure.2: Relation between the number of species and the ecosystem functions. The black square represents community with the same environment. The values are only here as example.
A major limitation of the experiments on the links between the ecosystem function and biodiversity is the use of the number of species (Hurlbert, 1971). It supposed that the difference between two species in term of functioning is always the same between all the species. This major assumption may be one of the reasons of the low power of explanation of the relationships between biodiversity and ecosystem functioning. Another limitation is that the number of species does not take account the species abundance.
3. Functional approach of the biodiversity: functional groups diversity
Rather than regrouping plants individuals regarding their taxonomy, functional regrouping can be also made. A functional group gathers species/individuals with the same function (Lavorel et al., 1997).
Species can be regrouped regarding their effects on the ecosystem functioning (effect group) or species with the same responses to an environmental factor (responses group). One interest of functional groups approach is to be more general and mechanistic than a taxonomic approach (Diaz and Cabido, 2001).
Complementarity effect is assessed by the number of functional groups and the ―sampling effect‖ is assessed by the functional identify (presence of some functional groups). The ―functional groups‖ approaches were used to study several ecosystem