HAL Id: hal-02321331
https://hal.archives-ouvertes.fr/hal-02321331
Submitted on 21 Oct 2019HAL is a multi-disciplinary open access archive for the deposit and dissemination of sci-entific research documents, whether they are pub-lished or not. The documents may come from teaching and research institutions in France or abroad, or from public or private research centers.
L’archive ouverte pluridisciplinaire HAL, est destinée au dépôt et à la diffusion de documents scientifiques de niveau recherche, publiés ou non, émanant des établissements d’enseignement et de recherche français ou étrangers, des laboratoires publics ou privés.
Multiple facets of diversity effects on plant productivity:
species richness, functional diversity, species identity
and intraspecific competition
Lucie Mahaut, Florian Fort, Cyrille Violle, Gregoire Freschet
To cite this version:
Lucie Mahaut, Florian Fort, Cyrille Violle, Gregoire Freschet. Multiple facets of diversity effects on plant productivity: species richness, functional diversity, species identity and intraspecific competition. Functional Ecology, Wiley, 2019, �10.1111/1365-2435.13473�. �hal-02321331�
1
Multiple facets of diversity effects on plant productivity: species richness,
1
functional diversity, species identity and intraspecific competition
2
Lucie Mahaut1*, Florian Fort2, Cyrille Violle3 & Grégoire T. Freschet3† 3
1 Centre d’Ecologie Fonctionnelle et Evolutive, Univ Montpellier, CNRS, EPHE, IRD, Univ 4
Paul Valéry Montpellier 3, Montpellier, France 5
2 Centre d’Ecologie Fonctionnelle et Evolutive, Montpellier SupAgro, CNRS, Univ 6
Montpellier, Univ Paul Valéry Montpellier 3, EPHE, IRD, Montpellier, France 7
3 Centre d’Ecologie Fonctionnelle et Evolutive, CNRS, EPHE, IRD, Univ Montpellier, Univ 8
Paul Valéry Montpellier 3, Montpellier, France 9
† present address: Theoretical and Experimental Ecology Station, CNRS, Paul Sabatier 10
University, Moulis, France 11
*Corresponding author: lucie.mahaut1@gmail.com 12 13 14 15 16 17 18 19 20 21
2
Abstract
22
1. Deciphering the mechanisms that drive variation in biomass production across plant 23
communities of contrasting species composition and diversity is a main challenge of 24
biodiversity-ecosystem functioning research. Niche complementarity and selection effect have 25
been widely investigated to address biodiversity-productivity relationships. However, the 26
overlooking of the specific role played by key species have limited so far our capacity to 27
comprehensively assess the relative importance of other potential drivers of biodiversity effects. 28
2. Here, we conducted a grassland diversity-productivity experiment to test how four potential 29
facets of biodiversity effects, namely species richness, functional diversity, species identity and 30
the relaxation of intraspecific competition, account for variations in above and root biomass 31
production. 32
3. We grew six plant species in monoculture, as well as in every combinations of two, three and 33
six species. Plant density was kept constant across the richness gradient but we additionally 34
grew each species in half-density monoculture to estimate the strength of intraspecific 35
competition for each studied species. We characterized eight functional traits, including root 36
traits, related to nutrient and light acquisition and computed both the functional dissimilarity 37
and the community weighted mean (CWM) of each trait. We further partitioned aboveground 38
biodiversity effect into complementarity and selection effects. 39
4. We observed strong positive biodiversity effects on both aboveground and root biomass as 40
well as strong positive complementarity effect. These arose largely from the presence of a 41
particular species (Plantago lanceolata) and from CWM trait values more than from a higher 42
functional dissimilarity in plant mixtures. P. lanceolata displayed the highest intraspecific 43
competition, which was strongly relaxed in species mixtures. By contrast, the presence of 44
3
Sanguisorba minor negatively affected the productivity of plant mixtures, this species suffering
45
more from interspecific than intraspecific competition. 46
5. This study provides strong evidences that the search for key species is critical to understand 47
the role of species diversity on ecosystem functioning and demonstrates the major role that the 48
balance between intraspecific and interspecific competition plays in biodiversity-ecosystem 49
functioning relationships. Developing more integrative approaches in community and 50
ecosystem ecology can offer opportunities to better understand the role that species diversity 51
plays on ecosystem functioning. 52
53
Key words: biodiversity-ecosystem functioning, complementarity effect, functional trait,
54
functional distinctiveness, niche difference, roots, selection effect, species coexistence 55 56 57 58 59 60 61 62 63 64 65
4
Introduction
66
Although numerous plant diversity-ecosystem functioning experiments have reported 67
positive effects of plant species richness on ecosystem productivity (e.g., Tilman et al., 2001; 68
Cardinale et al., 2012; Lefchek et al., 2015), the nature of the mechanisms that cause this pattern 69
remains highly controversial. It is widely accepted that niche complementarity can lead to 70
higher productivity in plant mixtures compared to monocultures (biodiversity effects; Huston, 71
1997; Loreau & Hector, 2001). Such a complementarity effect may be due to species differences 72
in the way they capture and use resources (so-called resource partitioning), due to species ability 73
to alter their surrounding environment and to subsequently favour the fitness of other species 74
(e.g., abiotic facilitation), or due to plant interactions with other trophic levels (Barry et al., 75
2018). Positive biodiversity effects can also result from an increased probability of selecting a 76
species with a specific property as the size of the community increases, for example a highly 77
productive species (Loreau & Hector, 2001). The selection effect describes whether the species 78
that dominate plant mixtures are the most productive species in monoculture (i.e. positive 79
selection effect) or the least productive species in monoculture (i.e. negative selection effect; 80
Loreau & Hector, 2001). However, the presence of some other species can also exert a 81
disproportionate effect on ecosystem functioning irrespective of their biomass in monoculture 82
(Jaillard, Deleporte, Loreau & Violle 2018). Such a species-specific effect underpins the well-83
known concept of keystone species, i.e. species having 'disproportionately large effects relative 84
to its abundance' (Paine, 1969; see also Violle et al. 2017 for a revisiting concept in the light of 85
functional ecology theory). Recently, Maire et al. (2018) extended this concept by defining "key 86
species" as those species that are 'consistently and significantly associated to a certain level of 87
ecosystem functioning or services' (Maire et al., 2018). Although the search for key species can 88
reveal unsuspected mechanisms for ecosystem functioning (Huston, 1997; Diaz et al., 2007), 89
their role in biodiversity-ecosystem functioning experiments have been largely neglected. 90
5 Because ecological niches are theoretically linked to a suite of functional traits (Violle 91
& Jiang 2009), functional traits appear to be a promising tool for understanding diversity-92
productivity relationships. On the one hand, differences in functional traits (functional 93
dissimilarity) can reflect differences in the use of resources that allow species to partition the
94
local pool of resources and avoid interspecific competition (Violle et al., 2012). For instance, 95
differences in the vertical distribution of roots among species allow the capture of water and 96
nutrients at different soil depths. On the other hand, the functional traits of dominant species in 97
plant mixtures can be approximated using the community weighted mean (CWM) of functional 98
trait values (Garnier et al., 2004; Diaz et al., 2007). It has been argued that functional 99
dissimilarity can mediate the complementarity effect while CWMs can mediate the selection 100
effect by highlighting the role of the dominant species on ecosystem functioning (Cadotte, 101
2017). Disentangling the respective influence of both processes through a trait-based approach 102
thus requires using a set of traits that are directly linked to species’ resource use and competitive 103
ability. For instance belowground, this requires studying root traits that reflect how species 104
develop specialized strategies to explore the soil volume (e.g., deep root fraction, specific root 105
length, root inter-branch distance) and to extract water and nutrients (e.g., root hair length, 106
specific nutrient absorption rate; Freschet, Violle, Bourget, Scherer-Lorenzen & Fort, 2018). 107
Finally, species may exert highly specific effects on the functioning of ecosystems that 108
cannot be captured by metrics of functional diversity computed at the community scale (Diaz 109
et al., 2007). Among others, the fact that every species has a specific density-productivity
110
relationship in monoculture can be an important mechanism for ecosystem functioning. Indeed 111
in most biodiversity-productivity experiments, species relative density - which directly drives 112
the strength of intraspecific competition (Chesson, 2000) - decreases along the gradient of 113
species richness (i.e. substitutive experimental design; Hector, 1998; Joliffe, 2000). In parallel, 114
interspecific competition – which by essence is null in monoculture – increases along this 115
6 gradient, so that weaker competitors can perform better in monoculture where they do not 116
encounter other species (Turnbull, Levine, Loreau & Hector, 2013). The relative importance of 117
intraspecific and interspecific competition on the productivity of each species could therefore 118
be an important driver of biodiversity-ecosystem functioning relationships (Benedetti-Cecchi, 119
2004; Turnbull et al., 2013, 2016).Despite these evidences, previous experimental biodiversity-120
ecosystem functioning studies have largely neglected the role of species intraspecific 121
competition (but see Polley, Wilsey & Derner, 2003), leaving the question unanswered. 122
In this study, we tested the strength and significance of four drivers of plant biomass 123
production in biodiversity-ecosystem functioning experiment, namely species richness, 124
functional diversity, species identity and intraspecific competition. To do so, we experimentally 125
designed grassland plant communities representing a gradient of species richness (from one to 126
six) and functional diversity. We manipulated three different functional groups (namely 127
‘grasses’, ‘forbs’ and ‘legumes’), and characterized eight functional traits (three shoot and five 128
root traits) that were directly related to the acquisition of light and nitrogen (Freschet et al., 129
2018). We tested each above-mentioned effect separately by combining the conceptual 130
framework of Diaz et al. (2007) and the statistical framework of Maire et al. (2018). Briefly, to 131
understand how species diversity affects ecosystem functioning, Diaz et al. (2007) suggests to 132
first test for the role of functional diversity and, in a second step, to look for potentially 133
remaining species-specific effects. In parallel, Maire et al. (2018) developed a statistical 134
framework that aims at identifying key species that drive ecosystem functioning (Maire et al., 135
2018). In this framework, we separately tested the effect of the presence of a candidate species 136
or the effect of a candidate functional trait by adding species presence or functional diversity as 137
an explanatory variable to a baseline model that previously accounted for the effects of species 138
richness. Finally, we estimated the strength of the effect of intraspecific competition by 139
7 quantifying for every species the gain of individual biomass when decreasing plant density in 140
monocultures. 141
Materials and Methods
142
Experimental design
143
The experiment was conducted at the Center for Functional and Evolutionary Ecology, 144
Montpellier, France. We grew six plant species in monoculture (6 combinations), as well as in 145
every combinations of two (15 combinations), three (20 combinations) and six species (1 146
combination) in a greenhouse with three replicate pots for the monoculture, two and three 147
species combinations and six replicates for the six species combination. Plant species were 148
common European herbaceous species (see Table 1): two grasses (Bromus erectus Huds., 149
Dactylis glomerata L.), two forbs (Plantago lanceolata L., Sanguisorba minor Scop.) and two
150
legumes (Lotus corniculatus L., Trifolium repens L). We chose this set of species to avoid 151
functional redundancy, these species displaying contrasted functional traits. Seeds were 152
collected from permanent grasslands located in southern France. Plant density was kept 153
constant across the richness gradients (i.e. six individuals per pot with equal species relative 154
abundance) but we additionally grew each species in three replicates of half-density 155
monoculture (i.e. three individuals per pot) to estimate the strength of intraspecific competition 156
for each studied species. Climate conditions in the greenhouse were semi-controlled. 157
Temperature was allowed to fluctuate between 15 and 19°C at night and between 21 and 25°C 158
during the day. Natural light conditions were complemented for the duration of the experiment 159
(with 400W Na-ion lamps) to provide a typical change in photoperiod during the plant growing 160
season from 12 h initially to 14.5 h at the end of the experiment. 161
We used deep pots (depth 60 cm, diameter 15 cm) containing c. 17 kg (DW) of soil. Soil 162
density was increased by compaction every 20 cm in depth (from 1.51 to 1.63 and 1.74 g.cm-3) 163
8 to ensure realistic growth conditions for plants. The soil was a calcareous sandy loam (pH = 164
8.5) with rather low organic matter content (9.7 g.kg-1), cation-exchange capacity (0.5 g.kg-1) 165
and total N content (0.5 g.kg-1). At the start of the experiment, in November 2015, a soil leachate 166
solution was added to ensure the presence of symbiotic N2-fixing bacteria in the pot. Pots were 167
watered three times a week to provide moisture conditions close to field capacity in the soil 168
profiles; this corresponded to 0.1L of water at the start of the experiment and 0.6L at the end in 169
order to account for increasing plant demand. In addition, all pots received three soil 170
enrichments (after 1, 4 and 9 weeks) in phosphorus (P) and potassium (K) in increasing amount 171
over time for a total of 10 g P m-2 and 24 g K m-1. Note that nitrogen was not supplied so that it 172
remained the main limiting resource for plant growth. We randomly placed pots on wheeled 173
carriages and avoided side effects by rearranging carriages every two weeks. 174
Biomass measurements
175
Plants harvest took place 13 weeks after seedling transplantation after all species had 176
shown first signs of flowering. We cut aboveground parts of plants at the base and separated the 177
six plant individuals to measure aboveground biomass of each individual plant. We evaluated 178
root biomass of each pot after splitting the column of soil in three equal cylinders, each 20 cm 179
long, and careful retrieving and washing roots from each cylinder. Plant material was oven-180
dried at 60°C for 48 h and weighed. 181
Trait measurements
182
We measured three aboveground traits and five belowground traits related to both 183
nitrogen and light acquisition. For each trait, the detailed protocol is presented in Freschet et al. 184
(2018). Briefly, three weeks before harvest, we measured light-saturated leaf photosynthetic 185
rate per area (Aarea, µmolCO2 m-2 s-1) - that provides the leaf maximal photosynthesis capacity - 186
on one individual per monoculture pot by quantifying the amount of C accumulated in a leaf 187
9 exposed to a high light intensity for several minutes (C influx vs efflux). One week before the 188
experiment harvest, we recorded the maximum height (cm) achieved by all plant individuals in 189
all pots. Plant height is a good proxy for light depletion through the canopy (Violle et al. 2009). 190
Specific leaf area (SLA, m².kg-1) was assessed at harvest based on two to four leaves (depending 191
on the species) from each plant individual that we immediately scanned for leaf area 192
measurement. Specific leaf area corresponds to the area of light capture per biomass invested 193
in leaves and is related to the fundamental trade-off existing between species acquisition and 194
conservation of resources (Garnier & Laurent 1994). 195
Root functional traits were measured from monoculture pots only because of the 196
difficulty and labour associated to separating roots among species in mixture pots. A subsample 197
of roots was used to determine root length, mean root diameter and the proportion of very fine 198
roots (<0.2 mm) using a digital image analysis system (WinRhizo, version 2009, Regent 199
Instrument, Québec, Canada). Deep root fraction (DRF), which reflects the relative investment 200
of species to take up nutrient from the deeper soil horizons, was estimated as the ratio of root 201
biomass deeper than 20 cm to total root biomass. Root inter-branch distance (RID, cm) is a 202
measure of root cost-efficiency to explore large soil volume (rather than exploit soil volume 203
intensively) and was quantified as the average distance between first order roots. Specific root 204
length (SRL, m.g-1) was estimated as the ratio of root length to root dry mass to represent the 205
cost-efficiency of roots to explore and/or exploit soil volume. A second subsample of roots was 206
stained with methyl violet in order to make root hairs visible and measure root hair length (RHL, 207
mm) on 10 randomly selected first order roots, over stretches of 1 mm roots situated 2 mm away 208
from the root tips, using ImageJ software. Root hair length is a proxy for the soil volume 209
explored around the root. Finally, we used one replicate (pot) from the six species in 210
monoculture to measure specific root nitrogen absorption rate (Nabs), which reflects the short-211
term maximum nitrogen uptake capacity per unit root length. We calculated Nabs as the total 212
10 amount of 15N taken up by plants after injection of different forms of 15N in the soil, per length 213
of fine root and per h (µg 15N m-1 h-1). 214
Biodiversity effects
215
We quantified the biodiversity effect (ΔY), which is the performance of plant mixture 216
relative to that expected from monocultures, separately for aboveground and root biomass 217
production. Then, following the equation proposed by Loreau & Hector (2001): 218
𝛥𝑌𝑗 = 𝑁𝑗 . 𝛥𝑅𝑌̅̅̅̅̅̅ . 𝑀̅ + 𝑁𝑗 . 𝐶𝑂𝑉(𝛥𝑅𝑌𝑖,𝑗, 𝑀𝑖) Equation 1 219
we computed the two components of ΔY, the complementarity and selection effects, only for 220
aboveground ΔY as we did not measure individual root biomass in plant mixtures. In this 221
equation, 𝑁𝑗 is the number of species in pot j. 𝛥𝑅𝑌𝑖,𝑗is the deviation from the expected relative 222
yield of species i in pot j calculated as: 223 𝛥𝑅𝑌𝑖,𝑗 = 𝑌𝑖,𝑗 𝑀𝑖 − 1 𝑁𝑗 Equation 2 224
where 𝑌𝑖,𝑗 is the biomass measured for species i in pot j and 𝑀𝑖is the average monoculture 225
biomass for species i. As species were sown at constant density of individuals, the expected 226
yield is simply the inverse of the number of species in pot j (1/𝑁𝑗). The first component of the 227
biodiversity effect equation (𝑁𝑗 . 𝛥𝑅𝑌̅̅̅̅̅̅ . 𝑀̅) is the complementarity effect, which quantifies the 228
performance of plant mixtures relative to the performance of the component monocultures. The 229
covariance between species performance in monoculture and in plant mixture, 230
𝑁𝑗 . 𝐶𝑂𝑉(𝛥𝑅𝑌𝑖,𝑗, 𝑀𝑖), has been termed the selection effect. 231
Functional diversity
232
We assessed the effects of species traits on ecosystem functioning by computing two 233
facets of functional diversity, namely functional dissimilarity and community weighted mean 234
11 (CWM). We quantified functional dissimilarity using the functional dispersion (FDis) index 235
computed separately for each trait using the fdisp function of the FD R package (Laliberté, 236
Legendre & Shipley, 2014). For each trait, we computed FDis based on mean species trait 237
values measured in monoculture pots only to insure homogeneity between the different traits 238
that were measured in all pots or in monoculture only (Table 1). Since plant height and SLA 239
were quantified at the individual level, we further tested the role of intraspecific trait variability 240
by computing FDisHeight and FDisSLA based on trait values measured on individuals from all 241
pots. CWM were calculated for each trait by multiplying the mean species trait value measured 242
in monoculture pots by the proportional abundance of each species in each community. Finally, 243
we classified the six species into three functional groups (legumes, herbs and forbs). 244
Data analyses
245
We investigated the effect of species richness, functional dissimilarity, CWM and 246
species identity on aboveground and root biomass production, aboveground and belowground 247
biodiversity effects as well as aboveground complementarity and selection effects using linear 248
models. Following Maire et al. (2018), we first tested the extent to which species richness 249
affected biomass production, biodiversity effects, complementarity effect and selection effect 250
in a baseline model (M0). Next, we built ‘functional group’, ‘functional dissimilarity’, ‘CWM’ 251
and ‘species identity’ models to test the extent to which the data support the effect of a particular 252
functional group, functional trait or species identity on these response variables. To do so, we 253
added the presence of each functional group or species (coded as a binary variable) or FDis and 254
CWM of each trait separately as an explanatory variable to M0. The resulting model (M1i), 255
which is the importance of a candidate species i, functional group i or functional trait i to explain 256
variation in productivity, was then evaluated according to its Akaike information Criterion 257
(AIC). We considered a species, a functional group or a functional trait as important for 258
productivity if ΔAIC (AICM0 – AICM1i) was greater than 4 (Maire et al., 2018). Although a 259
12 commonly adopted rule of thumb states that a model with ΔAIC<2 is likely to be the best model 260
(Burnham & Anderson, 2002; Richards, 2005), here we doubled this threshold to reduce the 261
probability of having false positive. We standardized all variables before analysis to facilitate 262
the interpretation of the regression coefficients (Schielzeth, 2010). Because in the six species 263
mixtures each species and functional group were systematically present, we ran the functional 264
group and species identity models without the six-species mixture pots. The sample size were 265
therefore 128 for the functional trait models and 110 for the functional group and species 266
identity models. We further computed the posterior model probabilities to report the probability 267
that each model M1i is better than M0 using the bicreg function of the BMA package (Raftery 268
et al., 2018). Posterior model probabilities were highly consistent with the ΔAIC analysis. 269
Consequently, we presented ΔAIC in the main manuscript and posterior model probabilities in 270
supplementary Table S1. 271
In addition, we tested for the influence of intraspecific competition, i.e. species-specific 272
density-productivity relationships, on biomass production by computing for each species 273
intraspecific competition logarithmic response-ratio (Hedges, Gurevitch & Curtis 1999). To do 274
so, for each species, we compared the biomass of the nine individuals grown in monocultures 275
sown at half-density to the biomass of the 18 individuals grown in monocultures sown at full 276
density. Positive logarithmic response-ratio corresponds to higher biomass for the individual of 277
the monoculture sown at half-density while negative response-ratio corresponds to higher 278
biomass for the individuals of the monoculture sown at full density. Finally, we computed the 279
standardized difference (effect size) between individual plant biomass of species grown in 280
monoculture with half density and monoculture and mixtures of two, three and six species 281
grown at full density (six individuals). Since root biomass was not quantified at the level of 282
individual plants in mixtures, such effect sizes were only calculated for aboveground biomass. 283
Confidence intervals (α=0.05) were computed to test whether individual plant biomass in full 284
13 density pots significantly differed from individual plant biomass of the same species grown in 285
monoculture at half-density. All analyses were conducted using R ver. 3.4.4. (www.r-286
project.org). 287
Results
288
Effects of species richness on plant aboveground and belowground biomass production
289
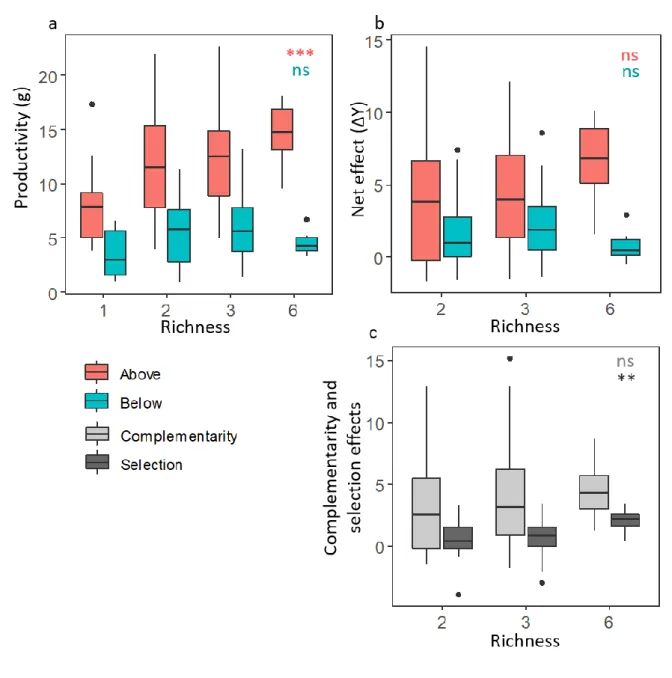
Among all mixtures, aboveground productivity was the main fraction of plant biomass 290
production (Fig. 1a, b), accounting for c. 70% of the biomass produced per pot. Aboveground 291
biomass significantly increased with species richness (P < 0.001, r² = 0.08) while root biomass 292
did not (P = 0.17, r² = 0.01; Supplementary Table S2). Most importantly, both mean 293
aboveground and belowground biodiversity effects (ΔY) were positive at all species richness 294
levels (Fig. 1b). However, they did not increase with species richness (P = 0.09, r² = 0.02; P = 295
0.70, r² = 0.01 for aboveground and belowground net effects, respectively; Table S2). 296
The additive partitioning of aboveground biodiversity effect (ΔY) revealed that among 297
all mixtures, complementarity effect was the main fraction of ΔY (Fig. 1c), accounting for ~ 298
83% of aboveground ΔY. Complementarity effect did not increase with species richness (P = 299
0.34, r² = 0.01; Table S2) while the selection effect did (P = 0.02, r² = 0.04; Table S2). 300
Removing the six species mixtures from the analyses did not change the effects of 301
species richness on aboveground biomass production, aboveground and belowground 302
biodiversity effects and complementarity effects (Table S2). However, root biomass 303
significantly increased with species richness while the positive effect of species richness on 304
selection effect disappeared when the six species mixtures were removed from the analyses 305
(Table S2). 306
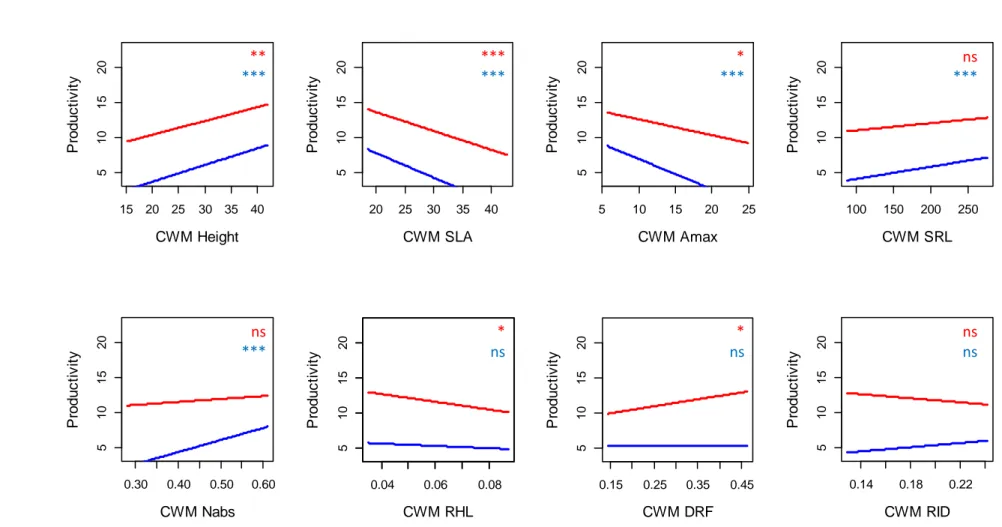
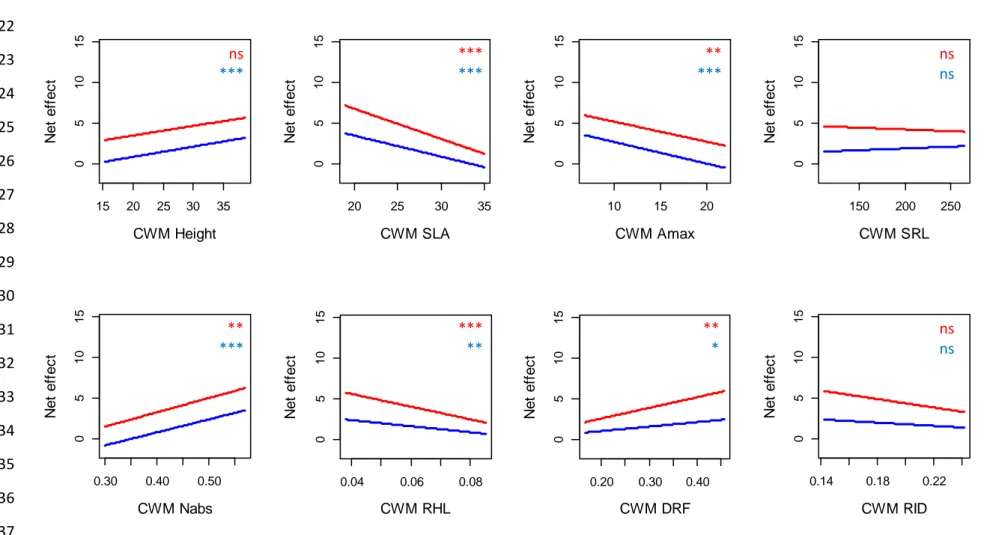
Stronger effects of CWMs compared to functional dissimilarity and functional group diversity
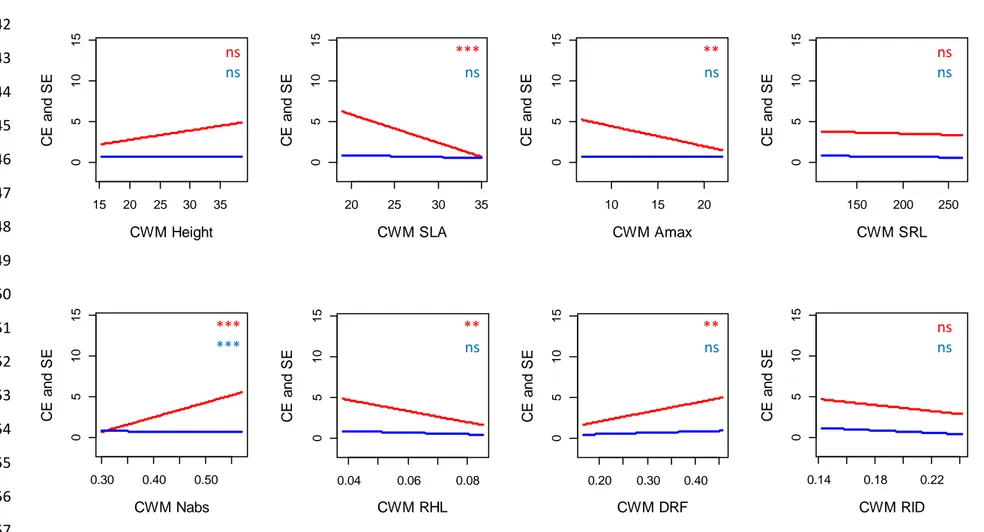
14 ΔAIC values revealed that the main facet of functional diversity affecting biomass 308
production was the CWM of the studied traits (Table 2). After controlling for species richness 309
effect, CWMSLA and CWMAmax exerted a strong influence on all the components of biomass 310
production - except the selection effect (Table 2). Productivity, biodiversity effects and 311
complementarity effect consistently decreased with CWMSLA and CWMAmax (Table 2; Figs. S1, 312
S2 and S3). In addition, aboveground productivity, root productivity and belowground net effect 313
increased with CWMHeight (Table 2; Figs. S1 and S2). Aboveground net effect, belowground net 314
effect and complementarity effect also increased with CWMNabs and CWMDRF and decreased 315
with CWMRHL (Table 2; Figs. S2 and S3). By contrast, plant functional group identity poorly 316
affected plant productivity and biodiversity effects beyond the overall effect of species richness 317
(Table 2). The only exception was the presence of leguminous species that exerted a negative 318
effect on root productivity in plant mixtures (P < 0.001). The ΔAIC analysis also revealed that 319
functional dissimilarity slightly affected plant productivity and biodiversity effects (Table 2). 320
After controlling for species richness effect, root productivity significantly increased with 321
FDisHeight, FDisSRL and FDisNabs (Table 2; Fig. S4). Finally, aboveground net effect, 322
belowground net effect and complementarity effect significantly decreased with FDiRID (Table 323
2; Figs. S5 and S6). 324
Key species associated to changes in productivity
325
The presence of P. lanceolata in the mixture was the principal driver of change in 326
productivity (for aboveground and root productivity: ΔAIC = 20.307, r² = 0.225 and ΔAIC = 327
69.211, r² = 0.471, respectively), net effects (for aboveground and belowground net effects: 328
ΔAIC = 26.224, r² = 0.229 and ΔAIC = 45.967, r² = 0.366, respectively) and complementarity 329
effect (ΔAIC = 26.578, r² = 0.230; Table 2). All these components of biomass production were 330
significantly higher when P. lanceolata was in the plant mixtures (Fig. 2). The presence of S. 331
minor and T. repens in plant mixtures also markedly affected biomass production. Aboveground
15 and root productivity, net effects and complementarity effects were lower in presence of S. 333
minor while the selection effect was higher. Aboveground productivity was higher in the
334
presence of T. repens while root productivity and selection effects were lower (Fig. 2). 335
Nevertheless their influence on net effects, complementarity and selection effects were 336
substantially (from two to ten times) lower than to those of P. lanceolata (Table 2). 337
Species-specific effect and intraspecific competition
338
Species’ logarithmic response-ratio calculated based on aboveground biomass 339
production was positive for all species (Fig. 3), meaning that biomass production was in average 340
higher in half-density plots for all species. However, we found significant differences between 341
species (ANOVA, F=41.3, P < 0.001), mean logarithmic response-ratio being the highest for P. 342
lanceolata (1.36±0.45) and the lowest for S. minor (0.41±0.69; Fig. 3). In other words, the
343
biomass of P. lanceolata individual plants was four times lower in the full-density monoculture 344
than in the half-density monoculture. In addition, we found that the biomass of individual plants 345
of P. lanceolata in the three and six species mixtures did not significantly differ from their 346
biomass in the half-density monoculture (Fig. 4). Similarly, the biomass of individual plants of 347
T. repens in the six species mixture was equivalent to their biomass in the half-density
348
monoculture, whereas it was otherwise lower (Fig. 4). By contrast, the biomass of individual 349
plants of S. minor in full-density monoculture, two, three and six species mixtures was lower 350
than in half-density monoculture but the lowest difference was observed between full-density 351
monoculture and half-density monoculture (Fig. 4). 352
Discussion
353
Our study revealed contrasting influences of the four studied facets of biodiversity 354
effects on ecosystem biomass production. Species richness and functional dissimilarity showed 355
only moderate influence, whereas community weighted trait means (CWM), species identity 356
16 and the relaxation of intraspecific competition accounted for a large part of observed 357
biodiversity effects. 358
The significantly higher aboveground and root biomass production observed here in 359
plant mixtures compared to monoculture is a common pattern in biodiversity-ecosystem 360
functioning studies (e.g., Tilman et al., 2001; Cardinale et al., 2012; Lefcheck et al., 2015). We 361
also reported a strong dominance of the complementarity effect over the selection effect, which 362
has been frequently observed, at least in long-term experiments (Cardinale et al., 2007; Reich 363
et al., 2012). Furthermore, the selection effect increased with species richness, confirming that 364
the probability of selecting a highly productive species that over-produce in mixture increases 365
with the size of the community (Huston, 1997). However, species richness per se did not affect 366
aboveground and belowground biodiversity effects nor complementarity effect (Fig. 1). This 367
reveals the limited value of species number per se to predict biodiversity-ecosystem functioning 368
relationships, and emphasizes the importance of considering other biodiversity facets. 369
Since niche complementarity theoretically relies on functional trait differences (Violle 370
& Jiang, 2009), we expected that biodiversity and complementarity effects would increase with 371
functional dissimilarity (Cadotte, 2017). Surprisingly, we found weak effects of functional 372
dissimilarity, except for a decrease of the biodiversity and complementarity effects with the 373
dissimilarity in root inter-branch distance. The use of trait-by-trait dispersion indices to compute 374
functional dissimilarity can explain the weakness of such relationships. However, while the 375
combinations of traits may better describe species differentiation along the multiple ecological 376
dimensions of species niche (Kraft et al., 2015), using a multi-dimensional functional 377
dispersion index did not improve the observed relationship between functional dissimilarity and 378
biodiversity effects (See Supplementary Table S3). Another reason may be that we computed 379
functional dissimilarity in plant mixtures based on mean species trait values in monoculture. 380
Doing so, we did not account for intraspecific trait variations, which can vary in conditions of 381
17 competition and affect resource uptake (e.g., belowground, Mommer, van Ruijven, Jansen, van 382
de Steeg & de Kroon, 2012; Schenk, 2006). However, aboveground, accounting for 383
intraspecific trait variations in plant height and specific leaf area, both traits being measured at 384
the individual level, did not change the results (see Supplementary Table S3). Overall, given 385
our targeted choice of traits capturing multiple facets of light and nutrient acquisition above and 386
belowground (Freschet et al., 2018), the weak relationship between functional dissimilarity and 387
the complementarity effect confirms that the complementarity effect does not only reflect 388
resources partitioning but a larger set of biotic interactions in species mixtures (Loreau & 389
Hector, 2001; Carroll, Cardinale & Nisbet, 2011; Niklaus, Baruffol, He, Ma & Schmid, 2017; 390
Garry et al., 2018). 391
By contrast, we reported strong influence of five out of eight community weighed trait 392
means on the complementarity effect – and by extent on biodiversity effects. Species ability to 393
take up nitrogen resources was a main driver of biomass productivity, as suggested by the 394
positive relationships between the community weighted mean of both nitrogen absorption rate 395
and deep root fraction and biodiversity effects. Furthermore, biodiversity and complementary 396
effects increased with decreasing the community weighted mean of specific leaf area and 397
maximum photosynthetic rate, implying that biomass production was maximum when plant 398
communities were dominated by slow-growing, resource conservative species (Wright et al., 399
2004). Although such a result might be surprising given the short-term nature of our experiment, 400
it may reflect the fact that low nutrient availability in this experiment have favored plants with 401
the more conservative resource strategies (Wright et al., 2004; Carmona et al., 2019). More 402
globally, the importance of functional trait values gives evidence that in this experiment, 403
ecosystem functioning is strongly driven by the identity of the dominant species (mass-ratio 404
hypothesis, Grime, 1998). However, we did not find significant relationship between the CWMs
405
and the selection effect while this is a main expectation under the mass-ratio hypothesis 406
18 (Cadotte, 2017). This shows that the effect of the dominant species on ecosystem functioning 407
differs from the selection effect sensu Loreau & Hector (2001) and calls for a more mechanistic 408
approach to understand the relationships between biodiversity and ecosystem functioning. 409
We found a disproportionate contribution of one species, Plantago lanceolata, on the 410
production of biomass and biodiversity effects in plant mixtures. Among the six species of this 411
experiment, P. lanceolata displayed the lowest biomass in monoculture but the highest biomass 412
in the 6x6-plant mixtures (Figure 4). Consequently, the specific effect of selecting P. lanceolata 413
in mixture differs conceptually from the selection effect, which can be positive only when the 414
most productive species in monoculture produce even more biomass in mixture (Loreau & 415
Hector, 2001). Despite this, the selection of P. lanceolata in mixture was the major determinant 416
of positive biodiversity effect on productivity. Its low biomass in monoculture was due to high 417
intraspecific competition, which was relieved in half-density monocultures and even more in 418
species mixtures (Figure 3). Consequently, the much lower level of interspecific competition as 419
compared to intraspecific competition for this particular species, appeared as the most critical 420
driver of biodiversity effects in our experiment. Since the strength of intraspecific competition 421
may be generally stronger than the strength of interspecific competition in plant communities 422
(Adler et al., 2018), we expect that such a mechanism may be widespread in biodiversity – 423
biomass production relationships. The same pattern, although much less strong, was also 424
observed here for T. repens, and the reverse pattern was recorded for S. minor, which suffered 425
more from interspecific competition than from intraspecific competition (see also Turnbull et 426
al., 2013). Interestingly, we observed that, across our six species, the effect of intraspecific
427
competition on species production was inversely related to the effect of interspecific 428
competition (Figure 4), suggesting that a priori knowledge of species-specific density-429
dependence production may be particularly useful to explain (and potentially predict) biomass 430
gains in mixtures. An increasing number of biodiversity-productivity studies already accounts 431
19 for the effect of negative density-dependence mechanisms such as density-dependence plant 432
disease (e.g., Schnitzer et al., 2011; Mommer et al., 2018). By contrast, the role of intraspecific 433
competition has received less attention (but see Polley et al., 2003). Our study shows that 434
accounting for the balance between interspecific and intraspecific competition in experimental 435
studies is essential to better predict the effect of species diversity on ecosystem functioning. 436
Since the relative strength of intraspecific compared to interspecific competition should 437
increase with niche differences (Chesson, 2000; Kraft et al., 2015), we might have expected 438
that P. lanceolata occupied a functional niche that is highly different from the one of the other 439
species. However, computing species functional distinctiveness (sensu Violle et al., 2017) based 440
on the traits used in this study (Supplementary Table S4) revealed that P. lanceolata is not 441
particularly different from the other species. This suggests that other aspects of plant eco-442
physiology (e.g., three-dimensional architecture, Schenk, 2006) may drive the response of P. 443
lanceolata to intraspecific and interspecific competition.
444
Finally, we found that the presence of legume species in plant mixtures negatively 445
affects belowground biomass production. By improving the availability of nitrogen in the 446
mixture (relief of competition and transfer to neighboring plants; Temperton, Mwangi, Scherer-447
Lorenzen, Schmid & Buchmann, 2007) legumes may lower the typical balance between root 448
versus shoot biomass investments (Freschet, Swart & Cornelissen, 2015). Indeed, legumes 449
generally exert a positive effect on aboveground biomass production (Temperton et al., 2007; 450
Marquard et al., 2009). Taking together, these results highlight the importance of considering 451
both aboveground and belowground biomass production in biodiversity-ecosystem functioning 452
analyses as both compartments can differentially respond to species diversity. 453
To conclude, our study brings novel evidence that species do not equally contribute to 454
ecosystem functioning and that the search for key species (sensu Maire et al., 2018) is a critical 455
issue to understand the effects of species diversity on ecosystem functioning (Diaz et al., 2007). 456
20 More precisely, by looking for a species-specific effect, we highlight the important role that 457
intraspecific competition plays in shaping biodiversity-ecosystem functioning relationships, 458
although the traits underlying species intraspecific competitive ability remain unknown. The 459
fact that intraspecific competition also plays a dominant role for species coexistence (Adler et 460
al., 2018) claims for a more integrative approach in community and ecosystem ecology to better
461
understand biodiversity-ecosystem functioning relationships (Turnbull et al., 2013, 2016). 462
Accounting for non-linear species-specific density-productivity relationships will be critical to 463
predict the effect of species diversity on ecosystem functioning (Baert, Jaspers, Janssen, De 464
Laender & Aert, 2017). 465
Acknowledgements
466
This study was supported by the EC2CO grant ‘MULTIVERS’ to G.T.F. and by the European 467
Research Council (ERC) Starting Grant Project ‘Ecophysiological and biophysical constraints 468
on domestication of crop plants’ (Grant-ERC-StG-2014-639706-CONSTRAINTS) to CV. We 469
are grateful to Pascal Chapon, Annick Lucas, Malick Diao, Océane Cobelli, David Degueldre, 470
Pauline Durbin, Jérémy Devaux, Pierrick Aury and Elodie Renaut for their proficient help with 471
the experimental setup, harvest and plant measurements. This experiment was supported by 472
Thierry Matthieu and the CEFE ‘terrain d’expériences’ (TE) team, Nicolas Barthès, Bruno 473
Buatois and Raphaëlle Leclerc within the ‘plateforme d’analyses chimiques’ (PACE) and by 474
the CEFE ‘plateforme long-terme’ (PLT). 475
Author contributions
476
G.T.F., F.F. and C.V. planned and designed the research. G.T.F. and F.F. performed the 477
experiments. L.M. analysed the data and wrote the manuscript. G.T.F., C.V., F.F. and L.M. 478
contributed substantially to revisions. 479
21
Data Availability Statement
481
Data deposited in the Dryad Digital Repository: DOI https://doi.org/10.5061/dryad.1jwstqjqh 482
(Mahaut et al., 2019) 483
References
484
Adler, P. B., Smull, D., Beard, K. H., Choi, R. T., Furniss, T., Kulmatiski, A., … Veblen, K. E. 485
(2018). Competition and coexistence in plant communities: intraspecific competition is stronger 486
than interspecific competition. Ecology Letters, 21(9), 1319–1329. doi: 10.1111/ele.13098 487
Baert, J. M., Jaspers, S., Janssen, C. R., De Laender, F., & Aerts, M. (2017). Nonlinear 488
partitioning of biodiversity effects on ecosystem functioning. Methods in Ecology and 489
Evolution, 8(10), 1233–1240. doi: 10.1111/2041-210X.12804 490
Barry, K. E., Mommer, L., van Ruijven, J., Wirth, C., Wright, A. J., Bai, Y., … Weigelt, A. 491
(2019). The Future of Complementarity: Disentangling Causes from Consequences. Trends in 492
Ecology & Evolution, 34(2), 167–180. doi: 10.1016/j.tree.2018.10.013 493
Benedetti‐Cecchi, L. (2004). Increasing accuracy of causal inference in experimental analyses 494
of biodiversity. Functional Ecology, 18(6), 761–768. doi: 10.1111/j.0269-8463.2004.00908.x 495
Burnham, K. P., & Anderson, D. R. (2002). Model Selection and Multimodel Inference: A 496
Practical Information Theoretic Approach (2nd ed. 2002. Corr. 3rd printing 2003). New York: 497
Springer-Verlag New York Inc. 498
Cadotte, M. W. (2017). Functional traits explain ecosystem function through opposing 499
mechanisms. Ecology Letters, 20(8), 989–996. doi: 10.1111/ele.12796 500
Cardinale, B. J., Duffy, J. E., Gonzalez, A., Hooper, D. U., Perrings, C., Venail, P., … Naeem, 501
S. (2012). Biodiversity loss and its impact on humanity. Nature, 486(7401), 59–67. doi: 502
10.1038/nature11148 503
22 Carmona, C. P., de Bello, F., Azcarate, F. M., Mason, N. W. H. & Peco, B. (2019). Trait 504
hierachies and intraspecific variability drive competitive interactions in Mediterranean annual 505
plants. Journal of Ecology, 107, 2078-2089. doi; 10.1111/1365-2745.13248 506
Carroll, I. T., Cardinale, B. J., & Nisbet, R. M. (2011). Niche and fitness differences relate the 507
maintenance of diversity to ecosystem function. Ecology, 92(5), 1157–1165. 508
Chesson, P. (2000). Mechanisms of Maintenance of Species Diversity. Annual Review of 509
Ecology and Systematics, 31(1), 343–366. doi: 10.1146/annurev.ecolsys.31.1.343 510
Diaz, S., Lavorel, S., de Bello, F., Quetier, F., Grigulis, K., & Robson, M. (2007). Incorporating 511
plant functional diversity effects in ecosystem service assessments. Proceedings of the National 512
Academy of Sciences of the United States of America, 104(52), 20684–20689. doi: 513
10.1073/pnas.0704716104 514
Enquist, B. J., Brown, J. H., & West, G. B. (1998). Allometric scaling of plant energetics and 515
population density. Nature, 395(6698), 163. doi: 10.1038/25977 516
Freschet, Gregoire T., Swart, E. M., & Cornelissen, J. H. C. (2015). Integrated plant phenotypic 517
responses to contrasting above- and below-ground resources: key roles of specific leaf area and 518
root mass fraction. New Phytologist, 206(4), 1247–1260. doi: 10.1111/nph.13352 519
Freschet, Grégoire T., Violle, C., Bourget, M. Y., Scherer-Lorenzen, M., & Fort, F. (2018). 520
Allocation, morphology, physiology, architecture: the multiple facets of plant above- and 521
below-ground responses to resource stress. The New Phytologist, 219(4), 1338–1352. doi: 522
10.1111/nph.15225 523
Garnier, E., & Laurent, G. (1994). Leaf anatomy, specific mass and water content in congeneric 524
annual and perennial grass species. New Phytologist, 128(4), 725–736. doi: 10.1111/j.1469-525
8137.1994.tb04036.x 526
23 Garnier, E., Cortez, J., Billes, G., Navas, M. L., Roumet, C., Debussche, M., … Toussaint, J. P. 527
(2004). Plant functional markers capture ecosystem properties during secondary succession. 528
Ecology, 85(9), 2630–2637. doi: 10.1890/03-0799 529
Grenié, M., Denelle, P., Tucker, C., Munoz, F., & Violle, C. (2018). funrar: Functional Rarity 530
Indices Computation (Version 1.2.2). Retrieved from https://CRAN.R-531
project.org/package=funrar 532
Grime, J. P. (1998). Benefits of plant diversity to ecosystems: immediate, filter and founder 533
effects. Journal of Ecology, 86(6), 902–910. doi: 10.1046/j.1365-2745.1998.00306.x 534
Hedges, L. V., Gurevitch, J., & Curtis, P. S. (1999). The Meta-Analysis of Response Ratios in 535
Experimental Ecology. Ecology, 80(4), 1150–1156. doi: 10.1890/0012-9658 536
Huston, M. A. (1997). Hidden treatments in ecological experiments: re-evaluating the 537
ecosystem function of biodiversity. Oecologia, 110(4), 449–460. doi: 10.1007/s004420050180 538
Jaillard, B., Deleporte, P., Loreau, M., & Violle, C. (2018). A combinatorial analysis using 539
observational data identifies species that govern ecosystem functioning. PLOS ONE, 13(8), 540
e0201135. doi: 10.1371/journal.pone.0201135 541
Jolliffe, P. A. (2000). The replacement series. Journal of Ecology, 88(3), 371–385. doi: 542
10.1046/j.1365-2745.2000.00470.x 543
Kraft, N. J. B., Adler, P. B., Godoy, O., James, E. C., Fuller, S., & Levine, J. M. (2015). 544
Community assembly, coexistence and the environmental filtering metaphor. Functional 545
Ecology, 29(5), 592–599. doi: 10.1111/1365-2435.12345 546
Laliberté, E., Legendre, P., & Shipley, B. (2014). FD: Measuring functional diversity (FD) from 547
multiple traits, and other tools for functional ecology (Version 1.0-12). Retrieved from 548
https://CRAN.R-project.org/package=FD 549
24 Lefcheck, J. S., Byrnes, J. E. K., Isbell, F., Gamfeldt, L., Griffin, J. N., Eisenhauer, N., … Duffy, 550
J. E. (2015). Biodiversity enhances ecosystem multifunctionality across trophic levels and 551
habitats. Nature Communications, 6, 6936. doi: 10.1038/ncomms7936 552
Loreau, M., & Hector, A. (2001). Partitioning selection and complementarity in biodiversity 553
experiments. Nature, 412(6842), 72–76. doi: 10.1038/35083573 554
Maire, E., Villéger, S., Graham, N. A. J., Hoey, A. S., Cinner, J., Ferse, S. C. A., … Mouillot, 555
D. (2018). Community-wide scan identifies fish species associated with coral reef services 556
across the Indo-Pacific. Proceedings. Biological Sciences, 285(1883). doi: 557
10.1098/rspb.2018.1167 558
Mahaut, L., Fort, F., Violle, C., Freschet T. G. (2019). Data from: Multiple facets of diversity 559
effects on plant productivity: species richness, functional diversity, species identity and 560
intraspecific competition. Dryad Digital Repository.https://doi.org/10.5061/dryad.1jwstqjqh. 561
Marquard, E., Weigelt, A., Temperton, V. M., Roscher, C., Schumacher, J., Buchmann, N., … 562
Schmid, B. (2009). Plant species richness and functional composition drive overyielding in a 563
six-year grassland experiment. Ecology, 90(12), 3290–3302. doi: 10.1890/09-0069.1 564
McCormack, M. L., Dickie, I. A., Eissenstat, D. M., Fahey, T. J., Fernandez, C. W., Guo, D., … 565
Zadworny, M. (2015). Redefining fine roots improves understanding of below-ground 566
contributions to terrestrial biosphere processes. New Phytologist, 207(3), 505–518. doi: 567
10.1111/nph.13363 568
Mommer, L., Cotton, T. E. A., Raaijmakers, J. M., Termorshuizen, A. J., van Ruijven, J., 569
Hendriks, M., … Dumbrell, A. J. (2018). Lost in diversity: the interactions between soil-borne 570
fungi, biodiversity and plant productivity. New Phytologist, 218(2), 542–553. doi: 571
10.1111/nph.15036 572
25 Mommer, L., van Ruijven, J., Jansen, C., van de Steeg, H. M., & de Kroon, H. (2012). 573
Interactive effects of nutrient heterogeneity and competition: implications for root foraging 574
theory? Functional Ecology, 26(1), 66–73. doi: 10.1111/j.1365-2435.2011.01916.x 575
Morris, W. F., Hufbauer, R. A., Agrawal, A. A., Bever, J. D., Borowicz, V. A., Gilbert, G. S., … 576
Vázquez, D. P. (2007). Direct and Interactive Effects of Enemies and Mutualists on Plant 577
Performance: A Meta-Analysis. Ecology, 88(4), 1021–1029. doi: 10.1890/06-0442 578
Mouquet, N., Devictor, V., Meynard, C. N., Munoz, F., Bersier, L.-F., Chave, J., … Thuiller, W. 579
(2012). Ecophylogenetics: advances and perspectives. Biological Reviews, 87(4), 769–785. 580
doi: 10.1111/j.1469-185X.2012.00224.x 581
Mulder, C. P. H., Uliassi, D. D., & Doak, D. F. (2001). Physical stress and diversity-productivity 582
relationships: The role of positive interactions. Proceedings of the National Academy of 583
Sciences, 98(12), 6704–6708. doi: 10.1073/pnas.111055298 584
Niklaus, P. A., Baruffol, M., He, J.-S., Ma, K., & Schmid, B. (2017). Can niche plasticity 585
promote biodiversity-productivity relationships through increased complementarity? Ecology, 586
98(4), 1104–1116. 587
Paine RT (1969) A note on trophic complexity and community stability. American Naturalist. 588
103:91-93. 589
Polley, H. W., Wilsey, B. J., & Derner, J. D. (2003). Do species evenness and plant density 590
influence the magnitude of selection and complementarity effects in annual plant species 591
mixtures? Ecology Letters, 6(3), 248–256. doi: 10.1046/j.1461-0248.2003.00422.x 592
Raftery, A., Hoeting, J., Volinsky, C., Painter, I., Yeung, K. Y. (2018). BMA: Bayesian model 593
averaging (version 3.18.9). Retrieved from: https://CRAN.R-project.org/package=BMA 594
26 Richards, S. A. (2005). Testing ecological theory using the information-theoretic approach: 595
Examples and cautionary results. Ecology, 86(10), 2805–2814. doi: 10.1890/05-0074 596
Schenk, H. J. (2006). Root competition: beyond resource depletion. Journal of Ecology, 94(4), 597
725–739. doi: 10.1111/j.1365-2745.2006.01124.x 598
Schielzeth, H. (2010). Simple means to improve the interpretability of regression coefficients. 599
Methods in Ecology and Evolution, 1, 103– 113. doi: 10.1111/j.2041-210X.2010.00012.x 600
Schnitzer et al. (2011) Soil microbes drive the classic plant diversity-productivity pattern. 601
Ecology, 92, 1385-1392. doi: 10.1890/10-0773.1 602
Temperton, V. M., Mwangi, P. N., Scherer-Lorenzen, M., Schmid, B., & Buchmann, N. (2007). 603
Positive interactions between nitrogen-fixing legumes and four different neighbouring species 604
in a biodiversity experiment. Oecologia, 151(2), 190–205. doi: 10.1007/s00442-006-0576-z 605
Tilman, D., Reich, P. B., Knops, J., Wedin, D., Mielke, T., & Lehman, C. (2001). Diversity and 606
Productivity in a Long-Term Grassland Experiment. Science, 294(5543), 843–845. doi: 607
10.1126/science.1060391 608
Turnbull, Lindsay A., Isbell, F., Purves, D. W., Loreau, M., & Hector, A. (2016). Understanding 609
the value of plant diversity for ecosystem functioning through niche theory. Proc. R. Soc. B, 610
283(1844), 20160536. doi: 10.1098/rspb.2016.0536 611
Turnbull, Lindsay Ann, Levine, J. M., Loreau, M., & Hector, A. (2013). Coexistence, niches 612
and biodiversity effects on ecosystem functioning. Ecology Letters, 16, 116–127. doi: 613
10.1111/ele.12056 614
Violle, C., Enquist, B. J., McGill, B. J., Jiang, L., Albert, C. H., Hulshof, C., … Messier, J. 615
(2012). The return of the variance: intraspecific variability in community ecology. Trends in 616
Ecology & Evolution, 27(4), 244–252. doi: 10.1016/j.tree.2011.11.014 617
27 Violle, C., & Jiang, L. (2009). Towards a trait-based quantification of species niche. Journal of 618
Plant Ecology, 2(2), 87–93. doi: 10.1093/jpe/rtp007 619
Violle, C., Thuiller, W., Mouquet, N., Munoz, F., Kraft, N. J. B., Cadotte, M. W., … Mouillot, 620
D. (2017). Functional Rarity: The Ecology of Outliers. Trends in Ecology & Evolution, 32(5), 621
356–367. doi: 10.1016/j.tree.2017.02.002 622
Williams, L. J., Paquette, A., Cavender-Bares, J., Messier, C., & Reich, P. B. (2017). Spatial 623
complementarity in tree crowns explains overyielding in species mixtures. Nature Ecology & 624
Evolution, 1(4), 0063. doi: 10.1038/s41559-016-0063 625
Wright, I. J., Reich, P. B., Westoby, M., Ackerly, D. D., Baruch, Z., Bongers, F., … Villar, R. 626
(2004). The worldwide leaf economics spectrum. Nature, 428(6985), 821–827. doi: 627
10.1038/nature02403 628
Figure 1: Effect of species richness on mean (A) aboveground and root productivity and (B)
629
aboveground and belowground biodiversity effects and (C) aboveground complementarity and 630
selection effects. Differences across the richness gradients are tested using linear models. ***: 631
p<0.001; **: p<0.01; *<0.05; ns: non-significant. Barplots represent the 1st, 2nd and 3rd quartiles. 632
Figure 2: Species-specific effect on aboveground (red) and belowground (blue) productivity
633
(a), net effects (b) and complementarity (light grey) and selection (dark grey) effects on 634
aboveground productivity (c). Arrows represent significant effect of the presence of a species 635
and its direction (p<0.05). Barplots represent the 1st, 2nd and 3rd quartiles. 636
Figure 3: Variation of the intraspecific competition log-response ratio between species. We
637
computed log-response ratio between individual plant aboveground biomass in monoculture 638
sown at half-density (BiomassHdens) and individual plant aboveground biomass in monoculture 639
sown at full-density (BiomassFdens). Positive log-response ratio corresponded to higher 640
aboveground biomass for the individual of the monoculture sown at half-density. Barplots 641
28 represent the 1st, 2nd and 3rd quartiles.
642
Figure 4: Standardized difference between individual plant biomass of species grown in
643
monoculture with half density (three individuals) and monoculture and mixtures of two, three 644
and six species grown at full density (six individuals). Whiskers are confidence intervals 645
(α=0.05): if confidence interval crossed 0, then individual plant biomass in full density pot does 646
not significantly differ from the individual plant biomass of the same species grown in 647
monoculture at half-density. A negative value means that individual plant biomass in full density 648
pot is lower than in half density pot, suggesting the influence of negative-density dependence 649
mechanisms. 650
29
Tables
651
Table 1: Species list and average trait values (± sd) as grown in monoculture conditions. g: grass; f: forb; l: legume.
652 Specific leaf area (m2 kg-1) Max photo-synthetic capacity (µmol-CO2 m-2 s-1) Plant height (cm) Specific root length (m g-1) Deep root (< 20 cm) fraction Specific N absorption rate (µg m-1 h-1) Root inter-branch distance (cm) Root hair length (mm) B. erectus (g) 26.63 ±2.5 14.64 ±1.0 24.50 ±4.2 150.12 ±53.7 0.38 ±0.02 0.06 ±0.01 0.35 ±0.04 0.24 ±0.03 D. glomerata (g) 29.23 ±0.8 5.70 ±0.7 41.89 ±3.7 275.50 ±27.6 0.41 ±0.03 0.04 ±0.01 0.46 ±0.04 0.24 ±0.04 P. lanceolata (f) 18.58 ±1.0 9.97 ±1.7 27.78 ±1.4 151.54 ±15.6 0.55 ±0.03 0.08 ±0.06 0.17 ±0.01 0.18 ±0.01 S. minor (f) 24.83 ±0.3 24.85 ±0.9 15.44 ±0.9 130.26 ±45.8 0.61 ±0.03 0.06 ±0.02 0.14 ±0.01 0.13 ±0.01 L. corniculatus (l)
42.75 ±5.1
14.53 ±2.1 15.33 ±1.1 87.52 ±19.1 0.38 ±0.11 0.09 ±0.03 0.36 ±0.09 0.20 ±0.01 T. repens (l) 31.26 ±2.3 20.60 ±7.5 22.89 ±0.9 140.19 ±24.8 0.28 ±0.03 0.08 ±0.04 0.20 ±0.01 0.16 ±0.02 653 654 655 656 657 658 659 660 661 66230
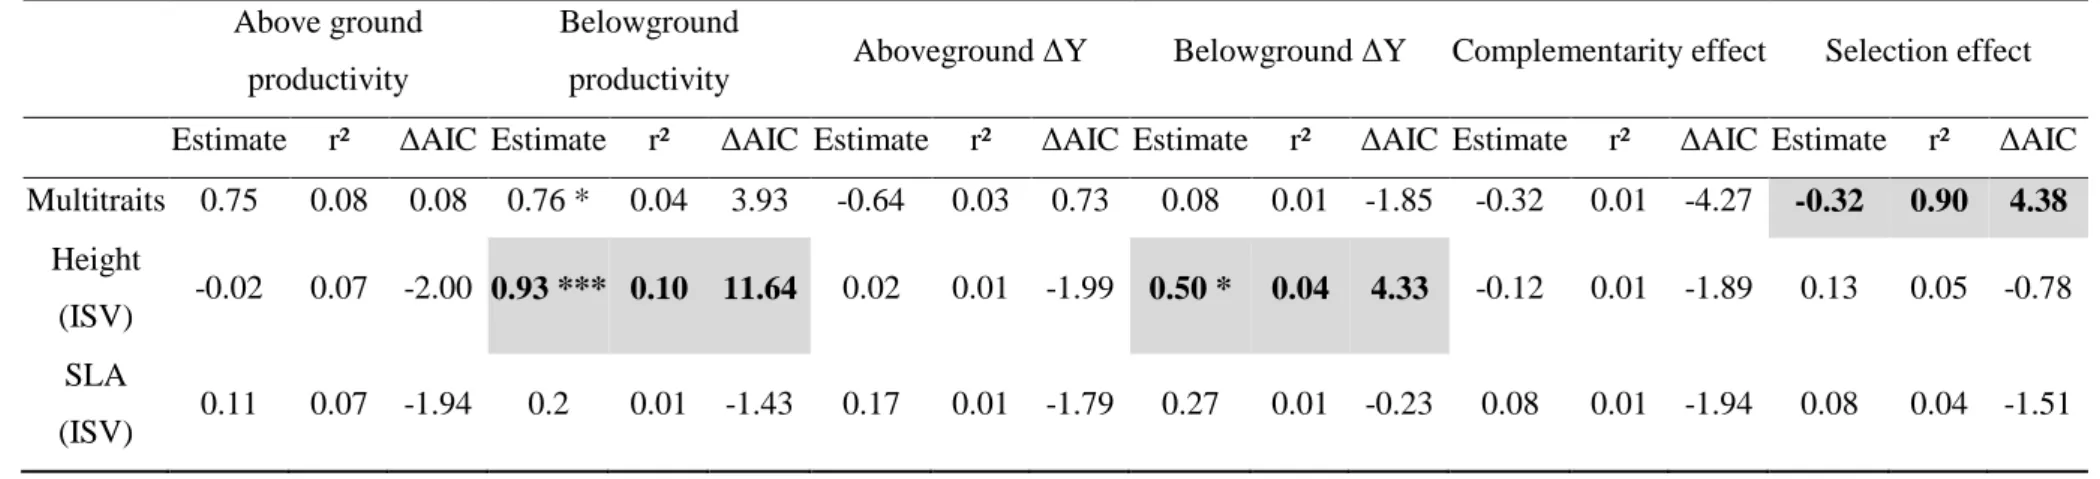
Table 2: Effects of functional group, functional dissimilarity, community weighted mean of trait (CWM) and species identity on biomass production
663
(productivity), biodiversity effects (net effect), complementarity effect and selection effect. 664
Above ground productivityBelowground productivity Aboveground net effect Belowground net effect Complementarity effect Selection effect Estimate ΔAIC r² Estimate ΔAIC r² Estimate ΔAIC r² Estimate ΔAIC r² Estimate ΔAIC r² Estimate ΔAIC r²
Functional group Legume 1.82 * 2.07 0.10 -2.27 *** 17.27 0.19 0.24 -1.92 0.01 -0.30 -1.58 0.00 0.87 -0.88 0.00 -0.63 * 3.42 0.03 Herbs -1.43 0.51 0.09 1.25 * 3.48 0.09 -1.42 0.85 0.02 -0.52 -0.73 0.01 -0.99 -0.55 0.00 -0.43 0.46 0.01 Forbs -0.53 -1.67 0.07 1.21 * 3.03 0.09 0.85 -0.99 0.00 0.94 * 2.24 0.04 0.73 -1.23 0.01 0.13 -1.79 0.02 Functional dissimilarity Height 0.37 -1.27 0.08 0.87 *** 9.57 0.09 -0.21 -1.66 0.01 0.27 -0.07 0.00 -0.30 -1.29 0.00 0.09 -1.49 0.04 SLA 0.47 -0.80 0.08 0.46 1.22 0.02 0.33 -1.20 0.02 0.44 * 3.12 0.03 0.30 -1.29 0.00 0.03 -1.94 0.04 Amax 0.20 -1.80 0.07 0.48 1.35 0.03 -0.44 -0.53 0.02 0.10 -1.76 0.02 -0.38 -0.84 0.00 -0.06 -1.73 0.04 SRL 0.20 -1.77 0.07 0.71 ** 6.18 0.06 -0.43 -0.62 0.02 0.18 -1.21 0.00 -0.31 -1.22 0.00 -0.12 -1.04 0.04 Nabs 0.60 -0.17 0.08 -0.090 -1.89 0.00 0.06 -1.98 0.01 -0.10 -1.74 0.02 0.15 -1.82 0.01 -0.10 -1.37 0.04 RHL 0.06 -2.52 0.07 0.350 * 3.68 0.04 -0.57 0.40 0.03 0.03 -1.97 0.02 -0.43 -0.55 0.00 -0.14 -0.67 0.05 DRF 0.54 -0.52 0.08 0.79 ** 7.04 0.07 -0.26 -1.50 0.01 0.14 -1.54 0.01 -0.07 -1.96 0.01 -0.19 0.51 0.06 RID -0.918 * 2.23 0.10 -0.214 -1.38 0.00 -1.29 *** 11.17 0.12 -0.60 ** 7.49 0.07 -1.17 *** 9.43 0.09 -0.12 -0.99 0.04 CWM Height 1.20 ** 7.47 0.14 1.46 *** 42.16 0.29 0.63 1.06 0.04 0.67 *** 10.35 0.90 0.61 1.08 0.02 0.02 -1.98 0.03 SLA -1.39 *** 10.74 0.16 -1.82 *** 73.88 0.45 -1.72 *** 23.53 0.21 -1.21 *** 43.58 0.33 -1.62 *** 21.73 0.19 -0.11 -1.19 0.04 Amax -1.02 * 4.78 0.12 -1.94 *** 90.60 0.52 -1.01 ** 6.13 0.08 -1.09 *** 33.99 0.27 -1.01 ** 6.64 0.07 -0.01 -1.99 0.03 SRL 0.47 -0.60 0.08 0.79 *** 9.40 0.09 -1.19 -1.73 0.01 0.19 -1.11 0.00 -0.13 -1.87 0.00 -0.06 -1.75 0.04 Nabs 0.31 -1.39 0.07 1.28 *** 29.91 0.22 1.17 ** 8.80 0.10 1.06 *** 31.22 0.25 1.19 *** 10.11 0.10 -0.03 -1.95 0.04 RHL -0.88 * 3.04 0.11 -0.26 -0.76 0.01 -1.20 *** 9.53 0.11 -0.57 ** 6.72 0.06 -1.05 ** 7.38 0.07 -0.15 -0.49 0.05 DRF 0.92 * 3.52 0.11 0.03 -1.99 0.01 1.18 ** 9.12 0.10 0.50 * 4.48 0.04 1.03 ** 7.02 0.07 0.14 -0.51 0.05 RID -0.41 0.92 0.08 0.42 1.17 0.02 -0.66 1.45 0.04 -0.26 -0.31 0.00 -0.47 -0.17 0.01 -0.19 0.76 0.06 Species identity B. erectus -2.31 ** 5.64 0.13 -0.186 -1.86 0.05 -1.07 -0.02 0.01 -1.10 ** 5.26 0.06 -1.11 0.26 0.01 0.04 -1.97 0.02 D. glomerata 0.46 -1.71 0.07 1.53 ** 7.44 0.12 -0.59 -1.41 0.01 0.27 -1.57 0.00 -0.21 -1.92 0.01 -0.38 0.33 0.00 P. lanceolata 3.89 *** 20.31 0.23 3.76 *** 69.21 0.47 3.79 *** 26.22 0.23 2.57 *** 45.97 0.37 3.71 *** 26.58 0.23 0.08 -1.89 0.17 S. minor -3.74 *** 19.03 0.22 -1.78 *** 11.04 0.15 -1.95 * 4.77 0.05 -1.05 * 4.61 0.06 -2.60 *** 11.00 0.11 0.64 ** 4.94 0.05 L. corniculatus -2.031 * 3.77 0.11 -1.58 ** 7.98 0.12 -1.19 0.41 0.01 -0.35 -1.28 0.00 -1.49 * 2.02 0.03 0.30 -0.55 0.00 T. repens 3.31 *** 19.93 0.22 -1.66 *** 9.27 0.13 0.98 -0.34 0.00 -0.35 -1.31 0.00 1.67 * 3.16 0.00 -0.69 ** 5.99 0.06 665
ΔAIC is the difference in AIC between M0 that accounts for the effect of species richness and models that further accounts for the effect of species functional 666
31 group, functional dissimilarity, CWM of traits or species identity. Data significantly supported the model if ΔAIC (i.e. difference in AIC value between baseline 667
model and a model accounting for either functional group, functional dissimilarity or species identity) >4 (bold values). *: p-value <0.05; **: p-value <0.01; 668
***: p-value <0.001. For the functional group and species identity models, estimates represent the effect of the presence of each functional group and species in 669
the mixture, respectively, while for the functional dissimilarity and CWM models, estimates represent the slope of the effect of increasing functional 670
dissimilarity (CWM) in the mixture. 671
32 672
Figure 1: Effect of species richness on mean (A) aboveground and root productivity and (B)
673
aboveground and belowground biodiversity effects and (C) aboveground complementarity and 674
selection effects. Differences across the richness gradients are tested using linear models. ***: 675
p<0.001; **: p<0.01; *<0.05; ns: non-significant. Barplots represent the 1st, 2nd and 3rd quartiles. 676
677 678 679 680
33 681
Figure 2: Species-specific effect on aboveground (red) and belowground (blue) productivity
682
(a), net effects (b) and complementarity (light grey) and selection (dark grey) effects on 683
aboveground productivity (c). Arrows represent significant effect of the presence of a species 684
and its direction (p<0.05). Barplots represent the 1st, 2nd and 3rd quartiles. 685 686 687 688 689 690 691 692 693 694 695 696
34 697
Figure 3: Variation of the intraspecific competition log-response ratio between species. We
698
computed log-response ratio between individual plant aboveground biomass in monoculture 699
sown at half-density (BiomassHdens) and individual plant aboveground biomass in monoculture 700
sown at full-density (BiomassFdens). Positive log-response ratio corresponded to higher 701
aboveground biomass for the individual of the monoculture sown at half-density. Barplots 702
represent the 1st, 2nd and 3rd quartiles. 703 704 705 706 707 708 709 710 711