HAL Id: halshs-00175039
https://halshs.archives-ouvertes.fr/halshs-00175039
Submitted on 26 Sep 2007
HAL is a multi-disciplinary open access archive for the deposit and dissemination of sci-entific research documents, whether they are pub-lished or not. The documents may come from teaching and research institutions in France or abroad, or from public or private research centers.
L’archive ouverte pluridisciplinaire HAL, est destinée au dépôt et à la diffusion de documents scientifiques de niveau recherche, publiés ou non, émanant des établissements d’enseignement et de recherche français ou étrangers, des laboratoires publics ou privés.
Male and Female Competitive Behavior: Experimental
Nabanita Datta Gupta, Anders Poulsen, Marie Claire Villeval
To cite this version:
Nabanita Datta Gupta, Anders Poulsen, Marie Claire Villeval. Male and Female Competitive Behav-ior: Experimental. 2005. �halshs-00175039�
IZA DP No. 1833
Male and Female Competitive Behavior:
Experimental Evidence
Nabanita Datta Gupta Anders Poulsen
Marie-Claire Villeval
DISCUSSION P
APER SERIES
Forschungsinstitut zur Zukunft der Arbeit
Male and Female Competitive Behavior:
Experimental Evidence
Nabanita Datta Gupta
Danish National Institute of Social Research and IZA Bonn
Anders Poulsen
University of East Anglia
Marie-Claire Villeval
GATE (CNRS, University Lumière Lyon, ENS) and IZA Bonn
Discussion Paper No. 1833
November 2005
IZA P.O. Box 7240 53072 Bonn Germany Phone: +49-228-3894-0 Fax: +49-228-3894-180 Email: [email protected]Any opinions expressed here are those of the author(s) and not those of the institute. Research disseminated by IZA may include views on policy, but the institute itself takes no institutional policy positions.
The Institute for the Study of Labor (IZA) in Bonn is a local and virtual international research center and a place of communication between science, politics and business. IZA is an independent nonprofit company supported by Deutsche Post World Net. The center is associated with the University of Bonn and offers a stimulating research environment through its research networks, research support, and visitors and doctoral programs. IZA engages in (i) original and internationally competitive research in all fields of labor economics, (ii) development of policy concepts, and (iii) dissemination of research results and concepts to the interested public.
IZA Discussion Papers often represent preliminary work and are circulated to encourage discussion. Citation of such a paper should account for its provisional character. A revised version may be
IZA Discussion Paper No. 1833 November 2005
ABSTRACT
Male and Female Competitive Behavior:
Experimental Evidence
*Male and female choices differ in many economic situations, e.g., on the labor market. This paper considers whether such differences are driven by different attitudes towards competition. In our experiment subjects choose between a tournament and a piece-rate pay scheme before performing a real task. Men choose the tournament significantly more often than women. Women are mainly influenced by their degree of risk aversion, but men are not. Men compete more against men than against women, but compete against women who are thought to compete. The behavior of men seems primarily to be influenced by social norms whose nature and origin we discuss.
JEL Classification: C70, C91, J16, J24, J31, M52
Keywords: competition, tournament, piece rate, gender, risk-aversion, relative ability, experiment
Corresponding author:
Marie-Claire Villeval GATE
93, Chemin des Mouilles 69130 Ecully
France
Email: [email protected]
*
Earlier versions of this paper were presented at the ESA 2005 International meeting in Montreal, Max Planck Institute workshop in Ringberg – Tegernsee, at the Tinbergen Institute, Amsterdam, and at the
1. Introduction
Men and women differ in many important respects, such as having different jobs and being in different occupations. They also work under different incentive systems, with
females considerably more often than men working under piece rate pay schemes.2
Relatively few women hold top corporate positions, although in many countries women’s educational attainment now exceed men’s3. Women are also less likely to run for elections and they represent a low percentage in national parliaments.
In explaining these and other observed gender differences, economists have offered supply and demand side explanations. Supply side explanations usually emphasize the role of women in the family, which affects their human capital investment and career choices (Mincer and Polachek, 1974; Polachek, 1981). Demand side explanations focus on employer and employee discrimination. We refer the reader to Altonji and Blank (1999) for a review of these theories, Neumark, Blank, and Van Nort (1996) or Goldin and Rouse (2000) for empirical evidence.
This paper investigates the extent to which these and similar observations can be explained by men and women differing in their competitiveness. By competitiveness we mean the propensity to prefer to be rewarded based on relative performance (such as a tournament), rather than being rewarded on the basis of one’s own performance only (such as a piece rate).
We set up a laboratory experiment, in which each subject, before performing a task, is matched with a co-participant and then chooses between being paid by a piece rate payment scheme or being paid by a tournament payment scheme. Once he has chosen
2
See Goldin (1986), Brown (1990), Heywood, Siebert and Wei (1997), Heywood and Jirjahn(2002), and Jirjahn and Stephan (2004).
3
his payment scheme, the subject learns his co-participant’s payment scheme choice, and then they perform a real task, as in Gneezy, Niederle and Rustichini (2003). If the subject chooses the piece rate payment scheme, he gets a certain payment per unit of output, so his reward depends on his own performance only. If he chooses the tournament payment scheme, he gets a higher payment per unit output, but only if he performs better than his participant, otherwise he receives a low payment. If the co-participant chose the piece-rate, a subject who chooses the tournament gets the high payment per unit of output.
Our design captures, we believe, the essential properties of many competitive situations, such as: deciding whether to choose a low-pay-low-risk or a high-pay-high-risk job or occupation; deciding whether or not to exert effort to be promoted or to apply for a better paid job; and deciding whether or not to take part in a contest or election, in order to get a prize or a mandate. Our experiment contributes to a supply side explanation for observed male and female differences in such situations. There is no role for demand side factors, such as employer and customer discrimination – these are controlled away.
In the experiment, 60% of men, but only 34% of women, choose the tournament payment scheme. To check the robustness of this gender gap, we create an additional treatment where we increase the expected monetary payoff from the tournament relative to that of the piece rate. Both men and women choose the tournament more frequently, but men still choose the tournament significantly more than women. Thus males and females react to changes in the economic incentives. It is not the case that ‘women just don’t like to compete’. But the gender gap in competitiveness persists.
What causes these observed gender differences in payment scheme choice? Men and women can differ in their degree of risk aversion (see, for example, Charness and Gneezy, 2004 and Croson and Gneezy, 2004). Second, men and women might have different beliefs about their ability relative to that of their co-participant. Third, men and women can hold different beliefs about their co-participant’s payment scheme choices. If an individual thinks that her co-participant will choose the piece rate, she should choose the tournament even if she believes she could be worse at performing the task than the co-participant.
A key feature of our experiment is that we provide a subject with information about her co-participant’s gender. This allows us to see whether males and females hold different beliefs about relative ability and about other people’s payment scheme, and whether these beliefs vary with the co-participant’s gender.4 We can then measure the impact of risk aversion and the impact of these beliefs on male and female behavior. We find that risk does not matter for men when they choose their payment scheme. But the women who choose the tournament are significantly less risk averse than those who chose the piece rate. Second, while beliefs about the co-participant’s payment scheme choice do not influence womens’ payment scheme choice, it affects men’s, and the effect depends on the opponent’s gender. Men are more likely to choose the tournament when matched with a man than when matched with a woman. And when matched with a woman, the more likely the man believes the woman is to choose the tournament, the more likely he himself is to choose the tournament. Third, both men and women tend to believe that males are better at the task than women, and the typical
4
The influence of other people’s gender has mainly been studied in bargaining situations (see, for example, Ayres and Siegelman, 1995 and Eckel and Grossman, 2001), in prisoner’s dilemma games (Rapoport and Chammah, 1965), or in coordination games (Holm, 2000).
man and woman believe they are better at performing the task than the average subject. But neither men nor women condition their payment scheme choice on these beliefs about relative ability.
In our experiment a subject is exogenously matched with a man or a woman, i.e., people can not influence the gender distribution of their group. But if we increase the subjects’ control over their environment by allowing subjects to choose their co-participant, this may cause the tournament payment scheme to appear less risky and more attractive. To investigate this, we ran a treatment where subjects could choose to interact with a male or a female co-participant before making their other decisions as before.5 Interestingly, we observe that women are more willing to compete than when the pairing procedure is exogenous, both when they choose to be paired with a woman and with a man, although only the first difference is marginally significant. One likely explanation is that women may become more confident about competing per se against a female when they have better control over the environment.
An analysis of how well men and women performed the task itself also reveals interesting gender differences. First, while men are in general somewhat better at the task than women, this difference is significant only when a subject is the only one to have chosen the tournament, i.e., the co-participant chose the piece rate. Second, while the performance of women does not vary significantly with the payment scheme chosen, the effort of men increases as soon they have chosen the tournament. Moreover, when both a man and his co-participant chose the tournament, if the co-participant is a woman the man works significantly less than if he is confronted with a man. We interpret this as an expression of chivalry (see also e.g. Eckel and Grossman, 2001). In summary, males
5
Slonim (2005) is to our knowledge the only other experiment where subjects, in a trust game, can choose to interact with men or with women.
condition their decisions on other peope’s gender not only when making their payment scheme choice, but also when actually performing the task.
Our results show that men and women differ in the considerations that influence their behavior. Women are primarily ‘internally’ oriented when choosing their payment scheme: they base their payment scheme choice on their attitude to risk. Men, on the other hand, are ‘externally’ oriented and seem to be influenced by a norm or convention according to which they ‘must’ compete against other men and ‘must’ compete against women who are thought to compete. We discuss and interpret these findings in Section 5 below.
The rest of the paper is organized as follows. Section 2 describes the existing experimental literature. Section 3 explains the experimental design. In Section 4 we give our main findings and report on the econometric analysis. Section 5 discusses the results. Section 6 concludes.
2. Related experimental literature
Our paper adds to a small and very recent experimental literature in economics studying male and female competitive behavior. This research was initiated by Gneezy, Niederle and Rustichini (2003). In their experiment, subjects performed a maze solving task under an exogenous piece rate or under an exogenous tournament payment scheme. Their basic finding was that men solved significantly more mazes under the tournament than in the piece rate scheme, whereas the performance of women was not significantly different. Women did not work significantly more. They also found that women worked harder when placed in an all-female group compared to a mixed gender group. Gneezy and Rustichini (2004), using a field experiment with school children racing against each
other (and with no monetary rewards), obtained essentially the same result: boys perform better (run faster) than girls when racing against someone else, but boys’ and girls’ performance is the same when the children run alone.
Our experiment differs crucially from Gneezy, Niederle, and Rustichini (2003) and from Gneezy and Rustichini (2004) in that subjects in our design choose their payment scheme before performing the task. Thus, rather than experimentally endogenizing performance under an exogenously given payment scheme, we go one step further and endogenize the payment scheme choices themselves.
In Niederle and Vesterlund (2005), subjects also choose between a piece rate and a tournament pay scheme before they perform a task. The task consists of adding up sets of five two-digit numbers. They find like us a gender gap in tournament choice. This gap cannot be explained by performance. Moreover, even though men are more overconfident than women about their relative ranking in their group, a large gender gap remains after controlling for these differences.
Although related, there are some important differences between their and our design, concerning gender information and how the competitive situation is modeled. First, Niederle and Vesterlund do not consider the effect on a person’s payment scheme of knowing the co-participants’ gender (in their design, groups always consist of two men and two women). Second, in their experiment beliefs about what payment schemes other people chose can, by construction, play no role for a person’s own payment scheme choice. In terms of our design, it is as if a person knows that the co-participant always chooses the tournament. This feature follows from their experimental design: all subjects first perform the task under the piece rate pay scheme. Then, at a second stage, all work under a tournament pay scheme. Finally, at the third stage subjects choose
between the two payment schemes, and a person who chooses the tournament wins if she performs better than those who worked under the tournament in the second stage. Note that in their design several people can win the competition.
Whereas Niederle and Vesterlund thus deliberately eliminate the role of beliefs about other people’s payment scheme choices and focus on the role of beliefs about relative ability, in our experiment observed differences can result from both factors, and we are able to measure the relative impact of each factor. Indeed, as mentioned above, we observe that the behavior of men matched with women depend significantly on the men’s beliefs about what payment scheme the women will choose.
The competitive situation that we model thus differs from the one in Niederle and Vesterlund (2005). In our experiment, the winner of the competition is the person who performs best relative to those persons who also chose to compete in the tournament, and only a single person can win. In Niederle and Vesterlund’s experiment, the performance of someone who chooses to compete is compared with the ‘baseline’ performance of all persons, including those who did not enter the competition, and hence several people can win the competition. One can say that the design in Niederle and Vesterlund has higher internal validity than ours, since beliefs about other people’s payment scheme choices are controlled away in their experiment. But our design probably has higher external validity than theirs, in the sense that, as just argued above, we analyze a more realistic competitive situation, the classic tournament, where the winner is selected from the subgroup of people who chose to compete.
In Vandegrift, Yavas, and Brown (2004), subjects face a twenty period decision problem. In each period a subject choose between a piece rate and a tournament pay scheme, and then perform a forecasting task. Their main finding is that, controlling for
skills, gender does not explain payment scheme choice when the tournament has the (usual) winner-take-all payoff rule. Men choose the tournament more than women, because men are more able at the task. But when there are several prizes in the tournament, men choose the tournament more often than women, even after controlling for abilities.
The design by Vandegrift, Yavas, and Brown allows subjects to learn their actual relative ability since they face the same task a number of times. In contrast, we use a one-shot game where the entry decision is made only once, and where only beliefs about relative ability can matter. The two designs thus address quite different decision problems. Our design captures economic situations in which people are not allowed to frequently repeat their decisions and in which they therefore cannot easily learn their relative ability, such as in promotion applications or anonymous contests.
3. Experimental design
In the following we describe the game that subjects play, how we measure risk aversion, subjects’ beliefs about relative ability, and their beliefs about other people’s payment scheme choices.
3.1. The game
Participants are randomly matched in pairs, and each receives information about the other’s gender (see below). They then simultaneously choose between a piece rate payment scheme and a tournament payment scheme. Each individual is informed about her co-participant’s choice and then performs a maze solving task, described below.
Payoffs. If an individual chooses the piece rate pay scheme, she is paid 4 points for
every maze she subsequently solves. If she chooses the tournament, one of two cases occurs:
• If the co-participant also chose the tournament, the subject who produces most mazes receives 6 points for every maze solved. The other subject receives 1 point for every maze solved. In case of a tie, the winner is randomly selected.
• If the co-participant chose the piece rate, the subject who chose the tournament receives 6 points for every maze she solves. In other words, if a player is the only one who chose to compete, she automatically wins the competition and receives the high payment. Note also that the our payments are not fixed prizes, but a payment per solved maze.
After the subjects have solved mazes for fifteen minutes, the individual is informed about the number of mazes she has solved and about her payoff, but she does not learn how many mazes the co-participant solved.
The task. We looked for a task that was as gender neutral as possible. In Gneezy,
Niederle, and Rustichini (2003), subjects solved mazes for fifteen minutes, and they found no gender differences in performance under a piece rate scheme. We therefore adopt the same task.
Among the mazes available at http://www.games.yahoo.com/games/maze.html, we selected fifty mazes, all of the same difficulty level. All the subjects, in all sessions, receive the same mazes in the same order and this is made common knowledge. On the computer screen (see Figure 1), a marker indicates the current position in the maze and it is possible to restart from any point already reached. A maze is solved as soon as the
subject reaches the red point. A maze can be given up before being solved, and the subject creates a new maze appear by clicking the ‘next’ button. The screen also indicates the number of mazes already solved and the time spent since the beginning of the task.
Figure 1. The maze task
Before being informed of the rules of the game, subjects practice the task by solving three mazes without any explicit time constraints.
Providing information about gender We make information about gender available in
order to allow people to condition their beliefs and behavior on the co-participant’s gender. After two individuals are randomly paired, and before payment schemes are
chosen, each subject is given a randomly chosen pseudonym from one of two lists6,
according to the subject’s own gender. Each subject is then informed about the
6
Subjects stated their gender in a pre-experimental anonymous questionnaire which also included questions on school, major, year in school, age, and previous participation in experiments. The pseudonyms correspond to the top ten baby names for each gender in 2003 (RNIPP and INSEE Répertoire National d’Identification des Personnes Physiques). Female names are Chloe, Clara, Emma, Aurelia, Lea, Manon, Marie, Océane, Sarah, Carla. Male names are Alexandre, Antoine, Clement, Enzo, Hugo, Lucas, Maxime, Quentin, Theo, and Thomas. A similar procedure is used in psychology (see Ingram and Berger, 1977).
participant’s pseudonym. We use this procedure to preserve anonymity, and to minimize biases, such as subjects changing their behavior just because they suspect that the experiment was about gender.7
3.2. Measuring Risk Aversion
Risk aversion can naturally influence the decision to choose the tournament pay scheme.8 To measure risk aversion, we use a modified version of the psychometric test in Weber, Blais, and Betz (2002). In a post-experimental questionnaire (see Appendix 2) subjects rate the likelihood that they would engage in sixteen domain-specific risky activities, on a five-point scale ranging from 1 (”extremely unlikely”) to 5 (”extremely likely”). A subject’s risk attitude score is computed by summing up her answers to these sixteen items. The higher the score, the more risk-loving the subject is.
We decided not to use lottery choices to elicit risk attitudes, because any regret felt from choosing the tournament would be likely to influence the lottery choices. Organizing the lottery before starting the game would have focused attention on the risk associated with the tournament choice and could have biased behavior. A psychometric scale is a more neutral elicitation method in this context. In addition, compared to the traditional lottery elicitation procedures, this method seems to give more stable results (Eckel, 2005).
7
Gender is typically revealed in experiments via visual contact (see, e.g., Cadsby and Maynes, 1998; Eckel and Grossman, 2001, 2003; and Gneezy, Niederle and Rustichini, 2003) or mentioned in the instructions (Holm, 2000).
8
See, e.g., Croson and Gneezy (2004) for a survey. In experiments women have been found to be more risk averse than men in financial decision-making (Eckel and Grossman, 2003, Powell and Ansic, 1997; Barsky, Juster, Kimball, and Shapiro, 1997). Women also invest less (Charness and Gneezy, 2004) or do so more conservatively (Jianokoplos and Bernasek, 1998).
3.3. Measuring Beliefs about Relative Ability
Intuitively, the more able a person believes she is at solving mazes relative to the co-participant, the more likely the person should be to choose the tournament. Any gender difference in the choice of the tournament in our experiment could result from men and women differing in such beliefs.9
We measure subjects’ beliefs about relative ability as follows. After the three practice mazes, and before they are informed about the game, subjects report the number of mazes they estimate they can solve in fifteen minutes. This provides us with a measure of subjects’ belief about their own ability. Then, at the end of the session, subjects estimate (separately) the average performance of men and women in their session. Each accurate answer gives 1 Euro. By computing the difference between these estimates, we obtain a measure of subjects’ beliefs about their relative ability, both relative to a male co-participant and relative to a female co-participant.
3.4. Measuring beliefs about payment scheme choices
After having performed the task and received payoffs, each subject is asked to predict the number of men and the number of women in the session who chose the tournament. For each correct answer a subject is paid 1 Euro.
Collecting these data allows us to see whether men and women differ in their beliefs about men and women’s payment scheme choices, and to see how accurate these beliefs
9
Overconfidence can give excess entry in competition (Camerer and Lovallo, 1999). Also, exaggerating their control over events, a majority of individuals are unreasonably optimistic about their future (Taylor and Brown, 1988) or they overestimate the precision of their knowledge (Lichtenstein, Fischhoff, and Phillips, 1982); or they think their performance is above the median (Kahneman and Lovallo, 1993). Men have been shown to be more overconfident than women in investment decisions (see Barber and Odean, 2001).
are.10 Second, we can see if these beliefs influence people’s own payment scheme choices.
3.5. Logistics
The experiment was conducted in the experimental laboratory of GATE (Groupe d’Analyse et de Théorie Economique) in Lyon, France, using the REGATE software (Zeiliger, 2000). Overall 240 students (119 men and 121 women) participated in 12 sessions. These subjects were recruited from undergraduate classes of three business and engineering schools (86%) and from several Lyon universities (14%).
Each session involved 20 subjects each, with at least 9 subjects of the same gender per session. 50 mixed pairs, 40 female pairs, and 30 male pairs were matched, the difference being due to the special nature of one of the treatments, described below. The main treatment involved 50 women and 50 men.
Upon arrival, a subject was randomly assigned to a computer. They received the first part of the instructions describing the nature of the maze solving task. Then subjects practiced by solving 3 mazes without any specified time constraint. The second part of the instructions was then distributed. This explained how payment schemes were chosen, explained the performance stage, and how payoffs were determined. The subjects filled out a questionnaire to check their understanding and any questions were answered in private.
Each person then received a pseudonym, was randomly matched with another subject, and learned the co-participant’s pseudonym. Subjects chose their payment scheme and received feedback on their co-participant’s decision. After this, each subject performed
10
Previous research has shown that people may suffer from “competitive blind spots” (i.e., a tendency to underestimate the competitiveness of the environment. See Camerer and Lovallo (1999).
the task for 15 minutes (without any feedback about the co-participant’s performance). Subjects were then informed about their payoff, but not about the co-participant’s performance. Following that, subjects were asked to predict the number of men and women who chose the tournament, and predicted the average performance of males and of females. Finally, participants completed the risk attitude questionnaire.
On average a session lasted 70 minutes. The participants were paid at the rate 1 point = .25 Euro. In addition they were paid a show-up fee of 2 Euro, plus 2 Euro for the questionnaire on risk attitudes, and up to 4 Euro for accurate predictions of the payment scheme and of average performance of males and females. On average, women earned 16.6 Euro (standard deviation 5.4), and men earned 18.8 Euro (standard deviation 7.6). Subjects were paid in cash in a separate room.
4. Results
In the base treatment, we observe a large gender gap in tournament entry: 34 % of women and 60 % of men choose the tournament pay scheme. The percentage of women choosing the tournament is significantly lower than the 50 % percentage that would have been expected if choices were random (proportion test: p=0.011) and the corresponding percentage of men is significantly higher than 50% (proportion test: p=0.078). The gender gap is statistically significant (a chi-square test yields p=0.009 and a one-sided Fisher’s exact test yields p=0.008).
4.1 A robustness check
How robust are the observed payment scheme choice differences? One way to do a robustness check is to change the payoffs from the tournament relative to those from the piece rate and see if the observed male and female differences persist. In three new
sessions, involving 30 women and 30 men, we raised the expected money payoffs from choosing the tournament and lowered that from choosing the piece rate. In the tournament, the loser’s payment was increased from 1 to 1.5 points per solved maze. The piece rate payment was reduced from 4 to 3 points per maze solved. We thus reduce the riskiness of the tournament choice. This is the only difference from the previous experiment.
The percentages of men and women choosing the tournament are now 93.33 and 63.33 respectively, whereas before they were 60 and 34. There is still a large gender gap in the choice of the tournament pay scheme (chi-square test: p=0.005; Fisher’s exact test: p=0.005). Chi-square tests regarding the within-gender comparison show that the differences between treatments are statistically significant (p=0.011 for women and p=0.001 for men). Fisher’s exact tests deliver similar conclusions (p=0.010 for women and p=0.001 for men). See Table 1 and Figure 2 below. This table also contains the data for how men’s and women’s payment scheme choices vary with the opponent’s gender; we comment on these numbers below.
We can interpret the data from the two treatments as follows. Women’s propensity to compete can be increased by raising the relative economic payoffs from competing. But the same policy also makes men more competitive, and the differences between male and female competitive choice behavior remain much the same as before. There is still a large gender gap in the choice of the tournament pay scheme. In short, women do not systematically avoid competition, but they need more incentives than men to reach a given level of entry into the competitive pay scheme.
Table 1. Distribution of payment scheme choices according to gender, co-participant’s gender, and treatment
Gender of the subjects Women Men
Gender of the co-participant Woman Man Total Woman Man Total
Payment scheme choices in the Base Treatment
Tournament 11 (34.4) 6 (33.3) 17 (34.0) 10 (55.6) 20 (62.5) 30 (60.0) Piece-rate 21 (65.6) 12 (66.7) 33 (66.0) 8 (44.4) 12 (37.5) 20 (40.0) Total 32 (100) 18 (100) 50 (100) 18 (100) 32 (100) 50 (100)
Payment scheme choices in the Increased Incentives Treatment
Tournament 13 (65.0) 6 (60.0) 19 (63.3) 10 (100) 18 (90.0) 28 (93.3) Piece-rate 7 (35.0) 4 (40.0) 11 (36.7) 0 (0.0) 2 (10.0) 2 (6.7) Total 20 (100) 10 (100) 30 (100) 10 (100) 20 (100) 30 (100) Note: Percentages in parentheses.
10,00 20,00 30,00 40,00 50,00 60,00 70,00 80,00 90,00 100,00
Original incentives Increased incentives
Women M en
Figure 2. Percentages of men and women choosing the tournament in the base and in the additional treatment
4.2. Explaining the gender gap in tournament choice
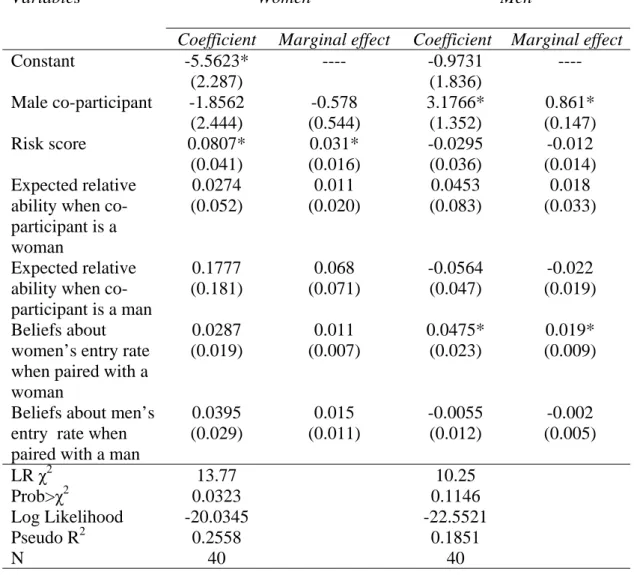
In this section we present the results of an econometric analysis. We use a Probit model, with a separate regression for each gender, see Table 2. The dependant variable is the probability to choose the payment scheme. Explanatory variables are:11
• The subject’s risk score, obtained from the psychometric test presented earlier. This score measures how risk loving the subject is. The higher the score, the more likely the subject is to engage in risky activities.
• The expected relative ability of the co-participant, conditional on the latter’s gender. The “expected relative ability when paired with a woman (man)” variable reported in Table 2 equals the difference between i) the subject’s expectations about own maze solving performance and ii) his or her belief about the average performance of women (men) if the subject is paired with a woman (man).12
• The beliefs about the co-participant’s payment scheme choice, again conditional on the co-participant’s gender. The “belief about the entry rate when paired with a man
11
Other models were estimated in which we used measures of confidence such as beliefs about own ability or the degree of optimism (i.e., the difference between predicted and actual individual performance). We also built a measure of the ”better than the average” belief by only considering positive values of the ”expected relative ability” variable. The predictive power of the model was not, however, increased and these variables were not significant. Furthermore, a number of background subject characteristics such as age, school type (management, engineering, economics), experience (whether participated in an experiment before) were tried in these regressions, but were found not to have additional explanatory power.
12
A subject states his belief about men’s (women’s) performance after he has solved mazes. We chose to avoid the alternative, i.e., measuring beliefs about relative ability before solving mazes or before choosing payment the scheme, because that might have focused subjects’ attention on gender issues. Our choice does introduce a bias: Suppose a subject and the co-participant both chose the tournament. Then, if the subject wins (loses), this may cause him to over(under)estimate his relative ability, relative to the average man/woman. We chose, however, to accept this bias in return for avoiding the, we believe more serious gender-focus bias, described above.
(woman)” variable shown in Table 2 below is the proportion of men (women) that a subject matched with a man (woman) believes have chosen the tournament.13
• The co-participant’s gender. We introduce this separate gender variable to capture any influence of the co-participant’s gender on payment scheme choice that is not related to beliefs about relative ability or to beliefs about the co-participant’s payment scheme choice.
4.2.1 Women’s decisions Women condition their payment scheme choice on their
risk score. They are more likely to choose the tournament the higher is their risk score, i.e., the more risk loving they are. Women do not consider their co-participant’s gender
when choosing payment scheme.14 Similarly, women’s payment scheme choices do not
vary with their beliefs about relative ability or with their co-participant’s likely payment scheme choice.
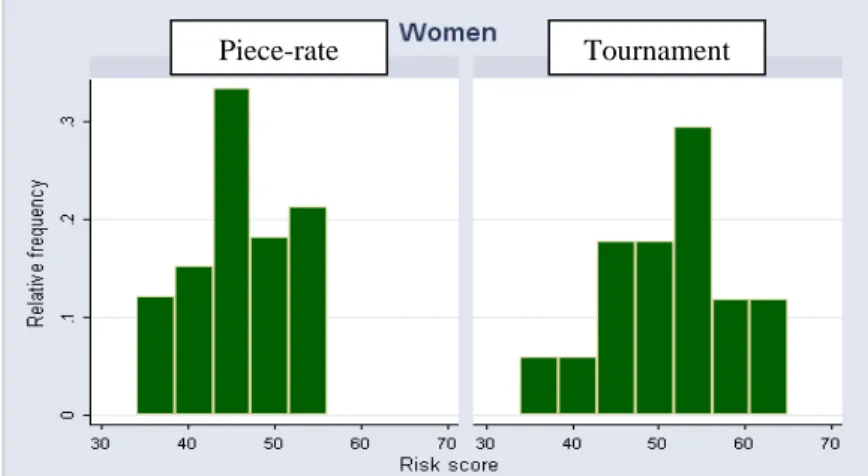
Considering the risk score distributions for men and women, we find that the average risk score is higher for men (mean 49.2, S.D. 6) than for women (mean 48.2, S.D. 7). The difference is, however, not significant according to a two-sample Kolmogorov-Smirnov test for equality of distribution functions (exact p=0.869). Figures 3 show the risk score distributions for women and men, conditional on their payment scheme choice.
13
We measured these beliefs after the subject received feedback about the co-participant’s choice. A subject thus knew the actual decisions of 2 subjects out of 20 in the lab. To check the significance of this potential bias, we ran two additional sessions where subjects stated their belief about their co-participant’s choice after they have made their own payment scheme choice but before they learned the co-participant’s choice. They were paid 1 Euro for an accurate answer. The results remain the same: 62.5 % of the women who believed that their pair member, irrespective of his/her gender, chose the tournament chose the tournament too, whereas none of those who believed that their co-participant chose the piece rate chose the tournament. The corresponding rates for men are 50% and 50%.
14
As shown in Table 1, women’s entry rate into the tournament is 34.4 when paired with another woman, and 33.3 when paired with a man. This difference is not significant (chi-square test: p=0.941; Fisher’s exact test: p=0.597).
Table 2. Tournament pay scheme choice (Probit model)
Women Men Variables
Coefficient Marginal effect Coefficient Marginal effect
Constant -5.5623* (2.287) ---- -0.9731 (1.836) ---- Male co-participant -1.8562 (2.444) -0.578 (0.544) 3.1766* (1.352) 0.861* (0.147) Risk score 0.0807* (0.041) 0.031* (0.016) -0.0295 (0.036) -0.012 (0.014) Expected relative
ability when co-participant is a woman 0.0274 (0.052) 0.011 (0.020) 0.0453 (0.083) 0.018 (0.033) Expected relative ability when co-participant is a man 0.1777 (0.181) 0.068 (0.071) -0.0564 (0.047) -0.022 (0.019) Beliefs about
women’s entry rate when paired with a woman 0.0287 (0.019) 0.011 (0.007) 0.0475* (0.023) 0.019* (0.009)
Beliefs about men’s entry rate when paired with a man
0.0395 (0.029) 0.015 (0.011) -0.0055 (0.012) -0.002 (0.005) LR χ2 13.77 10.25 Prob>χ2 0.0323 0.1146 Log Likelihood -20.0345 -22.5521 Pseudo R2 0.2558 0.1851 N 40 40
Note: standard errors in parentheses; * significant at 5% level.
The women who choose the tournament are significantly more risk-loving than the women who choose the piece rate (means 52 and 46.3 respectively, S.D. 7.3 and 6; Kolmogorov Smirnov test: exact p=0.085). In contrast, the men who choose the tournament are as risk-loving as those who choose the piece-rate scheme (mean 49.3 and 49, respectively, S.D. 6.3 and 6.4; Kolmogorov Smirnov test: exact p=0.993).
Variations in risk preference thus contribute to explain variations in women’s choices, but not men’s.15
Piece-rate Tournament
Figure 3a. Distribution of risk scores by payment scheme (Women)
Piece-rate Tournament
Figure 3b. Distribution of risk scores by payment scheme (Men)
4.2.2 Men’s decisions Unlike women, men’s payment scheme choices depend on the
co-participant’s gender. Other things equal, men are more likely to choose the tournament when matched with a man than when matched with a woman. From the raw data in Table 1, men’s entry rate into the tournament when matched with a man or a woman is 62.5 and 55.6, respectively.
15
If our risk attitude elicitation method underestimated gender differences compared to a method based on lottery choices, we should expect that this difference in choices conditional on the risk score would be even larger.
Moreover, the higher the proportion of women believed to enter the tournament by a man who is matched with a woman, the more likely this man is to choose the tournament himself. But when matched with another man, he tends to choose the tournament regardless of his belief about how many men chose the tournament. Thus men tend to compete against women only if they believe that the women are going to compete - or, in other words, men compete against women if men believe the women will conform to what men expect to be typical male behavior.
4.2.3 Similarities between men and women
Beliefs about payment scheme choice conditional on gender Women and men on
average share the same beliefs about women’s likelihood of choosing the tournament
payment scheme (45% and 43.6%, respectively; MWU test16: p=0.418). The same
applies to beliefs about men (67.9% and 62.5%, respectively; p=0.410). The actual percentages of women and men choosing the tournament are 34% and 60%. We can therefore not explain the gender gap in competition by differences in beliefs about the co-participant’s payment scheme choice. And men are not more likely than women to choose the tournament because men suffer more than women from ‘competitive blind spots’, i.e., ignoring that other people may also choose to compete. Indeed, comparing the stated beliefs with the actual percentages of men and women choosing the tournament shows that both men and women slightly overestimated how many would compete.
Beliefs about relative ability The econometric analysis shows that neither women nor
men condition their payment scheme choices on beliefs about relative ability. In addition, the raw data show that, first, men and women have the same beliefs regarding
16
their own expected performance (MWU test: p=0.541): Men and women expect to solve 14.5 and 14 mazes, respectively (S.D. 5). Those who choose the tournament are not more optimistic than the others (MWU tests: p=0.984 for men and p=0.441 for women). Second, on average, women believe that men solved 11 and other women solved 9.4 mazes (S.D. 3, Wilcoxon test: p=0.000); men believe that other men solved 11.6 mazes and women solved 9.9 mazes (S.D. 2 and 3, Wilcoxon test: p=0.000). Average men’s and women’s predictions about either female or male ability are thus similar (MWU test: p=0.274 and p=0.19, respectively), and so men and women have similar beliefs about their higher relative ability, both when matched with a man (MWU test: p=0.319) or when matched with a woman (p=0.831). In each case the typical man and woman believes he/she is better than his/her co-participant.
4.3 Task performance
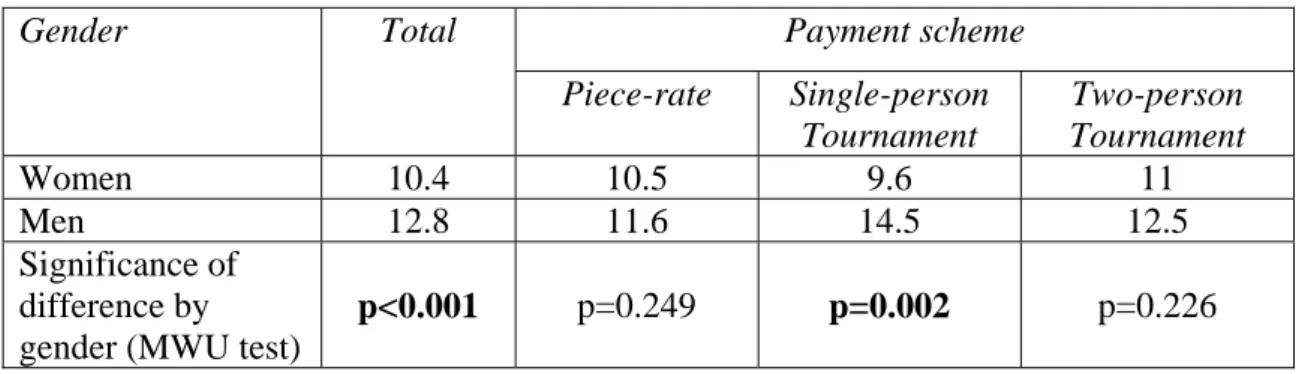
The average number of mazes solved by women and men is 10.4 and 12.8 mazes, respectively (S.D. 3 mazes). The difference is significant (see Table 3). To consider effort in more detail, we distinguish between the situation where a subject was the only one to choose the tournament (a ‘single-person tournament’), and the case where both a subject and the co-participant chose the tournament (a ‘two-person tournament’). Table 3 gives an overview.
Table 3: Average task performance (number of solved mazes)
Payment scheme Gender Total Piece-rate Single-person Tournament Two-person Tournament Women 10.4 10.5 9.6 11 Men 12.8 11.6 14.5 12.5 Significance of difference by gender (MWU test)
The only significant gender difference in the number of mazes solved is in single-person tournaments, where men perform better than women. In the piece-rate scheme and in two-person tournaments men and women perform equally well.
Table 4 shows separate OLS regressions of task performance (number of mazes solved) by gender in which the mode of payment (piece rate or tournament) is treated as exogenous.17 The “choice of tournament” variable is coded 1 if the subject has chosen the tournament, and 0 otherwise. The “two-person tournament” is coded 1 when, conditional on a subject having chosen the tournament payment scheme, the co-participant chose the tournament too, and is coded 0 otherwise. The “two-person tournament with a male competitor” is coded 1 when both a subject and the co-participant chose the tournament and when the co-co-participant is a man.
Women’s task performance does not depend on the chosen payment scheme. Moreover, when a woman is involved in a two-person tournament, the co-participant’s gender has no significant influence. It is only those women who feel more confident at the task (i.e., who report a higher expected absolute ability) who perform better under all payment schemes.
Men solve more mazes as soon as they have chosen the tournament, independently of whether they find themselves in a single or in a two-person tournament. Moreover, men work harder in a two-person tournament against other men than against women. Indeed, a closer look at the raw data shows that the men who are in a two-person tournament solve fewer mazes when the participant is a woman (9.0) than when the
17
We initially estimated a model in which the choice of payment scheme was endogenous to performance based on a treatment-effects model using full-information maximum likelihood methods. Thus, tournament choice was the endogenous treatment dummy and number of mazes solved the continuous outcome variable. The results showed that the two processes could be treated independently. In addition, a Poisson regression of the count variable (number of mazes solved) yielded comparable estimates as those reported in Table 4.
participant is a man (13.4). Moreover, since women solve 12.0 mazes when matched with a man in a two-person tournament, the women outperform the men in these situations.
Table 4. Task performance (OLS model)
Variables Women Men
Constant 7.0880** (1.287) 8.1457** (1.334) Choice of tournament -1.4163 (1.086) 2.5705* (1.031) Two-person tournament 2.3889 (1.856) -4.4765* (1.929) Two-person tournament with a
male competitor
-0.5644 (2.403)
4.0618* (1.940)
Expectations about own ability 0.2502**
(0.086) 0.2366** (0.079) Prob>F 0.0535 0.0009 R2 0.1836 0.3333 Adjusted R2 0.1110 0.2740 N 50 50
Note: Standard errors in parentheses. **significant at the 1% level, *significant at the 5% level.
A possible explanatation for the fact that men in a two-person tournament work less hard when facing a woman than a man is chivalry (see also Eckel and Grossman, 2001). It is difficult to interpret this male behavior as a maximizing response to beliefs that the woman is less able at the task than the man: if the man believes he will win the competition he should work as hard as when he is in a single-person tournament.
Earnings We observe an average earnings gap of 24.3% in favor of men. This
mainly from the male-female performance differences in single-person tournaments. But, whereas men earn more than women in both the piece rate and the single-person tournaments, in two-person tournaments women earn 18.8% more than men. This can be attributed to the chivalry phenomenon described above, i.e., that men work less hard against women than against men in two-person tournaments. Is is therefore not the case that women always perform less efficiently than men once they have chosen to operate in a competitive environment.
4.4 Allowing subjects to choose a male or female co-participant
In our experiment, subjects could not choose whether to interact with women or men – each subject was allocated a male or a female co-participant. Suppose we increase subjects’ ‘control’ over their environment by letting them choose their co-participant – will this affect payment scheme choices?
We ran a treatment where subjects choose to interact with a man or with a woman before choosing payment scheme and performing the task. Four additional sessions, involving 41 women and 39 men, were organized. Each subject saw on the screen the pseudonyms of two subjects, one a female and the other a male pseudonym. The subject then chose one of the two subjects as his/her co-participant.18 The rest of the game and the payoffs are the same as in the base experiment.
68.3% of women and 71.8% of men choose to be paired with a woman (the difference is not significant; chi-square test: p=0.733). Both percentages are significantly different from a random choice (binomial tests: p=0.027 for women and p=0.009 for men). In comparison with the base treatment, both men and women are more likely to choose the
18
A subject is always matched with the person he chose. Suppose that subject X chooses Y who chooses Z. Suppose also they all choose the tournament. X’s performance is then compared with Y’s. Y is not informed about him/her being chosen by X, and Y’s payoff only depends on the performance comparison between Y and Z.
tournament. The only marginally significant difference is that, of the women who choose to be matched with another woman, 57.1% choose the tournament, while only 34% of the women who were exogenously matched with a woman selected the tournament (MWU test: p=0.079). The overall proportion of women who choose the tournament increases from 34.0 to 53.7 (MWU test: p=0.061), whereas men’s entry rate into the tournament also increases, from 60 to 74.4, but not significantly so (MWU test: p=0.157). Therefore, giving subjects more ‘control’ over their environment decreases the gender gap in tournament choice from 26 points in the base treatment to 20.7 points, but it is still significant (MWU test: p=0.056).19
As regards task performance, our result that women compete more when they can choose to play against a woman relative to when they are exogenously assigned a female co-participant differs from the finding in Gneezy, Niederle, and Rustichini (2003). They find that women compete more in exogenous all-women groups than in
exogenous mixed groups.20 In our experiment female competitiveness is higher in
endogenous female pairs than in exogenous female pairs.
5. Discussion
In our experiment men are more likely to choose the tournament payment scheme when matched with a man than with a woman. And when matched with a woman, the more likely women are believed to choose the tournament, the more likely the man is to choose the tournament as well. Men are influenced by gender per se, and not because gender labels provide information about the fundamentals, such as relative ability.
19
Separate Probit regressions by gender (not reported here) indicate that men’s choice of a female participant cannot be explained by beliefs about relative ability nor by their beliefs about the co-participant’s payment scheme choices. Women’s choice of male partners is mainly influenced by own confidence: those who have high expectations regarding their absolute ability are more likely to select a male co-participant.
20
In our experiment, when both a woman and her co-participant chose the tournament, women on average solve 12 mazes when the co-participant is a man, and solve 10.2 mazes when the co-participant is a woman. The difference is, however, not statistically significant (p=0.354).
Indeed, considerations of relative ability do not explain subjects’ payment scheme choices. We also found that when women have more control over the environment, i.e. when they can choose the gender of their co-participant, they become more competitive. We can explain the observed behavior in various ways. There may be a social norm, according to which men “must” or “should” compete with men, whereas women should be “careful” or “choosy” and only choose to compete when this is clearly deemed favorable. The observed male behavior conforms somewhat to such a norm, since men always compete more against men than against women, and compete against women when the latter are thought to compete. Similarly, only women who are not too concerned about risk choose the tournament. Indeed, whereas both men and women did not differ in risk attitudes, only women conditioned their payment scheme choices on this variable.
Another explanation for the observed behavior is biological: In the daily struggle for survival faced by our ancestors, males competed for females, and those males who performed best had the most offspring. The optimal behavior for child-bearing females, on the other hand, was one of cautiousness, selectivity, and avoidance of risky or threatening situations. See Knight (2002) for a survey of research in biology, and the discussion in Croson and Gneezy (2004). This story finds some support in our data, since men in our experiment compete less against women than against men. But if the male believes that the female will compete (i.e., according to the gender norm described here, effectively in the eyes of the men “behave like a man”), then the male is more likely to choose the tournament.
Of course, these are just speculations, and we outline them only to indicate the need for further research. Moreover, it should be recalled that both men and women became
more competitive when we exogenously raised the expected monetary payoff from the tournament relative to the piece rate. Thus our subjects react to standard economic incentives. Standard economic incentives therefore interact with social considerations. An analysis based on economic variables should also acknowledge the existence of gender-based social norms.
6. Conclusion
We report on an economic experiment where subjects before performing a task choose whether to perform under a competitive payment scheme (tournament) or a non-competitive payment scheme (piece rate). We find that women are less likely than men to choose the competitive payment scheme.
In explaining this difference we find that while many men and women are over-confident about relative ability, beliefs about relative ability do not predict choices of women or of men. Instead, we find that women are primarily ‘internally’ oriented in their choice of payment scheme in the sense that risk aversion matters for their choices. Men on the other hand seem to be ‘externally’ oriented as the co-participant’s gender and not risk matters for their payment scheme choices. Male behavior depends on whether he interacts with a male or female co-participant. When facing a woman, the man competes more if he believes that women compete, too. But if the co-participant is a man, a man competes regardless of his beliefs about men's entry rate into the competition. We attribute this to the presence of social norms and possibly evolutionary factors.
Our results show that in order to predict male and female competitive behavior, one must consider not only economic variables, such as the monetary payoffs and risk attitudes, that influence mainly women’s decisions, but also uncover and describe the
social norms that influence behavior. Future work should carefully investigate how these two forces interact.
Appendix 1. Instructions
You are participating in an experiment on decision-making. During this session, you can earn money. The amount of your earnings depends on your decisions and the decisions of another participant you will interact with. During the session, your earnings are expressed in points with the following conversion rule:
1 point = 0.25 €
At the end of the session, you will be paid in cash your earnings obtained during this session after they have been converted into Euros. We will add up to these earnings an additional amount of money (a show-up fee of 2 € + a minimum amount of 2 € for your participation to a post-experimental questionnaire). You will get paid in a separate room in order to preserve confidentiality, on presentation of the ticket that you have randomly drawn from the envelope upon entering the laboratory. The whole session lasts about one hour long.
Before starting the session, you are kindly requested to supply some personal information about your gender, your age, your school, your level and field of studies and whether you have already participated in an experiment in economics. These anonymous pieces of information will remain confidential.
During this session, you will perform a task on your computer. This task consists of solving mazes. You are going to practice now by solving three mazes in order to get familiar with the task at hand.
As soon as you click the button “start”, a maze appears on your screen. Starting from the green point located at the left of your screen, you can move around in this maze by using the mouse of your computer. The path you follow appears in green and a marker always indicates your current position in the maze. You can move forward, stop or restart from any point already reached whenever you want. You can also give up a maze before solving it and make another one appear by clicking the button “next”. The maze is solved as soon as you reach the red point located at the right of the screen. You are always shown the time you have spent since you clicked the “start” button. All the participantscan see the same three mazes.
When you have completed these three practice periods, you will be requested to answer the following question: “In your opinion, how many mazes do you think you could solve in 15 minutes?”. The results of these practice periods and the answer to this question have definitely no consequences for the rest of the session, either for the person you will interact with, or for your earnings. After a moment, you will receive the instructions for the rest of the session.
If you have any questions, please raise your hand. Someone will answer your questions privately. Throughout the entire session, talking is not allowed.
Instructions (continued)
[The instructions below were distributed to the participants when all of them had completed the practice periods and answered the question]
During this session, you are paired with another participant.
Both you and the participant you are paired with have to perform a task. The task consists of solving mazes during a limited period of time of 15 minutes. The number of mazes you solve contributes to determine your earnings. The session consists of three stages.
In the first stage, you are allocated a pseudonym (a fake first name). Then, we propose to you the
pseudonyms of two participants in this session and we ask you to choose among these two persons the participant you will interact with.
In the second stage, you choose between two possible modes of payment, Mode A and Mode B. Your
choice of the mode of payment and the choice of your co-participant determines the number of points you receive for each maze you solve personally.
You choose And your
co-participant chooses
You receive personally
Mode A Mode A
or mode B
4 points for each maze you solve, no matter the number of
mazes solved by the participant you are paired with
Mode B Mode A 6 points for each maze you solve, no matter the number of
mazes solved by the participant you are paired with
Mode B Mode B
6 points for each
maze you solve if you solve more mazes than your co-participant
1 point for each
maze you solve if you solve fewer mazes than your co-participant.
If you solve the same number of mazes as your co-participant, a random draw determines which of you two receives
6 points for each
maze solved and which of you two receives 1 point for each maze solved.
You choose between Mode A and Mode B by clicking one of the two buttons available on your computer screen. Your choice is registered once you click “OK”.
You are informed of the choice of your co-participant before moving to the third stage.
In the third stage, you perform the task of solving mazes during 15 minutes. Time is deducted as soon as
you click the “start” button. To make a new maze appear on your screen, you can click the “next” button. The number of mazes you have currently solved is always visible on your screen, as the time already spent since the beginning of the task solving. All the mazes have a solution. All the participants receive the same mazes in the same order.
At the end of the 15 minute-period, you are informed about your payoff and the session is over. Then you are asked to fill out a post-experimental questionnaire, the details of which will be shown on your screen. If you have any questions, please raise your hand. Someone will answer your questions privately.
Appendix 2. Post-experimental questionnaire
You are kindly requested to answer the following questionnaire that consists of two parts. By answering these questions, you can earn between 2 and 5 Euro more. The answers to these questions are anonymous and confidential. Communication is not allowed.
1st part
You will receive 1 Euro for each correct answer to the following questions. For your information, in this session, there were ___ women and __ men.
Question 1. In your opinion, what is the average number of mazes solved by the women in this session
(including yourself if you are a woman)?
Question 2. In your opinion, what is the average number of mazes solved by the men in this session
(including yourself if you are a man)?
Question 3. In your opinion, how many women in this session have chosen mode B (including yourself if
you are a woman)?
Question 4. In your opinion, how many men in this session have chosen mode B (including yourself if
you are a man)?
2nd part. You earn 2 € for sure by answering the following 16 questions.
For each of the following statements, please indicate the likelihood that you engage in each activity or behavior, by using the following scale, and by entering a number between 1 (very unlikely) and 5 (very likely):
1 2 3 4 5 Very unlikely Unlikely Not sure Likely Very likely
Betting a day’s income at a high stake playing cards game : ___ Getting close to a river in flood to take pictures that
you can sell to the press: ___ Investing 10% of your annual income in a moderate growth mutual fund: ___
Defending an unpopular issue that you believe in at a social occasion: ___ Co-signing a new car loan for a friend: ___ Deciding to share an apartment with somebody you don’t know well: ___ Investing 5% of your annual income in a very speculative stock: ___ Going camping in the wild: ___ Taking a week’s income to play at the casino: ___ Going on a two-week vacation in a third-world country without
prearranged hotel accommodation: ___ Spending money impulsively without thinking about the consequences: ___
Trying bungee jumping: ___ Lending a friend an amount of money equivalent to one
month ‘s income: ___ Investing in a business that has a good chance of failing: ___ Approaching your boss to ask for a raise: ___ Dating someone you are working with: ___
References
Altonji, Joseph G. and Blank, Rebecca, (1999). "Race and Gender in the Labor Market," O. Ashenfelter and D. Card, Handbook of Labor Economics. Amsterdam: Elsevier Science, 3144-259.
Ayres, I. and Siegelman, P., (1995). "Race and Gender Discrimination in Bargaining for a New Car." American Economic Review, 85, pp. 304-21.
Barber, Brad M. and Odean, Terrance, (2001). "Boys Will Be Boys: Gender, Overconfidence, and Common Stock Investment." Quarterly Journal of Economics, pp. 261-92.
Barsky, Robert B.; Juster, Thomas F.; Kimball, Miles S. and Shapiro, Matthew D., (1997). "Preference Parameters and Behavioral Heterogeneity: An Experimental Approach in the Health and Retirement Study." Quarterly Journal of Economics, 112, pp. 537-79.
Bertrand, Marianne and Hallock, Kevin F., (2001). "The Gender Gap in Top Corporate Jobs." Industrial and Labor Relations Review, 55(1), pp. 3-21.
Blau, Francine; Simpson, Patricia and Anderson, Deborah, (1998). "Continuing Progress? Trends in Occupational Segregation in the United States over the 1970s and 1980s." NBER Working Paper, 6716.
Brown, C., (1990). "Firm's Choice of Method of Pay." Industrial and Labor Relations Review, 43, pp. 165-82.
Cadsby, C. Bram and Maynes, Elizabeth, (1998). "Gender and Free-Riding in a Threshold Public Goods Game: Experimental Evidence." Journal of Economic Behavior and Organization, 34, pp. 603-20.
Camerer, Colin F. and Lovallo, Dan, (1999). "Overconfidence and Excess Entry: An Experimental Approach." American Economic Review, 89(1), pp. 306-18.
Charness, Gary and Gneezy, Uri, (2004). "Gender Differences in Financial Risk-Taking." Mimeo.
Croson, Rachel and Gneezy, Uri, (2004). "Gender Differences in Preferences." Mimeo. Eckel, Catherine C., (2005). "Measuring Risk." North American meeting of the
Economic Science Association, Tucson.
Eckel, Catherine C. and Grossman, Philip J., (2001). "Chivalry and Solidarity in Ultimatum Games." Economic Inquiry, 39(2), pp. 171-88.
____, (2003). "Forecasting Risk Attitudes: An Experimental Study of Actual and Forecast Risk Attitudes of Women and Men." Mimeo.
Gneezy, Uri; Niederle, Muriel and Rustichini, Aldo, (2003). "Performance in Competitive Environments: Gender Differences." Quarterly Journal of Economics, pp. 1049-74.
Gneezy, Uri and Rustichini, Aldo, (2004). "Gender and Competition at a Young Age." American Economic Review (Papers and Proceedings), 94(2), pp. 377-81.
Goldin, Claudia, (1986). "The Gender Gap in Historical Perspective, 1800 to 1980," P. Kilby, Quantity and Quality: Essays in American Economic History. Wesleyan: Wesleyan University Press
Goldin, Claudia and Rouse, Cecilia, (2000). "Orchestrating Impartiality: The Impact of “Blind” Auditions on Female Musicians." American Economic Review, 90(4), pp. 715-41.
Heywood and Jirjahn, Uwe, (2002). "Payment Schemes and Gender in Germany." Industrial and Labor Relations Review, 56(1), pp. 44-64.
Heywood; Siebert, W.S. and Wei, X., (1997). "Payment by Results Systems: British Evidence." British Journal of Industrial Relations, 35, pp. 1-22.
Holm, Hakan, (2000). "Gender-Based Focal Points." Games and Economic Behavior, 32, pp. 292-314.
Ingram, Barbara L. and Berger, Stephen E., (1977). "Sex-Role Orientation, Defensiveness, and Competitiveness in Women." Journal of Conflict Resolution, 21(3), pp. 501-18.
Jianokoplos, Nancy A. and Bernasek, Alexandra, (1998). "Are Women More Risk-Averse?" Economic Inquiry, 36, pp. 620-30.
Jirjahn, Uwe and Stephan, Gesine, (2004). "Gender, Piece Rates and Wages: Evidence from Matched Employer-Employee Data." Cambridge Journal of Economics, 28(5), pp. 683-704.
Kahneman, Daniel and Lovallo, Dan, (1993). "Timid Choice and Bold Forecasts: A Cognitive Perspective on Risk Taking." Management Science, 39(1), pp. 17-31. Knight, Jonathan, (2002). "Sexual Stereotypes." Nature, 415, pp. 254-56.
Lichtenstein, Sarah; Fischhoff, Baruch and Phillips, Lawrence, (1982). "Calibration of Probabilities: The State of the Art to 1980," D. Kahneman, P. Slovic and A. Tversky, Judgment under Uncertainty: Heuristics and Biases. Cambridge: Cambridge University Press,
Mincer, Jacob and Polachek, Solomon W., (1974). "Family Investments in Human Capital: Earnings of Women." Journal of Political Economy, 82(2), pp. S76-S108. Neumark, David; Blank, Roy J. and Van Nort, Kyle D., (1996). "Sex Discrimination in
Restaurant Hiring: An Audit Study." Quarterly Journal of Economics, 111(3), pp. 915-41.
Niederle, Muriel and Vesterlund, Lise, (2005). "Do Women Shy Away from Competition?" NBER Working Paper, 11474.
Polachek, Solomon W., (1981). "Occupational Self-Selection: A Human Capital Approach to Sex Differences in Occupational Structure." Review of Economics and Statistics, 63(1), pp. 60-69.
Powell, Melanie and Ansic, David, (1997). "Gender Differences in Risk Behaviour in Financial Decision-Making: An Experimental Analysis." Journal of Economic Psychology, 18, pp. 605-28.
Rapoport, Anatol and Chammah, Albert M., (1965). "Sex Differences in Factors Contributing to the Level of Cooperation in the Prisoner's Dilemma Game." Journal of Personality and Social Psychology, 2(6), pp. 831-38.
Slonim, Robert, (2005). "Gender Selection Discrimination: Evidence from a Trust Game." Case Western Reserve University, Mimeo.
Taylor, Shelley E. and Brown, Jonathan D., (1988). "Illusion and Well-Being: A Social Psychological Perspective on Mental Health." Psychological Bulletin, 103(2), pp. 193-210.
Vandegrift, Donald; Yavas, Abdullah and Brown, Paul M., (2004). "Men, Women, and Competition: An Experimental Test of Labor Market Behavior." Mimeo.
Weber, Elke U.; Blais, Ann-Renée and Betz, Nancy E., (2002). "A Domain-Specific Risk-Attitude Scale: Measuring Risk Perceptions and Risk Behaviors." Journal of Behavioral Decision Making, 15, pp. 263-90.
Zeiliger, Romain, (2000). A Presentation of Regate, Internet Based Software for Experimental Economics. http://www.gate.cnrs.fr/~zeiliger/regate/RegateIntro.ppt., GATE.