RAPPORT PRÉSENTÉ A
L'UNIVERSITÉ DU QUÉBEC A TROIS-RIVIÈRES
COMME EXIGENCE PARTIELLE DU DOCTORAT EN SCIENCES ET GÉNIE DES MATÉRIAUX LlGNOCELLULOSIQUES
PAR
MICHEL SCHENKER
ÉTUDE DES SUSPENSIONS DE MICRO-NANOCELLULOSE FIBRILLÉE (MNFC)
Université du Québec à Trois-Rivières
Service de la bibliothèque
Avertissement
L’auteur de ce mémoire ou de cette thèse a autorisé l’Université du Québec
à Trois-Rivières à diffuser, à des fins non lucratives, une copie de son
mémoire ou de sa thèse.
Cette diffusion n’entraîne pas une renonciation de la part de l’auteur à ses
droits de propriété intellectuelle, incluant le droit d’auteur, sur ce mémoire
ou cette thèse. Notamment, la reproduction ou la publication de la totalité
ou d’une partie importante de ce mémoire ou de cette thèse requiert son
autorisation.
SCIENCES ET GÉNIE DES MATÉRIAUX LIGNOCELLULOSIQUE (PH.D. )
Direction de recherche:
Patrice MANGIN
Prénom et nom
directeur de recherche
Patrick GANE
Aalto University
Prénom et nom
codirecteur de recherche
Jury d'évaluation
Bruno CHABOT
Prénom et nom
Président de Jury
Nicole DEMARQUETTE
École de technologie supérieure (ETS)
Prénom et nom
Évaluateur externe
Joachim SCHOELKOPF
OMYA
Prénom et nom
Évaluateur externe
The origins of this study go back to a joint work between UQTR (Prof. Patrice Mangin) and Omya International AG within the ArboraNano framework, which started in 2012. The goal of this initial project was to demonstrate the feasibility of applying micro nanofibrillated cellulose (MNFC)-based coatings directly on a paper machine, up to pilot scale. After successfully achieving this goal on the pilot paper machine ofInnofibre, Trois Rivières Québec, the cooperation between Prof. Mangin and Omya continued to develop this technology further, and to advance a more fundamental aspect in related areas. A mid-term research proposaI was set up, including several Master- and PhD theses. 1 had the honour to be asked by Prof. Patrick Gane, vice president of R&D at Omya International AG, to work on one ofthose PhD thesis projects, and to be accepted as a candidate by my supervisor Prof. Patrice Mangin. The goal of this work was set to obtain a better understanding of the stability and homogeneity of MNFC-containing suspensions. Soon it became apparent, that the initial scope was too broad, and it was decided to focus on a specific investigation of the rheology of such suspensions. As this project was funded by the industry, an eye was kept on product relevance and practicability. Due to the complex rheological behaviour of fibrillar cellulose suspensions, special attention was paid to adequate measurement set-ups and protocols, as well as meaningful parametrisation and quantification of the obtained rheological data. Finally, the influence of suspension solids content and the degree of fibrillation on their rheological behaviour was investigated specifically adopting an extensive experimental matrix.
Acknowledg ments
This work would not have been possible without the encouragement and the constant support of my former managers from Omya International AG, Joachim Schoelkopf and Patrick Gane, as weil as my supervisor Patrice Mangin. 1 would like to thank them for their guidance, but also for giving me a lot of freedom and independence to carry out this work. Also, 1 would like to thank them for ail the interesting discussions, exchanges and chats we have had on, or off, the topic ofthis work. Dear gentlemen, thankyou very much! To become a scientist, one has to be curious as weil as persistent sometimes. These are only two of many useful traits that my parents taught me. 1 am deeply grateful for your encouragements, support and help 1 have experienced, also in difficult times. Without you, 1 wouldn't be where 1 am today. Mami, Papi, danke voumou! Cathrin, thank you for supporting my enthusiasm, for your honest interest in my work and for giving me balance in my life. You rock! And, finally, Fay, thank you for teaching me life lessons without even knowing.
Big thanks also go to my colleagues at Omya and FiberLean for their valuable discussions, moral support and helpful inputs. It was, and still is a pleasure to work with you. 1 would also like to thank the members of the CRML at UQTR 1 had the pleasure to me et and work with, 1 felt always welcome and supported during my visits and stays.
Finally, but not less importantly, Omya International AG as well as FiberLean Technologies Ltd. are gratefully acknowledged for not only funding this research as weil as providing me ail the resources 1 needed to carry out this thesis.
Résumé
Bien que connu depuis environ 30 ans, la micro-nanocellulose fibrillée (MNFC) n'a suscité de véritable intérêt que depuis les dix dernières années. Depuis, non seulement les universités, mais aussi l'industrie, étudient ce matériau polyvalent pour diverses applications.. Un facteur limitant était, et est encore dans une certaine mesure, les processus de fabrication généralement longs et coûteux. Cependant, des développements récents ont montré qu'il est possible de produire économiques diverses qualités de MNFC en utilisant des procédés de fibrillation mécanique, éventuellement assistés par des aides au broyage tels que des particules minérales qui peuvent apporter des propriétés par synergie énergétique.
Alors que le MNFC possède des propriétés très intéressantes, comme la résistance mécanique, la rhéologie et les fonctionnalités barrière, les mêmes propriétés peuvent également poser des problèmes majeurs de manipulation et d'application. L'un de ces aspects est le comportement d'écoulement visqueux du flux de suspension de MNFC, c'est-à-dire son profil rhéologique. Non seulement le comportement rhéologique est complexe, mais aussi la morphologie des particules de suspension sous-jacente.
Ce travail a été initié étudier l'interaction entre différents paramètres de suspension et les propriétés de la suspension résultante alors que la rhéologie n'était que l'un des aspects d'intérêt. Après avoir réalisé le niveau de complexité de la rhéologie des suspensions de MNFC, la recherche a été recentrée sur les investigations rhéologiques qui, à notre analyse, pouvait également fournir de nombreuses informations utiles.
Des travaux expérimentaux initiaux, ainsi qu'une analyse bibliographique approfondie, ont révélé que même une mesure fiable de la rhéologie d'une suspension MNFC n'est pas simple, pour de nombreuses raisons pratiques liées à son comportement rhéologique complexe.
Ainsi, une première partie du travail est consacrée à analyser et préciser les réglages et conditions de mesures appropriés pour les rhéomètres à cisaillement. Constatant qu'une telle recherche n'avait pas encore été effectuée systématiquement auparavant pour les suspensions de MNFC, il convient de souligner que différents matériaux à base de nanocellulose peuvent répondre différemment à certaines conditions de mesure. Par
conséquent, toutes les recommandations figurant dans la littérature ne peuvent pas être appliquées de manière ponctuelle aux suspensions de MNFC. Nous avons montré, par exemple, qu'une palette dans un système à cupule dentelée semblait moins susceptible aux artefacts de mesure que d'autres systèmes plus classiques à base de cylindres coaxiaux. Cependant, les données ont également indiqué que les tendances en fonction de la teneur en solides peuvent également être reproduites avec des systèmes influencés par des artefacts, qui peuvent même être quantifiés.
Une autre partie de ce travail consistait à décrire les données rhéologiques obtenues de manière comparable, c'est-à-dire quantitatives plutôt que qualitatives. Plusieurs descripteurs rhéologiques quantitatifs sont bien connus, par exemple la viscosité et le module de stockage. Cependant, les suspensions de MNFC ont un profil de viscosité complexe et plutôt distinct (courbe d'écoulement). Même si cela est rapporté fréquemment, il est rarement paramétré et quantifié, ce qui rend difficile la comparaison avec d'autres ensembles de données. Nous avons donc introduit de nouveaux descripteurs qui quantifient spécifiquement le comportement observé des trois zones. Les nouveaux descripteurs traduisent d'une part les taux de cisaillement auxquels la suspension de MNFC entre et sort de la zone de transition, et d'autre part, ils décrivent le comportement de la courbe d'écoulement dans les différentes zones de réponse. Une autre approche que nous avons introduite est la description quantitative de l'hystérésis de la courbe d'écoulement qui est généralement observée lorsqu'une boucle de taux de cisaillement est réalisée, c'est-à-dire lorsque le taux de cisaillement est d'abord augmenté puis diminué dans une mesure de courbe d'écoulement (ou inversement).
Pour se garantir de la validité de notre approche expérimentale et des méthodes de traitement des données, des tests statistiques ont également été réalisés sur un ensemble de données sélectionné. En général, il a été constaté que les tendances apparentes visuelles étaient confirmées par les tests de variance respectifs.
Sur la base de toutes les parties susmentionnées de ce travail, une vaste étude expérimentale a été menée sur l'influence du degré de fibrillation (DoF) d'une suspension de MNFC sur son comportement rhéologique. Ceci a été réalisé par caractérisation rhéologique de mélanges de trois suspensions de DoF différentes. Alors qu'aucune quantification fiable et absolue de DoF n'a été obtenue, des mesures indirectes de DoF ont
montré que trois degrés de fibrillation étaient atteints dans la série de production d'échantillons, l'un peut être considéré comme non fibrillé, un autre moyennement fibrillé et le dernier hautement fibrillé. Pour pouvoir présenter l'ensemble complet de données de manière compacte et compréhensive, des diagrammes de mélange ternaires ont été utilisés comme format de visualisation, incluant des superpositions de cartes de couleurs pour tracer les données. À l'aide de ces diagrammes ternaires 2D ou 3D en courbes de niveau superposés, les tendances qualitatives sont facilement identifiables. Alors que certaines des tendances dominantes dans le domaine de la rhéologie des nano celluloses ont été confirmées par cette étude sur les suspensions de MNFC, d'autres effets précédemment jamais rapportés ont également été mis en évidence.
Les résultats obtenus tout au long de ce travail ont été discutés avec une vue sur les hypothèses de modèles morphologiques les plus récents. Plus précisément, notre argumentation était basée sur les résultats d'autres chercheurs qui utilisaient des méthodes rhéo-optiques pour étudier le changement macroscopique de la morphologie des particules de suspension dans des suspensions de MNFC en écoulement. En outre, nous avons également inclus d'autres travaux du domaine dans la discussion de nos données et de l'évolution des modèles respectifs. En conséquence, notre présent travail propose également un examen critique et une vue d'ensemble des avancées récentes dans le domaine de la rhéologie des suspensions de MNFC.
Le travail peut servir de base solide pour toutes recherches ultérieures, tout comme pour étudier l'influence des propriétés des autres types de suspensions de MNFC quant à leur comportement rhéologique et à leur morphologie.
Summary
Despite being known for about thirty years, MNFC has only gained real attention about ten years ago. Since then, not only academia, but also industry, are investigating this versatile material for various purposes. A limiting factor was, and to some extent still is, the typically extensive and expensive manufacturing processes. Yet, recent developments have shown that it is possible to produce co st-effective grades using mechanical fibrillation processes, eventually assisted by grinding aids like minerai particles, which, themselves, can act to develop synergistic properties. Whereas MNFC has very interesting properties, for example, conceming mechanical strength, rheology and barrier functionality, the same properties can also lead to major challenges in handling and applying it. As mentioned, one ofthese aspects is the MNFC suspension flow behaviour, i.e. its rheology profile. Not only the rheological behaviour itself is complex, but also the respective underlying suspension particulate morphology reflected in that behaviour. This work was set-up initially to investigate the interaction between different suspension/composition parameters and components and the resulting suspension properties, whereas rheology was one aspect of interest. After realising that the rheology ofMNFC suspensions is very complex on its own, but might as well provide much useful information, the work was refocused on rheological investigations.
Initial experimental work, as well as a thorough literature review, have revealed that even a reliable measurement of an MNFC suspension' s rheology in itself is not straightforward, for many practical reasons related to its complex rheological behaviour. So, an initial part of the work is dedicated to finding appropriate measurement set-ups and conditions for shear rheometer devices. It was found that such an investigation was not yet do ne systematically before for MNFC suspensions, and, in this context, it should be highlighted that different nanocellulose materials may respond differently to certain measurement conditions. So, not all recommendations that are found in the literature can be applied ad hoc to MNFC suspensions. We showed, for instance, that a vane-in-serrated-cup system appears to be less susceptible to measurement artefacts compared to the more common cylinder-in-cup-based systems. However, the data also indicated that trends as a function of solids content can also be reproduced with systems that are influenced by artefacts, sometimes ev en quantitatively.
Another part ofthis work was to describe the variously obtained rheological data in a way that they were comparable, i.e. to be quantitative rather than qualitative. Several quantitative rheological descriptors are weil known, for instance viscosity and storage modulus. However, MNFC suspensions have a complex and rather distinct viscosity profile (flow curve). Even though this is reported frequently, it is seldom pararnetrised and quantified, making it difficult to compare to other datasets. We, therefore, introduced novel descriptors that quantify specifically the observed three-zone behaviour. On the one hand, they describe the shear rates at which the MNFC suspension enters and leaves the transition zone, and on the other hand, they describe the flow curve behaviour within the different response zones. Another approach we introduced was the quantitative description of the flow curve hysteresis that is typically observed when a shear rate loop is performed, i.e. wh en the shear rate is first increased and then decreased in a flow curve me as ure ment (or vice versa). To get confidence in the experimental approach and the data treatment methods, statistical tests were performed on a selected dataset as weIl. In general, it was found that visually apparent trends were confirmed by respective variance tests.
Based on aIl the aforementioned parts of this work, an extensive experimental study was carried out, investigating the influence of the degree of fibrillation (DoF) of an MNFC suspension on its rheological behaviour. This was realised by rheologically characterising mixtures comprising up to three different suspensions of different DoFs. Unfortunately, no reliable, absolute quantification of the DoF was achieved, yet, indirect measurements of the DoF have shown that three grades of fibrillation were achieved in the sample production series, wherein one can be considered to be unfibrillated, another one medium fibrillated and the last one to be extensively fibrillated MNFC. To be able to present the extensive set of data in a compact and comprehensive way, temary mixture diagrams were used as a visualisation format, including colourmap overlays to plot the data. Using these 2D contour, or 3D stacked, temary diagrams, qualitative trends were easily identified. Whereas sorne prevailing trends in the field ofnanocellulose rheology were confirmed by this study on MNFC suspensions, other, previously unreported effects were found as weil. The findings obtained throughout this work were discussed with a view on recent morphological model hypotheses. Argumentation was based on results from other
researchers who used rheo-optical methods to investigate the macroscopical change of the suspension particulate morphology of flowing MNFC suspensions. In addition, other work in the field was included in the discussion of the data and respective model developments. As a result, the present work also provides a critical review and overview on recent advances in the field of the rheology ofMNFC suspensions.
The work can be understood as a solid basis for continuing further, similar investigations researching the influence of other MNFC suspension properties and their influence on rheological behaviour and particulate flow morphology.
Keywords
Microfibrillated cellulose (MFC); Micro nanofibrillated cellulose (MNFC); Rheology; Flow curve; Viscoelasticity; Vane rheometry; Degree offibrillation; Aqueous suspension; Morphology; Data quantification
Contents
Foreword ... i Acknowledgments ... , ... ii Résumé ... iii Smnmary ... vi Keywords ... ix Contents ... xList of figures ... xvi
List of tables ... xxii
List of equations ... xxiii
List of abbreviations ... xxv
Chapter 1 - Introduction ... l 1.1 Nomenclature ... 1
1.2 Context. ... 1
Chapter 2 - Literature review ... .4
2.1 Cellulose ... 4 2.1.1 Structure ... 4 2.1.2 Types ... 5 2.2 MNFC ... 7 2.2.1 Manufacturing ... 7 2.2.2 General properties ... 13
2.2.3 Applications and uses for MNFC ... .16
2.3 Matrix material for composites ... 20
2.4 Characterisation of MNFC suspensions ... 22
2.4.2 Characterisation methods ... 22
2.4.3 Conclusion ... 39
2.5 Rheology ofMNFC suspensions ... 39
2.5.1 Pure MNFC systems ... 40
2.5.2 Influence of additives on MNFC suspensions ... .42
2.5.3 MNFC in complex systems ... .43
Chapter 3 - Hypothesis and objectives ... .47
3.1 Original goal ... 47
3.1.1 Material space ... 47
3.1.2 Properties and products characterisation ... .48
3.1.3 Stability and homogeneity assessment... ... .49
3.2 Refined goal ... 50
3.3 Objectives ... 52
Chapter 4 - Materials and Methods ... 53
4.1 Materials ... 53
4.1.1 MNFC ... 53
4.2 Methods ... 58
4.2.1 Rheology ... 58
4.2.2 Data treatment and presentation ... 68
4.2.3 Partic1e size distribution analysis ... 72
Chapter 5 - Article 1: Rheological investigation of complex micro and nanofibrillated cellulose (MNFC) suspensions: discussion of flow curves and gel stability ... 74
5.1 Foreword ... 74
5.2 Abstract ... 74
5.3 Introduction ... 75
5.4 Experilnental. ... 76
5.4.1 Materials ... 76
5.5 Results and Discussion ... 81
5.5.1 MNFC lnorphology ... 81
5.5.2 Influence ofsolids content on MNFC rheology ... 81
5.5.3 Influence of the degree of fibrillation on MNFC suspension rheology ... 84
5.5.4 Influence of additives on MNFC suspension rheology ... 88
5.6 Conclusions ... 100
5.7 Acknowledgements ... 100
5.8 References ... 100
Chapter 6 - Presentation 1: Rheological investigation of pigmented micro-nano-fibrillated cellulose (MNFC) suspensions: Discussion of flow curves ... 104
6.1 Foreword ... 104
6.2 Summary ... 104
6.3 Presentation ... 105
Chapter 7 - Article 2: Influence of shear rheometer measurement systems on the rheological properties of microfibrillated cellulose (MFC) suspensions ... 115
7.1 Foreword ... 115 .' 7.2 Abstract. ... 116 7.2.1 Keywords ... 116 7.3 Introduction ... 116 7.4 Methods ... : ... 119 7.4.1 Materials ... 119 7.4.2 Itnaging ... 121 7.4.3 Rheological measurements ... 122
7.5 Results ... 127 7.5.1 Viscoelastic properties ... 127 7.5.2 Flow curves ... 131 7.6 Conclusions ... 141 7.6.1 Acknowledgements ... 142 7.7 References ... 143 7.8 Supplementary information ... 147 7.8.1 Viscoelastic data ... 147
7.8.2 Flow curve data ... 150
7.8.3 References ... 152
7.9 Additional, unpublished data ... 152
7.9.1 Influence of individual measurement setup geometries ... 152
7.9.2 Conclusions ... 158
Chapter 8 - Article 3: Quantification offlow curve hysteresis data - a novel tool for characterising microfibrillated cellulose (MFC) suspensions ... 159
8.1 Foreword ... 159 8.2 Abstract ... 159 8.2.1 Keywords ... 160 8.3 Introduction ... 160 8.4 Experimental ... 162 8.4.1 Materials ... 162 8.4.2 Imaging ... 164 8.4.3 Rheological measurements ... 164
8.5 Results and discussion ... 171
8.5.2 Flow curves ... 172
8.5.3 Influence of solids content on hysteresis properties ... 172
8.5.4 Leamings ... 181
8.5.5 Hysteresis properties dependence on solids content ... 183
8.5.6 Comparison with other MFC suspension hysteresis data ... 183
8.6 Conclusions ... 185 8.6.1 Acknow1edgements ... 186 8.7 References ... 186 8.8 Unpub1ished data ... 190 8.8.1 Introduction ... 190 8.8.2 Results ... 190 8.8.3 Conclusions ... 194
Chapter 9 - Article 4: Rheo10gy of microfibrillated cellulose (MFC) suspensions -influence of the degree of fibrillation and residua1 fibre content on flow and viscoe1astic properties ... 195 9.1 Foreword ... 195 9.2 Graphical abstract ... 196 9.3 High1ights ... 196 9.4 Abstract. ... 196 9.4.1 Keywords ... 197 9.5 Introduction ... 197 9.6 Methods ... 200 9.6.1 Materials ... 200 9.6.2 Data presentation ... 202
9.6.3 Degree offibrillation analysis ... 202
9.7 Results ... 206
9.7.1 Degree of fibrillation ... 206
9.7.2 Suspension particulate morphology hypothesis ... 207
9.7.3 Influence ofDoF on static structure morphology ... 208
9.7.4 Influence ofDoF on yielding behaviour ... 209
9.7.5 Influence ofDoF on aggregation behaviour ... 212
9.7.6 Influence of component mix on high shear behaviour ... 216
9.8 Conclusions ... 217 9.8.1 Acknowledgements ... 220 9.9 References ... 220 9.10 Supplementary information ... 225 9.10.1 9.10.2 Width distribution analysis ... 225
Temary diagrams ... 226
9.11 References ... 237
9.12 Unpublished data ... 237
Chapter 10 -Conclusions ... 247
10.1 Rheometer system and measurement protocol ... 247
10.2 Quantification ofrheological data ofMNFC suspensions ... 249
10.3 Influence ofDoF on the rheological properties ofMNFC suspensions ... 250
10.4 Perspectives ... 252
List of figures
Figure 2.1: Overview on commonly used characterisation methods for MNFC
materials ... 23
Figure 2.2: Common drag and pressure flow geometries ... .31
Figure 2.3: Shear rate dependent viscosity curves ... 33
Figure 2.4: Time-dependent viscosity curves ... 34
Figure 3.1: Original DoE matrix proposaI with targeted parameters and predefined conditions and an estimate of experiments needed ... 51
Figure 4.1: Photograph of the feed material (eucalyptus pulp), medium fibrillated- and highly fibrillated MFC suspension ... 54
Figure 4.2: Photograph of the MKCA 6-2 Supermasscolloider used for the MFC lnanufacturing ... 56
Figure 4.3: Photograph of the homogeniser used to manufacture the H-MFC ... 58
Figure 4.4: Photograph of the used MCR 300 rheometer ... 59
Figure 4.5: Confocallaser scanning microscopy images of a smooth (left) and roughened (right) CC27 bob ... 60
Figure 4.6: Storage (full circles) and loss modulus (hollow circles) data, as weIl as phase angle (full triangles) data of a frequency sweep experiment of a 1 wt% MFC suspension, measured with a CC27 geometry ... 62
Figure 4.7: Storage-(full circles) and loss modulus (hollow circles) data (top and bottom left graphs) and phase angle data (top right graph) ofa 1 wt% H-MFC suspension, measured with a VS geometry ... 64
Figure 4.8: Comparison offlow curves obtained by different measurement protocols .... ... 65
Figure 4.9: Stacked diagram of acquisition time and viscosity data in dependence of shear rate for al wt% MFC suspension measured with the CC27 (left) and VS system (right) ... 67
Figure 4.10: Temary diagram of the planned mixtures for each of the total suspension solids contents ... 70
Figure 4.12: Example temary contour plots with simulated pro pert y data ... 72 Figure 5.1 : SEM images offreeze dried MNFC suspension ... 81 Figure 5.2: Flow curves ofMNFC samples at different solids contents ... 83 Figure 5.3: Schematic of the proposed conformations at high and low shear rate for
higher and lower solids contents ... 83 Figure 5.4: Amplitude sweep curves ofMNFC samples ... 84 Figure 5.5: Flow curves of MNFC suspensions at different degrees of fibrillation ... 86 Figure 5.6: Schematic of the proposed conformations at high and low shear rate for
greater and lesser degrees of fibrillation ... 87 Figure 5.7: Amplitude sweep curves ofMNFC suspensions at different degrees of
fibrillation ... 88 Figure 5.8: Flow curves ofMNFC suspensions at different pigment filler loadings .... 89 Figure 5.9: Amplitude sweep curves ofMNFC suspensions at different pigment filler
loadings ... 90 Figure 5.10: Flow cUrVes ofMNFC suspensions at different CMC loadings ... 93 Figure 5.11: Amplitude sweep curves ofMNFC suspensions at different CMC loadings . ... 94 Figure 5.12: Flow curves ofMNFC suspensions containing zero, one or two additives
(CMC and/or fGCC) ... 95 Figure 5.13: Amplitude sweep curves ofMNFC suspensions containing zero, one or two additives (CMC and/or fGCC) ... 96 Figure 5.14: Schematic of the proposed conformations for MNFC suspensions with and
without CMC and/or pigment. ... 96 Figure 5.15: Flow curves of MNFC suspensions containing no and the two different
PHCH filler pigments, PHCHa and PHCHb ... 97 Figure 5.16: Amplitude sweep curves ofMNFC suspensions containing no pigment
additive versus the two different PHCH pigments ... 98 Figure 7.1: Optical microscopy image of MFC suspension at 0.5 wt% (top left), and
SEM images offreeze-dried aerogels from 0.5 wt% suspensions at
increasing magnifications ... 121 Figure 7.2: Typical flow curve of an MFC suspension characterised in this work. .... 125
Figure 7.3: Storage and loss modulus (G', G" ) data of a 1 wt% MFC suspension
measured with the CC27 geometry ... 126
Figure 7.4: Viscoelastic properties in dependence of the suspension solids content for the different measurement systems ... 130
Figure 7.5: Phase angle (c» as a function of the shear stress (r) ... 131
Figure 7.6: Flow curves of a viscosity standard oïl measured with the different measurement setups ... 132
Figure 7.7: Description ofzone 1 of the flow curve ... 136
Figure 7.8: Description ofzone 2 of the flow curve ... 139
Figure 7.9: Description of transition zone properties ... 141
Figure 7.10: Amplitude sweep data of the 0.5 wt% for the different investigated Ineasurement setups ... 148
Figure 7.11: Amplitude sweep data of the 1 wt% for the different investigated measurement setups ... 149
Figure 7.12: Amplitude sweep data of the 2 wt% for the different investigated measurement setups ... 150
Figure 7.13: Flow curves of the 0.5 wt% MFC suspension for the different investigated measurement setups ... 151
Figure 7.14: Flow curves of the 1 wt% MFC suspension for the different investigated measurement setups ... 151
Figure 7.15: Flow curves of the 2 wt% MFC suspension for the different investigated measurement setups ... 152
Figure 7.16: Viscoelastic properties of the 1 wt% MFC suspension, measured with the CC27 and the VS system, as weil as with mixed setups, i.e. CC27 bob with serrated cup and vane with CC27 cup ... 154
Figure 7.17: Viscoelastic properties of the 1 wt% MFC suspension, measured with the smooth and roughened CC27 system, as weil as with mixed setups, i.e. smooth bob with roughened cup and roughened bob with smooth cup .... 155
Figure 7.18: Flow curve properties of the 1 wt% MFC suspension, measured with the CC27 and the VS system, as weil as with mixed setups, i.e. CC27 bob with serrated cup and vane with CC27 cup ... 156
Figure 7.19: Flow curve properties of the 1 wt% MFC suspension, measured with the smooth and roughened CC27 system, as well as with mixed setups, i.e.
smooth bob with roughened cup and roughened bob with smooth cup .... 157
Figure 7.20: Power law fitting parameters of zone 1 and 2 flow curve sections of the 1 wt% MFC suspension, including the standard error of the respective parameters as ca1culated by the fitting software ... 157
Figure 8.1: Optical microscopy image ofMFC suspension at 0.5 wt% (top left), and
SEM images offreeze-dried aerogels from 0.5 wt% suspensions at
increasing magnifications (top right), (bottom left) and (bottom right) ... 163
Figure 8.2: Typical flow curve of an MFC suspension characterised in this work,
showing the positive (+) and negative (-) defined hystereses ... 166 Figure 8.3: Flow curves ofaveraged data for 1 (circles), 1.5 (triangles) and 2 wt%
(squares) MFC suspensions including standard deviations (error bars) ... 172
Figure 8.4: Box charts of absolute hysteresis data ... 174 Figure 8.5: Box charts of normalised hysteresis data ... 175 Figure 8.6: Box charts of relative hysteresis data ... 176
Figure 8.7: Comparison of positive (full symbols) and negative (hollow symbols)
relative hysteresis data obtained by the regular method (HR+ and HR-) and
the simplified method (HRS+ and HRS-) .......... 177 Figure 8.8: Hysteresis positioning data ... 180
Figure 8.9: Comparison of positive normalised hysteresis and positive relative
hysteresis data ... 182
Figure 8.10: Box plots of the flow curve properties of the 9 individually evaluated flow
curves per dilution ... 192
Figure 8.11: Box plots of the flow curve properties with non-continuous values ... 193
Figure 9.1: Flow curve (a) and amplitude sweep (b) measurement data ofa 1 wt%
MFC suspension ... 205
Figure 9.2: Optical (top) and SEM images (bottom) of the pulp (a), MFC (b) and
H-MFC materials (c) ... 207
Figure 9.3: Storage modulus (G'max) data presented in temary mixture contour plots ...
Figure 9.4: Yield stress determined from the amplitude sweep measurements using the phase angle approach ... 21 0 Figure 9.5: Limit of linearity (LoL) data ..... 211 Figure 9.6: Apparent low shear viscosity ('70.02) data ... 212 Figure 9.7: Position of the local minimum data ... 214 Figure 9.8: Positive hysteresis data ... 215 Figure 9.9: High shear viscosity ('7100) data ... 216 Figure 9.10: Flow index of zone 2 (m) data ... 217 Figure 9.11: Fibre/fibril width histograms ofpulp (a), MFC (b) and H-MFC (c) ... 226 Figure 9.12: Ternary mixture diagram inc1uding investigated mixture ratios at al! solids
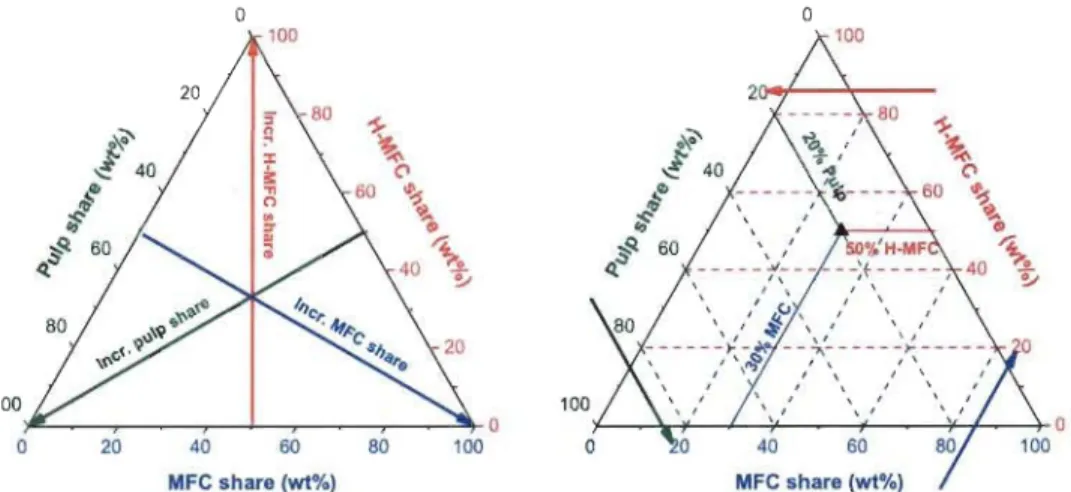
contents (blue circ1es) and additional ratios at 1.5 wt% (red triangles) .... 227 Figure 9.13: Visual guide for reading out the composition from a ternary mixture
diagram (Ieft) and a visual guide for a simplified, general read out of the composition trends (right) ... 228 Figure 9.14: Example of colourmap contour ternary diagrams ... 229 Figure 9.15: G'max data with individual scale bars for the single dilutions ... 230 Figure 9.16: T'Y,a data with individual scale bars for the single dilutions ... 231 Figure 9.17: LoL data with individual scale bars for the single dilutions ... 232 Figure 9.18: '70.02 data with individual scale bars for the single dilutions ... 233 Figure 9.19: Position of the local minimum data with individual scale bars for the single
dilutions ... 234 Figure 9.20: HRS+ data with individual scale bars for the single dilutions ... 235 Figure 9.21: '7100 data with individual scale bars for the single dilutions ... 236 Figure 9.22:
m
data with individual scale bars for the single dilutions ... 237 Figure 9.23: Loss modulus data with individual scale bars for the single dilutions .... .238 Figure 9.24: Phase angle data with individual scale bars for the single dilutions ... 239 Figure 9.25: KI data with individual scale bars for the single dilutions ... 240 Figure 9.26: nI data with individual scale bars for the single dilutions ... 241 Figure 9.27: End of zone 1 data with individual scale bars for the single dilutions ... 242 Figure 9.28: Start of zone 2 data with individual scale bars for the single dilutions .... 243Figure 9.29: Relative transition zone depth data with individual seale bars for the single dilutions ... 244 Figure 9.30: Negative hysteresis data with individual seale bars for the single dilutions .. ... 245 Figure 9.31: K2 data with individual seale bars for the single dilutions ... 246 Figure 10.l: Initial mind map on potential topies fOr this work. ... 253
List of tables
Table 2.1: List of commercialised MNFC products or MNFC production processes ... 8
Table 4.1: Details ofmeasurement system components used in this work ... 61 Table 7.1: Fitting function parameters of selected viscoelastic properties ... l31 Table 7.2: Fitting function parameters ofselected flow curve properties ... 140 Table 8.1: Statistical test decisions including the ANOV A test power and strength of
effect for hysteresis data ... 178 Table 8.2: Statistical test decisions for the hysteresis positioning data ... 181 Table 8.3: Average values and standard deviations of flow curve properties of the 9
individually evaluated flow curves per dilution ... 191 Table 8.4 Summary of the ANOV A test for the three triplicates within a dilution for
the tested flow curve properties ... 194 Table 9.1: Specific surface area data of the pulp, MFC and H-MFC materials, including the standard deviations for the MFC and H-MFC materials ... 207
R· K=~ Ro nRO+Ri
y = __
2_ RO-Ri M r = -2TtRf L . nY=-f3 3M r
=
2TtR3,
,,=-:-
y Cil tanD = Ct Cil D=
tan-1 -c' r = Kyn for r» ro L1 mm -. - 17min,th -17min 17min,th K . n· t -1 "min,th=
intYmin In log(17100j ) 1 170.02 nint - = log(100j ) 0.02 K - 170.02 int - O.02nint-1(C
H
)
D = tan-1 (iList of equations
Equation 2.1 ... 28 Equation 2.2 ... 32 Equation 2.3 ... 32 Equation 2.4 ... 32 Equation 2.5 ... 32 Equation 2.6 ... 32 Equation 2.7 ... 32 Equation 2.8 ... 35 Equation 2.9 ... 35 Equation 4.1 ... 69 Equation 5.1 ... 80 Equation 7.1 ... 123 Equation 7.2 ... 123 Equation 7.3 ... 124 Equation 7.4 ... 124 Equation 7.5 ... 124 Equation 7.6 ... 124 Equation 7.7 ... 127 i-lYi
=
0,01·10(5j29) ç1 Equation 8.1 ... 165 HÂ+=
~
Li ((Yi+l -l'a
("1 (l'a -
"2
(Yi)+
"1
(Yi+l) -"2 (Yi+l))
) : forYi
<
l'
a
HÂ-
=
~
IL
((Yi+1 - ya(171 (ya -172(Yi)+
171 (Yi+1) -172(Yi+1)))1 : for YH1<
Yi<
Yb Equation 8.3 ... 166 Equation 8.4 ... 167 H"=
1111(Ya+l)-112(Ya+1). (CY' - ' ) -h)1
A- 2 a+l Ya Equation 8.5 ... 167 h=
(Ya+cYa)(111(Ya)-112(Ya))(111 (Ya)-112(Ya) )+( 112(Ya+l)-111 (Ya+1)) Equation 8.6 ... 167 HA+ = HÂ+
+
HÂ: Equation 8.7 ... 167 HA -=
HÂ-+
HÂ*- Equation 8.8 ... 167Equation 8.9 ... 167 H'
=
21~' ((Yi+l-Yi)(lh (ya-112(Yi)+111(Yi+1)-112(Yi+l)))I' t .<'. < .
N- L..t 111(Yi)+112(ya+111(Yi+l)+112(Yi+l) . or Ya+1 Yt Yb
HN+ = HN+
+
HN*.r HN-=
HN-+
HN*-H~+
=
~Li
(log 111(Yi)+
log 111(~i+l)) : for Yi<
Ya 2 112 (y i) 112 (y i+l)HR-'
= -
11~ L..i(1
o g - ( 11 1C'ra
.. )+
1
og-(-111(Yi+l))1 . . . .. - ) : lor Ya+1<
Yi . .<
Yb2 112 y, 1/2 Y'+l
HR+ = Hi{+
+ Hi{:
HR-
=
Hi{-+
Hi{*-H RS+
=
~ L..i(1
og112(Yi) : 111(Ya) f or Yi -. < Ya .H
I
~(1
111(Yi))1 f ' . . RS- = L..i og 112(ya : or Ya+l< Yi
<
Yb Equation 8.10 ... 167 Equation 8.11 ... 168 Equation 8.12 ... 168 Equation 8.13 ... 168 Equation 8.14 ... 168 Equation 8.15 ... 168 Equation 8.16 ... 169 Equation 8.17 ... 169 Equation 8.18 ... 169 Equation 8.19 ... 169 Equation 8.20 ... 169 Equation 8.21 ... 169 Equation 8.22 ... 169List of abbreviations
AFM ... Atomic force microscopyANOV A ......... Analysis of variance BC ..... Bacterial cellulose SET ..... Brunauer-Emmett-Teller CMC ... ... Carboxymethyl cellulose CP AM ... Cationic poly acrylamide CS ... Cationic starch
CTE ... Coefficient of thermal expansion J ... Phase angle
Llmin .... Relative transition zone depths OLS ... Dynamic light scattering DoE ... Design of experiments DoF ........ ... Degree of fibrillation EDL. ... Electrical double layer ESD ... Equivalent sphere diameter
G' ..... Storage modulus
G" ...................... Loss modulus
y ...
Shear rate '7 ... ViscosityGCC ... Ground calcium carbonate H-MNFC ... High degree of fibrillation MNFC IMC .... Immobilisation cell
K .. ... Consistency coefficient
L-MNFC ... Low degree of fibrillation MNFC LoL. ... Limit of linearity
L VE ... Linear viscoelastic MFC ... Microfibrillated cellulose MNFC ... Micro-nano-fibrillated cellulose
NCC ... Nanocrystalline cellulose NFC ...... Nanofibrillated cellulose PCC ... Precipitated calcium carbonate PE ..... Polyethylene
PEO ... Polyethylene oxide
PHCH ... Pigment hydrocolloid hybrid PLA ... Poly lactic acid
PSD .... .......... Particle size distribution
?
..
...
...
Coefficient of determination s.c ... Solids contentSEM ... Scanning electron microscopy r.. ... Shear stress
Tr ... ... Yield stress tan6 ..... Loss factor
TEM ... Transmission electron microscopy TEMPO ... 2,2,6,6-tetramethylpiperidine-I-oxyl TMP ...... Thermo mechanical pulp
UQTR ....... University of Quebec in Trois-Rivières UVNIS ... Ultraviolet-visible spectroscopy wt% ... Weight percent
1.1 Nomenclature
Please note that the term micro nanofibrillated cellulose (MNFC) is used to describe the material that was investigated in this study. In the early work when the terminology was
still evolving (Chapter 5 - and Chapter 6 - ), other notations were used as weil for the same material (micro and nanofibriIIated cellulose, micro-nano-fibriIIated cellulose). For being more consistent with the currently used terms in this field, the term microfibrillated cellulose (MFC) is sometimes also used in this work (especially in later publications), again describing the same material. Nanocellu/ose is used as a collective term for different types of micrometre and nanometre sized cellulose materials. An overview on the different classes of cellulose materials, as weil as an extensive discussion of the terms MNFC and MFC is given in section 2.1.2.4.
1.2 Context
Following recent announcements in the field of nanocelluloses made by research institutes and industrial companies, one can see that up-scaling of certain production processes is occurring and full sc ale operation is imminent or already up and running (Archambault and Hamel 2014; Gerrer 2014; Svending 2014). In addition, one can also see a trend going more in the direction of "cost-efficient" grades of MNFCs, especially for large volume applications like, for example, paper based packaging materials. The term "cost-efficient" in the case of MNFC grade typically means that extensive chemical or biological treatments are excluded from the mainly mechanical production process. As a result, these grades may most probably have a significantly broader distribution of their intrinsic size scales. This is mainly caused by the presence of residual and not or only partially fibrillated fibres or fibril aggregates.
One example of such a cost-efficient MNFC material is produced in the presence of minerai filler, therefore finally leading to a filler containing, namely "pigmented", MNFC product (Schenker and Gane 2012; Svending 2014; Svending et al. 2016). On the one hand, the coprocessing of filler can positively influence the mechanical breakdown of pulp, but on the other hand, it also leads to an improved performance in sorne applications
wh en compared to a similar MNFC material that was initially processed without filler but with separately post-added filler (Schenker and Gane 2012; Schenker and Gane 2013; Schenker et al. 2015).
Whereas the up-scaling of the production process ofMNFC products is on-going, it seems that only little progress is made when it cornes to the up-scaling and/or commercialisation of potential MNFC applications. The one major application that was shown to be up-scalable is the use of MNFC as a wet and dry strength additive for certain paper grades which has been demonstrated in both pilot and full production scale (Svending 2014). However, as for most of the strength additive concepts, a major issue is the loss of bulk and, related to it, the typical loss of bending stiffness as macroscopic long fibres are replaced by the llÙCro structures of MNFC. In addition, there are already several, well working concepts on the market being able to solve the same issue for which the MNFC-concept is competing, e.g. achieving higher filler load.
On the other hand, an alternative, very promising way of using MNFC in paper production was recently presented, in laboratory scale, but also with the announcement of successful trials in pilot scale (Charfeddine et al. 2014; Svending et al. 2016). In laboratory scale, a dynallÙc sheet former was used whereas in pilot scale the MNFC suspension was applied on-line in a wet-on-wet and wet-on-partially dewatered configuration on a paper machine forrrùng a TMP base sheet by a Hydra-Sizer™ (Charfeddine et al. 2014) or on a unbleached Kraft base (Svending et al. 2016). It was shown that even a single side coating with low application weight is enough to maintain, or even increase, the bending stiffness compared to an uncoated reference paper having the same total weight, contrary to the experience, mentioned above, of adding the MNFC simply in bulk to the paper mass. ln the previous example, as the MNFC is applied during curtain coating as a di lute suspension through a narrow slit at relatively high rate, and furthermore onto a fast-moving substrate, the suspension is subjected to regions of high shear rate, extensional flow, and rapid changes of flow direction during the application process. Consequently, the rheological behaviour of such MNFC suspensions becomes a crucial issue, especially upon scale-up where even higher shear rates are to be expected. Additionally, the MNFC undergoes compound dewatering during the formation and drying of the sheet (Dirrùc-Misic et al. 20l3c).
ln addition to the well-known tendency for MNFC suspensions to exhibit a shear thinning behaviour, lately more work is published where an "irregular" rheological behaviour of su ch suspensions is observed at elevated shear rates (Roussière et al. 2014). Several hypotheses were proposed to explain these effects, however not yet fully supported by appropriate experimental confirmatory data. Furthermore, it was also shown that the rheological behaviour can be changed by the introduction of poly-electrolytes, or generally by changing the electrolytic conditions (Dimic-Misic et al. 2013a; Roussière et al. 2014; Sim 2014). In systems where additional materials, such as pigments and/or coating colour components, e.g. lattices, are present, the interactions, and consequently,
the rheological behaviour is even more complex. For instance, there is evidence that in high consistency fumishes containing MNFC, the pigment particles, and eventual pulp fibres, are not bound to the MNFC-gel network but act more like inert particles enabling them to move relatively freely within the liquid water trapped in the strong gel network (Dimic-Misic et al. 2013b).
In order to be able to select an appropriate additive (polymer and/or pigment) to adjust an MNFC suspension rheology for a given application, or being able to predict the effect of the addition of MNFC to a given system, such as a coating colour (Dimic-Misic et al. 2013a), the specific interaction between the additive, the species present in the MNFC and eventually other species is needed. However, only few publications investigate complex (multi-component), MNFC based systems systematically in order to form hypotheses on interaction mechanisms within such systems.
Chapter 2 - Literature review
2.1 Cellulose
Cellulose is the most abundant organic pol ymer on earth (Klemm et al. 2005), and furthermore it is a bio-polymer that is produced by nature. Most of the cellulose is found in plants where it is a structural component of the primary cell wall providing dimensional stability of the cell wall and ultimately to the overall plant structure (Wagenfiihr and Scholz 2008). The following sections give an overview on the structure of cellulose in more detail, but also on different macroscopic types of cellulose that are manufactured from the raw material wood into technical grades.
2.1.1 Structure
Cellulose is a linear, high molecular weight polymer built up from P-D-glucose units that are linked via P(1,4) bonds and belongs to the chemical group of poly saccharides. Cellulose of natural origin is organised in strongly bound bundles of cellulose polymers. The binding among the pol ymer chains happens via hydrogen bridges and is strong because one single P-D-glucose unit contains three hydroxyl groups. The hydrogen bridges on the one hand provide the stiffness of the cellulose molecules via intra-molecular interactions as weil as the strong binding to other cellulose polymers via inter-molecular interactions. These bundles are called elementary fibrils, several of such elementary fibrils again bind together to form a micro fibril. The polymer chains within an elementary fibril can either be aligned (i.e. crystalline) respective to each other or randomly oriented. (i.e. amorphous) (Wagenfiihr and Scholz 2008). By the relative arrangement of the cellulose molecules in the crystal domains, cellulose can be further classified into different types. However, the topie will not be diseussed further as the mechanical processes used in this work to process native wood cellulose into MNFC products do not change the crystalline morphology of the starting produet; that is I~ for native cellulose in higher plants. It should be noted that in the following section the same terminology Types is used to describe the nano- and micro-sealed morphology, i.e. of higher hierarchical order th an the morphology of the sole crystalline domains, and not to describe the difference in the crystalline morphology. The cellulose fibrils are found in
plants, providing mechanical stability as a rigid structure, together with other macromolecular compounds such as lignin, hemicellulose, and ev en proteins.
Depending of the source and the diminution procedure, different types of celluloses, not to be confused with the different allomorphs of cellulose, exist. The specific properties of those different types are further described in the next paragraph.
2.1.2 Types
Depending on how the cellulose pol ymer molecules are interacting and organised into larger entities, different types of celluloses with eventually significantly different properties occur. These different types are here briefly described.
2.1.2.1 Regenerated cellulose
Regenerated celluloses are produced by first dissolving pulp or another
cellulose-containing source and then regenerating it by mixing with another liquid that is not a solvent for cellulose. The dissolution of cellulose can either be done directly using e.g. tetra-arninecopper-dihydroxide or carbon disulfide and a high alkalinity as in the viscose process, or indirectly, by first modifying the cellulose e.g. by nitration or acetylation to foml a cellulose derivate that is soluble in other solvents. Those processed and products like viscose were already used around 1900. Recently, two new types of solvents for cellulose are investigated, namely ionic sol vents and deep eutectic solvents (Francisco et al. 2012; Kosan et al. 2008).
Depending on the regeneration process, films, foils, compacts or fine fibres are produced. Fibre morphology, e.g. length, thickness, shape, etc. is being influenced by the process parameters. A drawback of the regeneration process is that the solvent for cellulose typically cannot be completely removed from the regenerated cellulose material, especially in the case of traditional solvents (Zhang et al. 2005).
2.1.2.2 Bacterial cellulose (BC)
In contrast to the other types of celluloses, bacterial cellulose is not produced via breaking down pulp fibres, or other cellulose sources, but is synthesised by bacteria (Acetobacter species). The cellulose fibrils have diameters typically below 100 nm at a very narrow
diameter distribution and are typically long compared to mechanically fibrillated fibrils (Iwamoto et al. 2005; Moon et al. 2011).
2.1.2.3 Nano crystalline cellulose (NCC)
By subjecting cellulose to strong acid treatment, such as sulfuric acid, the cellulose po1ymer is hydro1ysed. As the amorphous parts of the fibri1s are more accessible than the crystalline parts, the hydrolysis is faster in these regions. By adjusting the process conditions (acidity, time, etc.), it is possible to retain the crystalline residues. In contrast bacterial-, fibrillated and regenerated- in the case of spun fibres - cellulose that have a "string"-like morphology; i.e. a one very large dimension compared to the two other ones, the NCC entities are platelet- or whisker shaped. As indicated by the denomination, these particles are crystalline and in the low nanometre range (Moon et al. 20 Il).
2.1.2.4 Micro nanofibrillated cellulose (MNFC)
In literature, the terms for fibrillated cellulose types are not as weIl defined as e.g. bacterial cellulose that refers to the origin or nano crystalline cellulose that refers to the particle morphology. Especially the term micro in micro fibrillated cellulose (MFC) might be eventually misleading as these fibrils too may be in the < 1 00 nm range. It is suggested by sorne authors, for example by Moon et al. (Moon et al. 20 Il), that the differentiation characteristic between nanofibrillated cellulose (NFC) and MFC is mainly the manufacturing process. Whereas MFC is typically obtained by purely mechanically disintegrating pulp, NFC manufacturing involves a pre-treatrnent like an oxidation, a grafting or an enzymatic treatment. The pre-treatment is on one hand used to reduce the amount of energy used in the mechanical fibrillation process step, and on the other hand 1eads to a decreased fibril size compared to MFC fibrils.
In contrast to the described terminology by Moon et al. (Moon et al. 20 Il), the term MNFC is used in this work to represent micro nanofibrillated cellulose, i.e. a product with a significant leve1 of microscopic fibres, including a micro fraction, which have nanofibrils formed on their surface by a high energy fibrillation process, as weIl as individualised nanofibrils. Effectively, it can be considered as a collective term for MFC and NFC materials, as most, mainly mechanically fibrillated MFCs and NFCs having both, micro- and nano-sized fibre/fibril fractions (Herrick et al. 1983; Roussière et al.
2014). According to Moon et al. (Moon et al. 2011), an MNFC product wou1d fall under the terrn MFC. However, due to the fact that very fine fibrils in the very low mn-range are also present in such products (individua1ised and on the surface of microfibrils), the terrn might be misleading. Therefore, it is here proposed that the terrn MNFC is more appropriate for fibrillated cellulose materials that do contain micro- as weil as nano-sized
features. Furtherrnore, it is suggested here to use the term NFC exclusively for products
that contain fibrils solely in the low nm range, e.g. < 100 mn. This is weB in line with the
proposai of Kangas et al. (Kangas et al. 2014), yet they promote to use the terrn MFC
rather than MNFC for materials that contain also coarser fibrils and/or fibres.
In short, MNFC is likely a more accurate term to describe a mechanically fibrillated
cellulose material, because ofits naturally broad fibril width distribution ranging from the
nanometre to the micrometre scale. Furtherrnore, it is also very Iikely to have
nanofibrillation on micrometre sized fibrils present in addition to individualised nanometre fibrils. So, materials named MFC and NFC in the literature can very likely
named MNFC as well, unless they are fractionated and/or strongly chernically modified.
The next section will have a focused look on the manufacturing, the properties and
potential fields of applications only for MNFC products as this work is will be limited to this type of cellulose.
2.2 MNFC
This section describes the manufacturing, the intrinsic properties as weil as the properties
ofMNFC in suspension, and potential applications ofthis material. The following sections
focus on fibrillated cellulose qualities and do not discuss NCC or Be.
2.2.1 Manufacturing
In recent years, many companies and institutes invested in the upscaling of MNFC
manufacturing pro cesses and the process optimisation to be able to deliver a cost-effective
product. Up to date (2015), there are several commercial technologies and accordingly
products available as seen in Table 2.1. However, there are many more pilot- and/or
pre-commercial systems in planning or aIready running (Bio-fibre 2015; Laurinsi1ta 2013;
Table 2.1: List of commercialised MNFC products or MNFC production processes.
Company /
Name Type Scale Source
Institute
Imerys FiberLean MNFC Onsite (several 1 000 (Svending
dmt/a)
2014) Offsite
American process Bioplus NFC/ Demonstration plant (Naderi 2014)
NCC
FP Innovations / Cellulose MNFC 5 t/d (Kruger
Kruger Filaments 2013)
GL&V UMaine CNF MNFC Onsite (Gerrer 2014)
Daicel Celish MNFC Unknown (Bames 2000)
2.2.1.1 Mechanical process
As already known for a long time from papermaking, wood can be processed into pulp by
mechanical action. If sufficient amounts of energy are introduced, pulp fibres can be
released from wood, eut or fibrillated as represented by fibrils or fibril bundles that are partially or completely liberated from the fibre. Specialised equipment like stone grinders
and refiners exists to break down wood into pulp fibres used for papermaking. These
pieces of equipment are optimised to end up with suitable fibres for papermaking that
typically have a diameter in the range of sorne tens of micrometres. To obtain MNFC, the
processes have to be carried on further, until more fibres are broken down into fibrils. Typically, the technologies used to produce pulp fibres are not able to apply enough force to the fibres in order to carry on the fibrillation action, or lead to fibre cutting or other
detrimental effects. Therefore, other processes or modification of existing technologies
Homogenising
The firsts to de scribe such a new process were Turbak, Snyder and Sandberg in 1983 (Turbak et al. 1983). They used a homogeniser to convert different pulp grades into MFC within 12 passes at a pressure drop of 55 MPa. As described by Ankerfors (Ankerfors 2012), such purely mechanical processes typically are energy intensive, typically in the are a of sorne tens of MWh per ton of cellulose. As a consequence, many researchers
investigated and work in the field is still on-going, to find suitable pre-treatments of the
pulp fibres or more energy efficient processes (see sections 2.2.1.2, 2.2.1.3, 2.2.1.4 and
2.2.1.5).
As mentioned above, homogenisers and rnicro-fluidisers are typical de vi ces used for the
production of MNFC products. Such machines typically consist of a pump that is able to
produce high pressures (sorne 10 up to 200 MPa) and an according high pressure zone.
The design of the zones then varies between the different models, but generally introduces
high shear forces due to fast flow velocities (shear rates), high and fast pressure changes
(drops) and eventually related secondary effects as for instance cavitation. These forces
are then partially isolating the cellulose fibrils. The maximal processable consistency for
such devices in laboratory scale is typically low, around 1 wt%. Intense pre-treatrnents
are needed (Zimmermann et al. 2010), as the device's size demands small orifices and/or
channels which would otherwise tend to clog.
Grinding
Another process that is often used to manufacture MNFC products is grinding, especially
using an ultrafine friction grinder such as the Supermasscolloider of Masuko Sangyo Co.,
LTD. The suspension is forced between a fixed and a turning grinding stone in order to
introduce high shear forces into the suspension, leading to a fibrillation of the pulp fibres.
The three main parameters that influence the fibrillation process are the revolution speed
of the turning stone, the clearance between the grinding stones, respectively the pressure
on the stones when they are operated in contact mode, and the number of passes.
Depending on the desired product and the feed material composition, different parameter
sets are used by different groups. Whereas the revolution speed is typically around 1500
rpm (Josset et al. 2014; Kangas et al. 2014; Nogi et al. 2009; Suopajarvi et al. 2010), the
very different (Josset et al. 2014; Suopajiirvi et al. 2010) or is sometimes not described at all (Kangas et al. 2014; Nogi et al. 2009). All necessary parameters to fully understand the operating conditions are rarely given in a publication, making a reproduction difficult. The maximal pulp consistency that can be processed is typically higher, around 1.5 to 3 wt%, compared to the on es common in the homogenising processes.
Refining·
A related process is proposed by GL&V, but also others, where a refiner with specially designed refmer discs is used to manufacture MNFC, described as NFC although the product appears to be rather coarse (Gerrer 2014). As an especially designed anti-clash system is mentioned in the presentation, it is very likely that the refiner operates at a very small gap compared to classical refining in order to be able to generate high enough forces to fibrillate pulp to the desired level of fmeness.
Ultra-sonication
Another method that is able to break down fibres, however, only rarely described, is ultra-sonication. For instance Chen et al. (Chen et al. 20 II) describe the use of a small laboratory ultrasonic generator to produce a NFC at high enough ultrasonic power outputs
(> 1000 W). However, if the specific energy input on fmal dry cellulose matter is calculated from the provided experimental data, values as high as 1 GWhr' are obtained. Of course, up-scaled systems may have a better efficiency and therefore the specific energy input may be smaller for larger systems, but still, the described energy levels are exorbitant. As a comparison, the net power output of modern nuclear reactors is in the area of 1 GW. Equipment that combines ultra-sonication with mechanical disintegration (shear forces) - e.g. the mechanical ultrasonic dispergator (ZR!) described by Suopajiirvi et al. (Suopajiirvi et al. 2010) is also used. The specific energy input levels are then drastically reduced, between 10 and 16 MWhr'. However, the obtained material is an MNFC type, rather than a true NFC. The two previous examples clearly illustrate two points. First, it seems that purely mechanical disintegration is too inefficient when it cornes to the production of NFC material, but may be suitable for MNFC materials.
Second, eventually the combination of different mechanical disintegration methods, either applied in series or in parallel, is the most efficient solution as the different processes have their highest efficiencies at different stages of fibrillation and/or degrees of fibrillation.
Cryo-crushing
Another, very rarely used method, is cryo-crushing, where moi st cellulose is frozen in liquid nitrogen and then crushed mechanically. However, it appears that this method has its limitations as it is typically coupled with other, suspension based mechanical disintegration processes (Ayse and Sain 2008; Jonoobi et al. 2009).
2.2.1.2 Co-processing of pigment particles
As described by Schenker and Gane (Schenker and Gane 2012), pigment particles, namely calcium carbonate, was added to the feed pulp suspension in order to ease the grinding and homogenising processes. Furthermore, Gane et al. described that the fibrillation efficiency was increased by the presence of the pigment particles (Gane et al. 20 12a; Gane et al. 2012b). Recently, the commercial launch of such a product, explicitly MFC produced in the presence of filler, was announced (Svending 2014). ln both cases, additional beneficial effects of co-processing pigment particles are seen in later applications. The products obtained by such pigment particle co-processing belong to the MNFC type of products, meaning that the products do contain features with dian;teters in the !lm-range as well as in the nm-range (Roussière et al. 2014; Schenker and Gane 2012).
The specific effect(s) of the pigment particles on the fibrillation process are not yet fully understood nor described, but they might be attributed eventually to localised increase of pH and a better transduction of mechanical energy. lncrease in locally available energy may either be due to because the pigment particles themselves acting as grinding medium and/or indirectly via changing the rheological properties of the processed suspension.
2.2.1.3 Chemical processes
Chernical pro cesses used for the manufacturing of nano crystalline cellulose like extensive acid hydrolysis (Elazzouzi-Hafraoui et al. 2008) will not be described here as such treatrnents typically are too aggressive to retain the fibrillar structure ofNFC. However,
the TEMPO (2,2,6,6-tetramethylpiperidine-1-oxyl) radical-mediated oxidation is able to partly retain some fibril length under the right conditions. The resulting fibrils have diameters in the 3 to 5 nm range but length still in the micrometre range and are typically and selectively grafted with carboxylate groups (Isogai et al. 2011). Typically, the TEMPO treated cellulose suspension is subjected to an additional mechanical
disintegration step in order to completely individualise the nanofibrils (Isogai et al. 2011; Saito et al. 2006). However, as the TEMPO treatment separates the fibrils or weakens the inter-fibril bonding quite intensely, only very little mechanical input is needed (Saito et al. 2006).
Typically, pre-treatments, especially the TEMPO-treatment, are employed when
NFC-type of products are targeted. On the one hand, such fine products cannot simply be obtained by pure mechanical processes, but on the other hand, su ch processes are rather extensive and therefore typically induce an increase a final product price. The latter case only can be justified by a "higher value" that would come from an NFC-type of product compared to an MNFC-type product.
2.2.1.4 Enzymatic process
An alternative to the TEMPO pre-treatment are enzymatic treatments. In contrast to chemical reactions, enzymes are typically more specific and selective in their reactions. Under the right conditions, it is possible to produce fibrils without too mu ch a shortening as described e.g. by Henriksson et al. (Henriksson et al. 2007) and Piiiikk6 et al. (Piiiikk6 et al. 2007). However, as the enzymes typically used are endoglucanases (types of cellulases), a too extensive treatment will lead to a complete depolymerisation of the cellulose into glucose sugars. Both authors report that by using an enzymatic pre-treatrnent and further mechanical disintegration steps enable the pulp feed material to be manufactured into MNFC fibrils, with width around 15 to 50 nm, and true NFC fibrils, around 5 nm. Yet no indication is given about any potential residual fibre content. Ankerfors (Ankerfors 2012) provides some calculations on the potential savings of mechanical energy input of an enzymatic pre-treatment compared to a pure mechanical fibrillation in a homogeniser. Yet, what is missing, and is also missing in other literature where the energy savings due to enzymatic pre-treatments are discussed, is the calculation of the additional costs due to the additional process steps, and eventual capacity limitations, and related extra capital investrnents, due to a comparatively long residence time in the bio-reactor.
As for the chemical pre-treatments, the targeted final product is more in the area of an NFC rather an MFC. However, recently an alternative, high consistency process involving