HAL Id: tel-03204106
https://tel.archives-ouvertes.fr/tel-03204106
Submitted on 21 Apr 2021HAL is a multi-disciplinary open access archive for the deposit and dissemination of sci-entific research documents, whether they are pub-lished or not. The documents may come from teaching and research institutions in France or abroad, or from public or private research centers.
L’archive ouverte pluridisciplinaire HAL, est destinée au dépôt et à la diffusion de documents scientifiques de niveau recherche, publiés ou non, émanant des établissements d’enseignement et de recherche français ou étrangers, des laboratoires publics ou privés.
therapeutic drug monitoring of patients treated by
targeted cancer therapy : application to tyrosine kinase
Inhibitors
Omar Ahmed
To cite this version:
Omar Ahmed. Contribution of capillary electrophoresis for the therapeutic drug monitoring of patients treated by targeted cancer therapy : application to tyrosine kinase Inhibitors. Human health and pathology. Université Montpellier, 2019. English. �NNT : 2019MONTS148�. �tel-03204106�
Rapport de gestion
2015
THÈSE POUR OBTENIR LE GRADE DE DOCTEUR
DE L’UNIVERSITÉ DE MONTPELLIER
En Chimie analytique
École doctorale Sciences Chimiques Balard
Unité de recherche Institut des Biomolécules Max Mousseron, UMR 5247
CNRS-UM-ENSCM, Université de Montpellier, France
Présentée par
Omar S.AHMED
Le 03 Décembre 2019
Sous la direction de Prof. Catherine PERRIN
et le co-encadrement de Dr. Yoann LADNER
Devant le jury composé de
Marianne Fillet, Professeur des Universités, Université de LiègeAnne Varenne, Professeur des Universités, Chimie ParisTech
Laurent Philibert, Praticien de Centres de Lutte Contre le Cancer, Institut du Cancer de Montpellier (ICM)
Yoann Ladner, Dr, Université de Montpellier
Catherine Perrin, Professeur des Universités, Université de Montpellier
Rapporteur Rapporteur Guest invité
Co-encadrant de thèse Directrice de thèse
Contribution of capillary electrophoresis for the
therapeutic drug monitoring of patients treated by
targeted cancer therapy: application to tyrosine
kinase inhibitors
Acknowledgement
I would like to express my deepest and sincere gratitude to my PhD director, Prof.
Catherine PERRIN, for her enlightening guidance and inspiring instruction in the development
and completion of this study. Pr. PERRIN stimulated my interest in the field of discourse
analysis and improved my ability in writing. In the process of meeting and discussion,
Pr. PERRIN not only provided prudent and pointed guidance but also gave me warm and
sincere support to complete my PhD.
I would like to pass my infinite thanks to Dr. Yoann LADNER who was a friend more than a
supervisor. Your comments, corrections, questions were the light for my studies. Without your
help, I couldn’t arrive to this day. And i am here at the end of my PhD because of your support
and help.
Dr. Pavel Dubský, I would like to thank you not only for helping me to solve a problem concerning
my research and to publish a paper with you. But the thanks start from the day you welcomed
me in your laboratory in Prague without knowing me before. You supported me with your smile,
gentleness, help, advice and science. You also showed me the beauty of Prague with your
guidance. You are a true idol for me. To Michal Malý, your intelligence, your passion for science
and your work added a huge value to my work which ended by a published paper. Wish you dear
Michael a good end of your PhD and a successful future.
I would like to thank Prof. Jean-Jacques VASSEUR, the director of École doctorale Sciences
Chimiques Balard and Mme Pascale DECOMBLE, Responsible administrative et financière Ecole
doctorale in Montpellier for their support and encouragement during PhD.
My infinite thanks to Prof. Thierry Durand, directeur de recherche première classe CNRS for his
non-stop help during my PhD.
I would like to thank Prof. Marianne Fillet and Prof. Anne Varenne for being members of the jury
and examine my work.
Also, I would like to thank Dr Laurent Philibert for for his help during my PhD to understand the
cancer, TKIs and hallmarks of cancer.
I am appreciative of the members of the great group, F12, Gaëlle Caussot, Jérôme Montels
and the other members of the group, for their support and encouragement.
I would like to thank also Adrien Chouchou for the support and the help given to me.
I would like to thank also Charf-eddine and Samira who was like a family to me in France.
Also, I would like to thank also Ayman El Jundi, Meriem Dadouch, Nawel benbouguerra, Moussa
and hajer for their fantastic support during my PhD.
I would like to pass my endless acknowledgments for the PhD grant given by Misr University for
science and technology (MUST), 6th October City, Egypt. Also, my endless acknowledgments to
Prof. Laila Abdel Fattah, Prof. Joseph Joachim and Prof. Emmanuel Cornillot the coordinators of
the collaboration between MUST University and the University of Montpellier.
Also, I would like to thank Dr. Marie-dominique Blanchin for her support and help. Without your
help I couldn’t speak French.
My endless thanks to Amr AHMED for his help and his advice to finish writing the PhD manuscript.
My endless thanks also to Ahmed H.Elmenoufy for his help during my PhD.
To Taher Hatahet, great thanks to you my friend for the advices and the encouragement given to
me to finish my PhD.
To my mother-in-law Dr. Afaf Yassin, thanks god that you are in my life.
To my father-in-law Mr. Abdel-fattah, you was like real father to me.
To my sisters-in-law Menna and Samaa, thank you both for the support given to me during PhD.
To my uncle Mohamed Omar, the father, the backbone in my life, I don’t have any words to
describe your support and the encouragement given to me. After the death of my Father, you
was the one taking care of me. (To the memory of my father died 05-5-2003)
To Prof/ Mohamed F. El-Miligi, I am blessed to have you in my life, to have your name as a
recommendation was an honor to me. God only knows my feeling towards you.
To my wife Alaa and to my two children Adam and Adham,
you are the secret of my life. Without you, I am nothing.
To the memory of my
mother
Table of abbreviations
Abl Abelson murine leukemia
ACN Acetonitrile
ADCC Antibody-dependent cellular cytotoxicity
ADME Absorption, distribution, metabolism and excretion
ADP Adenosine diphosphate
Akt, PKB, PDK1 Protein Kinase B
AFMC Analyte focusing by micelle collapse
ALK Anaplastic lymphoma kinase
ALL Acute lymphocytic leukemia
APCs Antigen presenting cells
ATP Adenosine triphophate
AUC Area under the curve
Bax Bcl-2–associated X
B.C. Before Christ
Bcl-xL B-cell lymphoma-extra-large
Bcl-2 B-cell lymphoma 2
BCR Break point cluster region
B cells Bursa of Fabricius cells
BGE Background electrolyte
BTK Bruton's tyrosine kinase
CARs Chimeric antigen receptors
CCD Contactless conductivity detector
CD4+ Cluster of differentiation 4+
CD8+ Cluster of differentiation 8+
CE Capillary electrophoresis
CEC Capillary electrochromatography
CGE Capillary gel electrophoresis
CIEF Capillary isoelectric focusing
Cmin Residual or trough concentration
CMC Critical micelle concentration
CML Chronic myeloid leukemia
CTLs Cytotoxic T lymphocytes
CYP3A4 Cytochrome P450 3A4
CZE Capillary zone electrophoresis
DAD Diode array detector
DLLME Dispersive liquid-liquid microextraction
DMSO Dimethylsulphoxide
DNA Deoxyribonucleic acid
d-SPE Dispersive solid phase extraction
EC Electrophorèse capillaire
ECM Extracellular matrix
ECZ Electrophorèse capillaire de zone
EGF Epidermal growth factor
EGFR Epidermal growth factor receptor
EMT Epithelial-to-mesenchymal transition
EOF Electro-osmotic flow
ERK Extracellular signal-regulated kinases
FASS Field amplified sample stacking
FASI Field amplified sample injection
FDA Food and drug administration
FGF Fibroblast growth factor
GC Gas chromatography
GIST Gastrointestinal stromal tumor
GTPases Guanosine triphosphatases
HCC Hepatocellular carcinomas
HER Human epidermal growth factor receptor
HF Hollow fiber
HGFR Hepatocyte growth factor receptor
HGF Hepatocyte growth factor
HIF-1 Hypoxia-inducible factor-1
HLB Hydrophilic lipophilic balance
ICM Institute of cancer in Montpellier
IGFR Insulin like growth factor receptor
IGF Insulin like growth factor
INR International normalized ratios
ITK Inhibiteurs de la tyrosine kinase
IUPAC International union of pure and applied chemistry
ITP Isotachophoresis
JAK Janus kinase
LC Liquid chromatography
LE Leading electrolyte
LIF Laser induced fluorescence
LLE Liquid-liquid extraction
LOD Limit of detection
LOQ Limit of quantification
LPME Liquid phase microextraction
LVSS Large volume sample stacking
mAb Monoclonal antibody
MAP Mitogen activated protein
Mcl-1 Induced myeloid leukemia cell differentiation protein
MDZ Micellar dilution zone
MEC Minimum effective concentration
MEKC Micellar electrokinetic chromatography
MEPS Microextraction by packed sorbent
m-RNA Messenger ribonucleic acid
MS Mass
MTC Maximum toxic concentration
m-TOR Mammalian target of rapamycin
NIH National cancer institute
NK cells Natural killer cells
NRTKs Non-receptors tyrosine kinases
NSCLC Non-small cell lung cancer
PBMC Peripheral blood mononuclear cell
PD Pharmacodynamic
PDGFR Platelet-derived growth factor receptor
PDMS Polydimethylsiloxane
PTFE Polytetrafluoroethylene
PI3-kinases Phosphoinositide 3-kinases
PIP3 Phosphatidylinositol (3,4,5)-trisphosphate
PK Pharmaccokinetic
PP Protein precipitation
PKB Protein kinase B
PS Pseudo-stationary phase
PTEN Phosphatase and tensin homolog
PTKs Protein tyrosine kinases
q Net charge of the analyte
QuEChERs Quick, easy, cheap, effective, rugged and safe
RB Retinoblastoma
RCC Renal cell carcinoma
RSD Relative standard deviation
RTKs Receptors tyrosine kinase
SALLE Salting-out liquid-liquid extraction
SARs Structure activity relationships
SBSE Stir bar sorptive extraction
SDME Single drop microextraction
SEF Sensitivity enhancement factor
SFKs Src family of kinases
SLM Supported liquid membrane
SPE Solid phase extraction
SPME Solid-phase microextraction
STP Suivi thérapeutique personnalisée
SULLE Sugaring-out assisted liquid-liquid extraction
Th cells Helper T cells
TAMs Tumor-associated macrophages
TCR T cell receptor
t-ITP Transient isotachophoresis
TGF-α Transforming growth factor alpha
TGF-b Transforming growth factor-beta
TKIs Tyrosine kinase inhibitors
TP53 Tumor protein 53
TSP-1 Thrombospondin-1
UK United Kingdom
UV Ultraviolet
Table of Contents
General Introduction………..1
Résumé de thèse………3
Chapter I……… ... 10
Tyrosine kinase inhibitors (TKIs)-mechanisms, uses, relevant problem and bioanalysis .. 10
Preface ... 11
1. Cancer ... 12
1.1. Defination of cancer ... 12 1.2. Cancer statistics ... 13 1.3. Hallmarks of Cancer ... 13 1.4. Cancer therapy ... 222. Targeted cancer therapy ... 23
2.1. Protein tyrosine kinases ... 25
2.2. Tyrosine kinase inhibitors ... 30
3. Overview of Therapeutic Drug Monitoring (TDM) ... 35
3.1. TDM and TKIs ... 36
4. Our project ... 44
4.1. Protocol used for the TDM of TKIs at the ICM ... 44
4.2. Selected TKIs for our project ... 45
5. Sample preparation ... 48
5.1. Protein precipitation (PP) ... 49
5.2. Liquid-liquid extraction (LLE)... 49
5.3. Solid phase extraction (SPE) ... 51
5.4. Dispersive solid-phase extraction (d-SPE) ... 52
5.5. QuEChERS ... 53
5.6. Microextraction techniques ... 54
6. Capillary electrophoresis (CE) ... 61
6.1. Introduction to CE ... 61
6.2. CZE theory ... 61
6.3. Analytical parameters and CE instrumentation ... 64
6.4. Hydrodynamic injection ... 65
6.5. Electrokinetic injection ... 66
6.7. Detection in CE ... 68
6.8. Stacking phenomenon in CE ... 70
6.9. TDM and CE ... 76
General conclusion of the chapter ... 81
References ... 82
Chapter II………125
Influence of salt and acetonitrile in the sample on CE analysis of TKIs……….…125
Preface ... 126
Section I ... 127
I.1 Materials and methods of sections II and IV ... 127
I.2 Preliminary results ... 129
References of section I ... 131
Section II ... 133
Paper 1: Influence of salt and acetonitrile on the capillary electrophoresis analysis of
imatinib in plasma samples ... 133
Section III (Supplementary results) ... 150
Section IV ... 169
IV.1 Application of the developed CE-UV methodology (section II) to human plasma spiked with the four TKIs………..…..169
References of section IV ... 170
General conclusion of the chapter ... 171
Chapter III ... 172
Salting-out assisted liquid-liquid extraction (SALLE) as an extraction technique: Application
to the CZE analysis of TKIs ... 172
Preface ... 173
Section I ... 174
I.1 Salting-out effect & SALLE ... 174
I.2 Clinical and bioanalytical applications of SALLE ... 176
I.3 Preliminary results ... 180
References of section I ... 183
Section II (published paper) ... 190
Paper 2: Coupling of salting-out assisted liquid-liquid extraction with on-line stacking for
the analysis of tyrosine kinase inhibitors in human plasma by capillary zone electrophoresis
... 190
Section III ... 210
III.1 Comparison of both methodologies developed in chapter II and chapter III for the extraction and quantification of the four TKIs: ... 210
Section IV ... 213
IV.1 Experimental: ... 213
IV.2 Results and discussion ... 215
General conclusion of the chapter ... 218
Chapter IV ... 219
Automation of the SALLE-CE methodology ... 219
Preface ... 220
Section I ... 221
I.1 Literature review on automation of sample extraction and analysis ... 221
References of section I ... 230
Section II ... 236
Paper 3: A fully automated on-line salting-out assisted liquid-liquid extraction capillary
electrophoresis methodology: Application to tyrosine kinase inhibitors in human
plasma ... 236
Supplementary results... 257
General conclusion of the chapter ... 259
Chapter V ... 260
Application of SALLE for the direct extraction of TKIs from blood ... 260
Preface ... 261
Ppaer 4: Direct salting-out assisted liquid-liquid extraction (SALLE) from human blood:
application for the analysis of tyrosine kinase inhibitors ... 262
General conclusion of the chapter ... 283
General conclusion and perspectives………....284
Table of figures
Résumé de thèse
Figure 1: Facteurs causant la variabilité interindividuelle de la concentration plasmatique des ITK……..4 Figure 2: structures moléculaires des inhibiteurs de la tyrosine kinase étudiés (ITK). (1) le mésylate d'imatinib, (2) le chlorhydrate d'erlotinib, (3) le sorafénib et (4) le ditosylate de lapatinib……….…….5 Figure 3: Électrophérogrammes obtenus à partir (A) de blanc (sans l’imatinib) et (B) d'un échantillon de mésylate d'imatinib dans le plasma humain. Conditions d'analyse : capillaire en silice 50 µm i.d., longueur totale : 30 cm, longueur effective 20 cm. BGE : acide citrique - tampon acide ԑ-aminocaproïque I 150 mM pH 2,0. Température : 25 ° C. Tension : 15 kV. Volume d'injection de l'échantillon : 156 nl (correspondant à 40% de la longueur du capillaire jusqu'à la fenêtre du détecteur). Détection : 254 nm.6 Figure 4 : Électrophérogrammes (A) d’un échantillon blanc de plasma (sans ITK) et solutions de plasma humain dopés avec les 4 ITK en utilisant la méthodologie SALLE (B) sans, (C) avec évaporation de l'extrait organique. Conditions analytiques : silice capillaire 50 µm i.d., longueur totale : 30 cm, longueur effective : 20 cm. BGE : acide citrique - tampon acide ԑ-aminocaproïque I 150 mM pH 2,0. Température : 25 ° C. Tension de séparation : 15 kV. Volume d'injection de l'échantillon : 313 nl (correspondant à 80% du volume capillaire jusqu'à la fenêtre du détecteur). Détection : 254 nm………..……8
Chapter I
Figure 1: Schema showing the linguistic journey to the origin of the word ''cancer''……….……12 Figure 2: Cancer and cardiovascular diseases are the leading causes of death in France in 2014 [5]……….13
Figure 3: The hallmarks of cancer [9,10]……….……….………..………..…14
Figure 4: Cell proliferation by the activation of EGFR………..…15 Figure 5: Therapeutic targeting of the hallmarks of cancer [10]………..………24
Figure 6: RTK Families. RTKs contain 20 subfamilies, shown here schematically with the family members listed beneath each receptor. Structural domains in the extracellular regions, identified by structure determination or sequence analysis, are marked according to the key. The intracellular domains are shown as red rectangles [78]………27
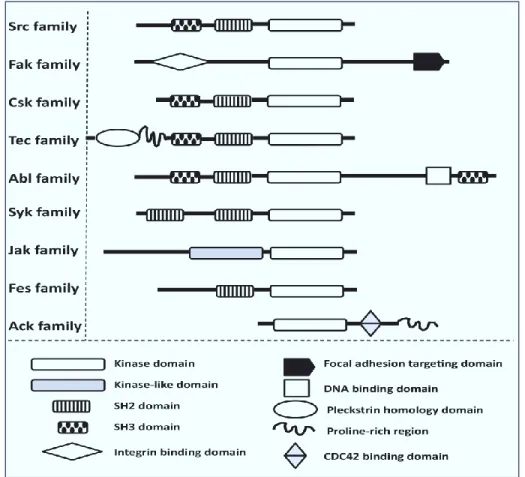
Figure 7: Domain organization of the major families of NRTKs. NRTKs are subdivided into nine main families, based on their similarities in domain structure. The catalytic (SH1, kinase), p-Tyr binding (SH2), and protein–protein interaction (SH3) domains share a high degree of homology [81]………..…..28
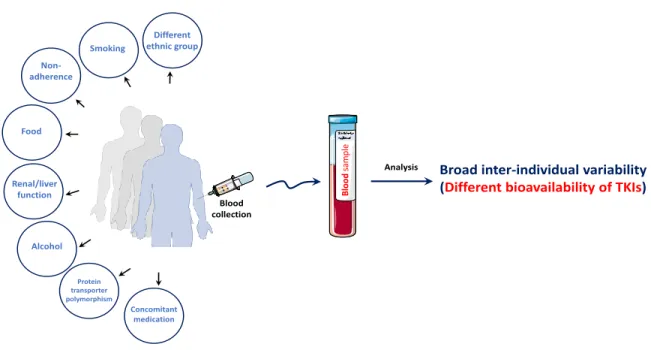
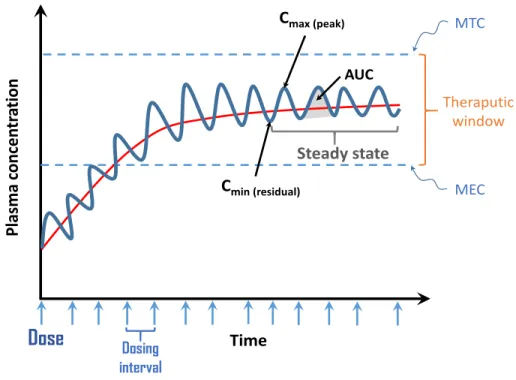
Figure 8: Back in-time journey showing the discovery of TKIs and the FDA approval until now………….30 Figure 9: Factors causing inter-individual variability of TKIs plasmatic concentration………..…..33 Figure 10: Variation of plasma concentration of a drug at multiple doses given at regular time bases…36 Figure 11: Protocol used at the ICM for the extraction of TKIs………..45
Figure 12: SALLE concept……….……..51
Figure 13: Schema of dispersion methodology by dispersive solid phase extraction……….53
Figure 14: Commercially available Quechers kits……….……….54
Figure 15: Classification of different microextraction techniques [300]. LPME: liquid phase micro extraction, SPME: solid phase microextraction, SDME: single drop microextraction, FNME: fiber-packed needle microextraction, MEPS: microextraction by packed syringe, HF-LPME: hollow fiber liquid phase microextraction, DLLME: dispersive liquid-liquid microextraction………..……….55
Figure 16: Various modes of SDME including direct immersion SDME, headspace SDME and three-phase SDME [305]………56
Figure 17: (A) Schematic representation of flat membrane-based liquid-phase microextraction [309]. (B) Schematic representation of HF-LPME system[310]………..……….57
Figure 18: The DLLME procedure [312]……….………58
Figure 19: Schematic overview of the micro-extraction by packed sorbent (MEPS) syringe [316]………59
Figure 20: Schematic of SBSE [324]……….……….60
Figure 21: Schema showing electro-osmotic mobility, electrophoretic mobility and apparent mobility of cations, anions and neutral substances………..………….…62
Figure 22: Schema showing electro-osmotic mobility, electrophoretic mobility and apparent mobility of cations, anions and neutral substances……….………..………63
Figure 23: Differential solute migration superimposed on electro-osmotic flow in capillary zone electrophoresis [338]...63
Figure 24: (A) Schematic diagram of the basic instrumentation for CE. The sample and the electrolyte solution are switched when making injections. (B) Cross section of a capillary column for capillary electrophoresis……….…64
Figure 25: Methods of sample injection. (A), (B) and (c) represent hydrodynamic injection while, (D) represent electrokinetic injection. (A) hydrodynamic injection by applying pressure at the inlet. (B) hydrodynamic injection by vacuum at the outlet. (C) hydrodynamic injection by elevating the injection reservoir relative to the exit reservoir. (D) electrokinetic injection………..……….65
Figure 26: Techniques for increasing the path length of the capillary. (A) Bubble cell and (B) Z-shape cell……….……….69
Figure 27: The mechanism of FASS……….…….…71
Figure 28: The mechanism of LVSS……….……….72
Figure 29: Mechanism of sweeping……….………73
Figure 30: Mechanism of pH mediated stacking……….………...74
Figure 32: Mechanism of AFMC……….………76
Chapter II
Section I
Figure 1: Analysis of imatinib mesylate and propranolol hydrochloride at the concentration of 5 and 20 µg/mL respectively at different I of the BGE 50, 100, 150 and 200 mM. Both compounds were prepared in (a) 100 % water (b) 1.0% NaCl (m/v) in water and (c) 2.0% NaCl (m/v) in water. Analysis conditions: silica capillary 50 µm i.d., total length 50 cm, effective length 40 cm. BGE: citric acid – ԑ-aminocaproic acid at pH 4.0. Temperature: 25°C. Separation voltage: 15 kV. Sample injection volume: 120 nL (corresponding to 15% of the capillary volume till the detector window). Detection: 254 nm………130 Figure 2: Effect of increasing I of the BGE on the form of peak of imatinib in the presence of 1.0% salt (m/v)……….….131
Section II
Figure 1: (A) Molecular structure of imatinib mesylate. (B) analysis of imatinib mesylate in 100% water at two different pH of the BGE. Analysis conditions: silica capillary: 50 µm i.d., total length: 50 cm. BGE: citric acid – ԑ-aminocaproic acid buffer IS 50 at pH 4.0 and at pH 2.0. Temperature: 25°C. Separation voltage: 15 kV. Sample injection volume: 60 nl (corresponding to 7.5% of the capillary length till the detector window). Detection: 254 nm………140 Figure 2: Analysis of imatinib mesylate at two different IS and pH of the BGE. Analysis conditions: silica capillary: 50 µm i.d., total length: 50 cm. BGE: citric acid – ԑ-aminocaproic acid buffer (A) IS 50 mM pH 4.0, (B) IS 150 mM pH 4, (C) IS 50 mM pH pH 2.0 (D) IS 150 mM pH 2.0. Temperature: 25°C. Separation voltage: 15 kV. Sample injection volume: 60 nl (corresponding to 7.5% of the capillary length till the detector window). Detection: 254 nm………..……….141 Figure 3: Simulation results of imatinib peak development in buffers of pH 4 and various IS values (in mM). See Experimental for simulation conditions. Time-frames at 2 min (120 s); the time is relevant to simulation conditions and do not correspond to experimental time. A) concentration profiles, Na and imatinib have separate y axes. B) trends of two measures, imatinib peak baseline (BLS) width and its separation from Na rear boundary, with IS. x-axis goes from higher IS values to lower IS values…….….143 Figure 4: Simulation results of imatinib peak development in buffers of pH 2 and various IS values (in mM). See Experimental for simulation conditions. Time-frames at 2 min (120 s); the time is relevant to simulation conditions and do not correspond to experimental time. A) profiles of imatinib. Arrows indicate stacked zones of imatinib that belongs to the same IS profile. B) profiles of the BGE co-ion, ε-aminocaproic acid (more to the left), and the sample co-ion, Na (more to the right)……….……144 Figure 5: Electropherograms of imatinib mesylate obtained after adding ACN solvent with a total capillary length of 50 cm. Analysis conditions: BGE: citric acid – ԑ-aminocaproic acid buffer IS 150 mM (A) pH 4.0 and (B) pH 2.0. Temperature: 25°C. Separation voltage: 15 kV. Sample injection volume corresponding to 7.5 % of the capillary length till the detector window. Detection: 254 nm……….……..146 Figure 6: Analysis of imatinib samples in 50/50 ACN/1.0% NaCl m/v water v/v. (A) Effect of sample injected volumes (57, 148, 295 nL corresponding to 7.5, 20 and 40% of the capillary length till the
detector window) on the analysis of imatinib mesylate. Analysis conditions: silica capillary 50 μm i.d., total length: 50 cm. BGE: citric acid – ԑ-aminocaproic acid buffer I 150 mM pH 2.0. Temperature: 25°C. Separation voltage: 15 kV. Sample injection volumes are expressed in percentage corresponding to the capillary length flled with the sample till the detector window. Detection: 254 nm. (B) Effect of injected sample volume (57 to 295 nL corresponding to 2.5 to 40% of the capillary length till the detector window) on imatinib peak height in different solubilizing medium (100% water, 1.0% NaCl m/v in water and 50/50 ACN/1.0% NaCl m/v water v/v)……….147 Figure 7: Electropherograms of the imatinib mesylate obtained from (A) blank sample (no imatinib) and (B) human plasma sample. Analysis conditions: silica capillary 50 µm i.d., total length: 30 cm. BGE: citric acid – ԑ-aminocaproic acid buffer IS 150 mM pH 2.0. Temperature: 25°C. Separation voltage: 15 kV. Sample injection volume: 156 nl (corresponding to 40% of the capillary length till the detector window). Detection: 254 nm………..……….148
Section III (Supplementary results)
Figure S 1: Simulation time-frames at pH 4.0, I 75 mM. Legend and units provided in section 1.1. Description of panels follows in the text. Horizontal dashed lines signify individual boundaries. Arrows (flags) points to the direction of boundary movement. Scales of x and y axes may differ for different panels……….……..152 Figure S 2 (two pages): Comparison between I 75 mM (left) and I 150 mM (right) at pH 4.0. Legend and units provided in section 1.1. Description of panels follows in the text. Horizontal dashed lines signify individual boundaries. Scales of x and y axes may differ for different panels but are kept the same for each pair of left and right panels. Time frames for I 75 mM are the same as in Figure S1……….156 Figure S 3 (two pages): Comparison between pH 4.0 (left) and pH 2.0 (right) at I 75 mM. Legend and units provided in section 1.1. Description of panels follows in the text. Horizontal dashed lines signify individual boundaries. Scales of x and y axes may differ for every panel as well as within every pair of left and right panels. Time-frames for I 75 mM are the same as in Figure S 1………..…162 Figure S 4 (two pages): Comparison between I 75mM (left) and I 150 mM (right) at pH 4.0. Legend and units provided in section 1.1. Description of panels follows in the text. Horizontal dashed lines signify individual boundaries. Scales of x and y axes are the same throughout the entire figure (except for x-axis, panel H). Time-frames for I 75 mM are the same as in Figure S 3………..166
Section IV
Figure 1: Electropherogram of 4 TKIs obtained from (A) standard and (B) human plasma samples. Analysis conditions: silica capillary 50 µm i.d., total length 30 cm, effective length 20 cm. BGE: citric acid – 6-aminocaproic acid buffer I 150 mM pH 2.0. Temperature: 25 ◦C. Separation voltage: 15 kV. Sample injection volume: 156 nl (corresponding to 40% of the capillary volume till the detector window). Detection: 254 nm……….…..169
Chapter III
Section I
Figure 2: Testing different mixture of ACN/water (v/v) at different concentration of salt (m/v)…….…..181 Figure 3: picture of a mixture of 50/50 (v/v) ACN/water and 10 % (m/v) of NaCl salt. Methyl red indicator solution was added and was mainly solubilized in organic phase……….……..182
Section II
Figure 1: Molecular structures of the studied Tyrosine Kinase Inhibitors (TKIs). (1) imatinib mesylate, (2) erlotinib hydrochloride, (3) sorafenib and (4) lapatinib ditosylate………..………198 Figure 2: Analysis of imatinib mesylate, lapatinib ditosylate, erlotinib hydrochloride and sorafenib in (a) lower (mostly aqueous) phase and (b) upper (mostly ACN) phase obtained by SALLE methodology. Analysis conditions: silica capillary 50 µm i.d., total length 50 cm, effective length 40 cm. BGE: citric acid – ԑ-aminocaproic acid buffer I 150 mM pH 2.0. Temperature: 25°C. Separation voltage: 15 kV. Sample injection volume: 60 nl (corresponding to 7.5% of the capillary volume till the detector window). Detection: 254 nm………199 Figure 3: Electropherogram of 4 TKIs obtained by SALLE methodology with a total capillary length of (A) 50 cm (effective length 40 cm) and (B) 30 cm (effective length 20 cm). Analysis conditions: BGE: citric acid – ԑ-aminocaproic acid buffer I 150 mM pH 2.0. Temperature: 25°C. Separation voltage: 15 kV. Sample injection volume till the detector window: 7.5 %. Detection: 254 nm………...200 Figure 4: Effect of sample injected volume (7.5, 15 and 80 % of effective capillary volume) on the separation of TKIs. Analysis conditions: silica capillary 50 µm i.d., total length 30 cm, effective length 20 cm. BGE: citric acid – ԑ-aminocaproic acid buffer I 1 150 mM pH 2.0. Temperature: 25°C. Separation voltage: 15 kV. Sample injection volumes are expressed in percentage of injected volume till the detector window. Detection: 254 nm……….………201 Figure 5: Effect of injected sample volume (from 7.5 to 80 % of effective capillary volume) on the analyte corrected peak areas. Analysis conditions: silica capillary 50 µm i.d., total length 30 cm, effective length 20 cm. BGE: citric acid – ԑ-aminocaproic acid buffer I 150 mM pH 2.0. Temperature: 25°C. Separation voltage: 15 kV. Sample injection volumes are expressed in percentage of injected volume till the detector window. Detection: 254 nm……….……….……….202 Figure 6: Electropherogram of 4 TKIs obtained from standard and human plasma samples using SALLE methodology. Analysis conditions: silica capillary 50 µm i.d., total length 30 cm, effective length 20 cm. BGE: citric acid – ԑ-aminocaproic acid buffer I 150 mM pH 2.0. Temperature: 25°C. Separation voltage: 15 kV. Sample injection volume: 30 nl (corresponding to 7.5% of the capillary volume till the detector window). Detection: 254 nm………..………..203 Figure 7: Electropherograms of (A) blank sample (no TKIs) and of the 4 TKIs obtained from human plasma samples using SALLE methodology (B) without, (C) with the evaporation of the organic extract. Analysis conditions: silica capillary 50 µm i.d., total length 30, effective length 20 cm. BGE: citric acid – ԑ-aminocaproic acid buffer I 150 mM pH 2.0. Temperature: 25°C. Separation voltage: 15 kV. Sample injection volume: 313 nl (corresponding to 80% of the capillary volume till the detector window). Detection: 254 nm………..……….………204
Figure 1: Electropherograms by method I and method II of the 4 TKIs obtained from human plasma samples. Analysis conditions: silica capillary i.d. 50 µm, total length 30 cm, effective length 20 cm. BGE: citric acid–-amino caproic acid buffer I 150 mM pH 2.0. Temperature: 25◦C. Separation voltage: 15 kV. Sample injection volume for method I was 156 nl (corresponding to 40% of the capillary volume till the detector window). For method II was 313nl (corresponding to 80% of the capillary volume till the detector window). Detection: 254nm……….…………211
Section IV
Figure 1: (A) effect of injected sample volume (from 7.5–80 % of effective capillary volume) on the analyte corrected peak areas. Analysis conditions: silica capillary 50 m i.d., total length 30 cm, effective length 20 cm. BGE: citric acid/6-aminocaproic acid buffer I 150 mM pH 2.0. Temperature: 25 ◦C. Separation voltage: 15 kV. Sample injection volumes are expressed in percentage of injected volume till the detector window. Detection: 254 nm. (B) zoom in on the curve of imatinib mesylate……….213 Figure 2: Electropherograms of imatinib mesylate obtained by SALLE methodology with a total capillary length of 50 cm (effective length 40 cm). Analysis conditions, BGE: citric acid/6-aminocaproic acid buffer I 150 mM pH (A) 2.0 and (B) 4.0. Temperature: 25◦C. Separation voltage: 15 kV. Sample injection volume: 7.5% of the capillary effective length. [imatinib] = 5.0 µg/mL. Detection: 254 nm………215 Figure 3: Effect of sample injected volume (7.5, 20, 40 and 50% of effective capillary volume) on imatinib analysis. Analysis conditions: silica capillary 50 m i.d., total length 50 cm, effective length 40 cm. BGE: citric acid/6-aminocaproic acid buffer I 150 mM, pH 4.0. Temperature: 25 ◦C. Separation voltage: 15 kV. Sample injection volumes are expressed in percentage of injected volume of the capillary effective length. Detection: 254 nm………..216 Figure 4: Effect of injected sample volume from (A) 2.5 to 40% and from (B) 2.5 to 20% of the capillary effective length on imatinib corrected peak areas. Analysis conditions: silica capillary 50 µm i.d., total length 50 cm, effective length 40 cm. BGE: citric acid/6-aminocaproic acid buffer I 150 mM pH 4.0. Temperature: 25 ◦C. Separation voltage: 15 kV. Sample injection volumes are expressed in percentage of injected volume till the detector window. Detection: 254 nm………217
Chapter IV
Section I
Figure 1: Schema of FIA………..……….………..….222 Figure 2: Hardware of SIA………223 Figure 3: Schema of SWIA………224 Figure 4: Typical LLE flow analysis system manifold using FIA……….……….225 Figure 5: Typical solid phase extraction flow analysis system manifold using FIA………226 Figure 6: Different interfaces used to couple FIA, SIA and SWIA with CE……….….227
Figure 7: Some commercially available robots used for sample preparation……….228 Figure 8: Schema representation of the developed system for in-syringe analysis [47]……….230
Section II
Figure 1: A-SALLE-CE-UV procedure. Step (1) delivering of appropriate micro-volumes of solutions (ACN and NaCl stock solution) from outlet side to the inlet side (sample vial) by hydroynamic injection in inverse mode. Followed by mixing by air bubbles injected from an empty vial (hydrodynamic injection in inverse mode). Step (2) after mixing, separation into 2 phases (upper mostly organic phase from bulk mostly aqueous phase) occurred. Step (3) hydrodynamic injection of the upper mostly organic phase (hydrodynamic injection, forward mode). Step (4) Separation and detection of the three TKIs by CE-UV………243 Figure 2: Molecular structures of (1) lapatinib ditosylate, (2) erlotinib hydrochloride and (3) sorafenib……….………244 Figure 3: Electropherogram of the 3 TKIs obtained from blank sample (no TKIs) and human plasma samples using A-SALLE-CE-UV procedure. Analysis conditions: silica capillary 50 µm i.d., total length 31 cm, effective length 21 cm. BGE: citric acid – ԑ-aminocaproic acid buffer IS 150 mM pH 2.0. Temperature: 25°C. Separation voltage: 15 kV. Sample injection volume: 39 nl (corresponding to 10% of the capillary effective length). Detection: 254 nm……….………245 Figure 4: Effect of increasing the hydrodynamic pressure during 6 minutes on the volume obtained of (A) ACN and (B) NaCl. Effect of increasing the time at 60 psi on the volume obtained of (C) ACN and (D) NaCl………247 Figure 5: Analysis of lapatinib ditosylate, erlotinib hydrochloride and sorafenib after injecting upper phase (mostly ACN) obtained by A-SALLE-CE-UV methodology. Analysis conditions: silica capillary 50 µm i.d., total length 31 cm, effective length 21 cm. BGE: citric acid – ԑ-aminocaproic acid buffer IS 150 mM pH 2.0. Temperature: 25°C. Separation voltage: 15 kV. Sample injection volume: 287 nl (corresponding to 70% of the capillary effective length). Detection: 254 nm………..249 Figure 6: Effect of the type of salting-out agent on (A) the corrected peak area and (B) the number of theoretical plates (N) of the 3 TKIs……….………..250 Figure 7: Electropherograms of the 3 TKIs obtained from blank plasma sample (no TKIs) and human plasma samples spiked with the three TKIs using A-SALLE-CE-UV procedure. Analysis conditions: silica capillary 50 µm i.d., total length 31 cm, effective length 21 cm. BGE: citric acid – ԑ-aminocaproic acid buffer IS 150 mM pH 2.0. Temperature: 25°C. Separation voltage: 15 kV. Sample injection volume: 287 nl (corresponding to 70% of the capillary effective length). Detection: 254 nm……….……251
Supplementary results
Figure 1: Schema of adjusting an eppendorf (Thermoscientific, Pittsburgh, USA) of 600 µL to be placed in a plastic CE vial………..………257
Figure 2: Two phases separation after applying A-SALLE procedure visually verified by the addition of 2 µL methyl red indicator……….……….………..257
Chapter V
Figure 1: Structures of the four selected TKIs. (1) imatinib mesylate, (2) lapatinib ditosylate, (3) erlotinib hydrochloride and (4) sorafenib………..…………..271 Figure 2: SALLE procedure of TKIs from human plasma and blood………..………..272 Figure 3: electropherograms of (A.a) imatinib mesylate, (B.a) lapatinib ditosylate, erlotinib hydrochloride and sorafenib, final concentration of 5.0 µg/ml at pH (A) 4.0 and pH (B) 2.0 of the BGE. (A.b) and (B.b) represent the electropherograms obtained for blank standard samples (no TKIs). Analysis conditions: silica capillary 50 µm i.d., total length 30 cm, effective length 20 cm. BGE: citric acid – ԑ-aminocaproic acid buffer I 150 mM. Temperature: 25°C. Separation voltage: 15 kV. Sample injection volume: (A) 78.31 nl (corresponding to 20% of the capillary volume till the detector window) and (B) 313 nl (corresponding to 80% of the capillary volume till the detector window). Detection: 254 nm………..273 Figure 4: electropherograms of (A.a) and (A.c) imatinib mesylate, (B.a) and (B.c) lapatinib ditosylate, erlotinib hydrochloride and sorafenib, final concentration of 5.0 µg/ml at pH (A) 4.0 and pH (B) 2.0 of the BGE in (A.a) plasma and (A.c) blood samples. (A.b), (A.d), (B.b) and (B.d) represent the electrophergrams obtained for blood and plasma blank samples. Analysis conditions: as in figure 3………274 Figure 5: chromatograms of SALLE upper phase extract of TKIs standard solutions at concentration of 5.0 µg/ml. (A.a) analysis of imatinib mesylate standard solution using C18 column 100 mm*2.1 mm*5.0µm, isocratic elution using ACN/phosphate buffer 5.0 mM at pH 7.0, 70/30 (v/v), flow rate 1.5 ml/min and detection at 256 nm. (B.a) analysis of the three others TKIs (erlotinib hydrochloride, sorafenib and lapatinib ditosylate) extracted also by SALLE using Altima phenyl column 250 mm*4.6 mm*5.0 µm, gradient elution using ACN/ammonium acetate (20 mM), flow rate 2.0 ml/min and detection at 256 nm. (A.b) and (B.b) represent the chromatograms obtained for blank standard samples (no TKIs) under the same conditions as standard solutions………..………..275 Figure 6: chromatograms of blank (no TKIs), blood and plasma samples spiked with TKIs (5.0 µg/ml). (A.a) and (A.c) represent analysis of imatinib in plasma and blood samples respectively. (B.a) and (b.c) represent analysis of the three others TKIs in also in plasma and blood samples respectively. (A.b), (A.d), (B.b) and (B.d) represent the chromatograms obtained for blood and plasma blank samples. Analysis conditions: as in figure 5……….……….………276
Table of tables
Chapter I
Table 1: Classification of cancer immunotherapy [74]………..………...25
Table 2: TKIs, their targets and their therapeutic indications………..…..31 Table 3: LC-UV and LC-DAD methods for the quantitation of TKIs………..37 Table 4: LC-MS and LC-MS/MS methods for the quantitation of TKIs………..…..….40 Table 5: Chemical structures, physicochemical properties and trade names of the selected TKIs…………47 Table 6: Summary of the CE modes and their applications………..…………68 Table 7: Application of CE in bioanalysis……….……….78
Chapter II
Section II
Table 1: Summary of the quantitative results achieved on plasma samples with injected sample volume equal to 40% of the capillary volume till detector window……….………....148
Chapter III
Section I
Table 1: Most recent applications of SALLE in different fields……….175 Table 2: Clinical and bioanalytical applications of SALLE……….………..……….…..177 Table 3: Salting-out data for the phase-separation by sodium chloride [16]………..……….…181
Section II
Table 1: Summary of SALLE-CE-UV quantitative results achieved on plasma samples with injected sample volume equal to 80 % of the capillary volume till detector window……….205
Section III
Table 1: Comparison between method I based on PP by ACN and method II based on SALLE for the analysis of imatinib mesylate………..………….……..……..……….211
Chapter IV
Section II
Table 1: Summary of A-SALLE-CE-UV quantitative results achieved on plasma samples with injected sample volume equal to 70 % of the capillary effective length………..………252
Supplementary results
Chapter V
Table 1: Mobile phase composition……….……….………..268 Table 2: Summary of SALLE-LC-UV and SALLE-CE-UV quantitative results achieved on blood samples………277
“Science is always
wrong. It never solves a
problem without
creating ten more.”
1
Cancer is a major burden of disease worldwide. Each year, tens of millions of people are diagnosed with cancer around the world, and more than half of the patients eventually die from it [1]. There are many types of cancer treatment depending on the type and the stage of cancer. Targeted cancer therapies are considered as the next generation of evolutionary cancer therapies with less toxicity and more specificity towards cancer [2].
Tyrosine kinase inhibitors (TKIs) are a class of targeted therapy used in the treatment of many types of malignant diseases. TKIs have many advantages including ease of administration by oral route and ability to target multiple cellular survival pathways [3]. In clinical practice, oncologists spend long time to adapt the dose of TKIs for every patient to increase the efficacy of treatment and to minimize as much as possible associated adverse side effects. Indeed, the inter-patients pharmacokinetic variability of TKIs is reported in several studies and was related to genetics, drug-drug interactions, poor adherence, concomitant food intake or drug food interaction, different ethnic group, renal and/or hepatic functions and environment factors [4].
Therapeutic drug monitoring (TDM) of TKIs was suggested in many studies as a tool to improve the efficacy and safety profile of the treatment [5]. Routine TDM of TKIs requires to develop analytical methodologies to measure their concentration. At the institute of cancer in Montpellier (ICM) in France, the protocol used for the analysis of TKIs from patients’ plasma is a multistep (12 steps) extraction-HPLC-UV protocol. This time consuming protocol doesn’t allow the doctor to take a decision concerning the dose of TKIs during the time of medical consultation with the patient. Moreover, this could adversely affects patients’ quality of life in terms of having frequently to go to the hospital to finish his/her consultation and to have the correct dose of TKIs. These constraints besides, the adverse effects associated with TKIs therapy, contribute to emotional distress among cancer patients.
This work developed in this PhD consisted in studying the contribution of CE, more specifically capillary zone electrophoresis (CZE), as an analytical technique for the TDM of patients treated by TKIs. The objective was to develop generic CZE methodology that can be used for the TDM of different TKIs. Four TKIs were chosen for this project namely imatinib mesylate, erlotinib hydrochloride, lapatinib ditosylate and sorafenib. All the above contexts are the subject of the first chapter of this manuscript.
In the second chapter, the factors affecting the analysis of TKIs in plasma samples by CZE are discussed. These factors are related to the high content of salt and biological proteins in plasma. A special program called Simul, which displays the dynamics of separation process inside the CE capillary was used to
2
understand the behavior of TKIs in high saline aqueous matrix such as human plasma. The treatment of human plasma sample has been also studied in chapter, this step being a major source of errors and usually time-consuming. At the end of the chapter, a simple, sensitive, specific and cost-effective CE-UV methodology was proposed for the analysis of human plasma samples spiked with imatinib in the context of TDM.
In the third chapter, an extraction method based on salting-out liquid-liquid extraction (SALLE) was tested for the extraction of the all four TKIs from human plasma. This method has the advantages to eliminate biological proteins, salts and to extract TKIs from plasma. This SALLE method was coupled to CE-UV for the separation of TKIs in an easy operational procedure, with low consumption of organic solvent and environmental benignity. A comparison between the analytical performance of SALLE method and the method developed in chapter II was also discussed.
In the fourth chapter, a fully automated analytical methodology combining SALLE and CE for the analysis of TKIs in plasma samples was evaluated. This automated methodology combines the advantages of manual SALLE-CE-UV methodology in a simple and easy way without any modifications to the commercially available CE instrument. A comparison between the analytical performances of manual and automated SALLE methodology was established.
Finally, in the last chapter, the developed SALLE methodology was applied for the direct extraction of TKIs from blood. The SALLE technique was coupled to liquid chromatography (LC) with UV detection as CE-UV. Both methodologies (SALLE-CE-UV and SALLE-LC-UV) were compared in terms of their analytical performances to be considered as a valuable tool in the TDM for the fast extraction and the direct analysis of TKIs after whole blood sample collection.
Reference
[1] X. Ma, H. Yu, Cancer Issue: Global Burden of Cancer, Yale J. Biol. Med. 79 (2006) 85–94. [2] V.V. Padma, An overview of targeted cancer therapy, Biomed. 5 (2015) 1–6.
[3] T. Kuo, G.A. Fisher, Current status of small-molecule tyrosine kinase inhibitors targeting epidermal growth factor receptor in colorectal cancer, Clin. Colorectal Cancer. 5 (2005) 62-70. [4] H.J. Klümpen, C.F. Samer, R.H.J. Mathijssen, J.H.M. Schellens, H. Gurney, Moving towards dose
individualization of tyrosine kinase inhibitors, Cancer Treat. Rev. 37 (2011) 251–260.
[5] T. Terada, S. Noda, K.I. Inui, Management of dose variability and side effects for individualized cancer pharmacotherapy with tyrosine kinase inhibitors, Pharmacol. Ther. 152 (2015) 125–134.
1
Omar S.AHMED
Apport de l’électrophorèse
capillaire pour le Suivi
Thérapeutique Personnalisé de
patients traités par
thérapie ciblée: Application aux
Inhibiteurs de Tyrosine Kinase
4
Résumé de thèse
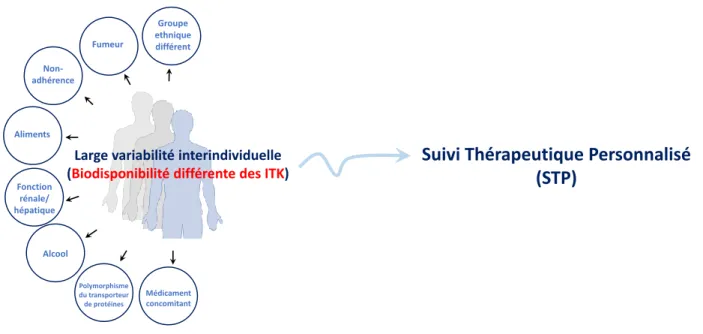
L’objectif de ce travail a consisté à étudier l'apport de l'électrophorèse capillaire (EC), plus spécifiquement l'électrophorèse capillaire de zone (ECZ), en tant que technique analytique pour les patients traités par les inhibiteurs de la tyrosine kinase (ITK). La première partie du chapitre I donne un aperçu de l’importance des ITK, de leur problème et de la nécessité de quantifier leur concentration plasmatique à intervalles réguliers en appliquant le suivi thérapeutique personnalisée (STP). Les ITK sont des médicaments qui bloquent l’action d’une enzyme, la tyrosine kinase. Cette enzyme participe au processus de signalisation qui se déroule dans les cellules une fois que les facteurs de croissance se sont fixés aux récepteurs présents sur les cellules. La tyrosine kinase joue un rôle dans la communication, le développement, la division et la croissance des cellules [1]. Les ITK sont utilisés dans le cadre de la thérapie ciblée contre le cancer et repose sur une inhibition du facteur de croissance. Ils peuvent être utilisés pour empêcher la croissance d’une tumeur. En outre, la prise par voie orale facilite le traitement pour les patients. La variabilité pharmacocinétique des ITK entre patients est rapportée dans plusieurs études [2] et serait liée à de nombreux facteurs, tels que le régime alimentaire, la consommation ou non de tabac, d’alcool ou médicaments. Les facteurs responsables de la variabilité inter-individuelle de la concentration plasmatique des ITK qui affecte l'efficacité du traitement sont mentionnés à la Fig. 1.
Figure 1: Facteurs causant la variabilité interindividuelle de la concentration plasmatique des ITK
Le STP est la pratique clinique consistant à mesurer des médicaments spécifiques ou leurs métabolites à des intervalles de temps spécifiés afin de maintenir une concentration constante dans la circulation
Médicament concomitant Non-adhérence Aliments Fumeur Fonction rénale/ hépatique Alcool Polymorphisme du transporteur de protéines
Large variabilité interindividuelle (Biodisponibilité différente des ITK)
Groupe ethnique différent
Suivi Thérapeutique Personnalisé
(STP)
5
sanguine du patient, optimisant ainsi le dosage pour chaque patient. Le STP des ITK nécessite de développer des méthodes analytiques pour mesurer les concentrations plasmatiques des ITK.
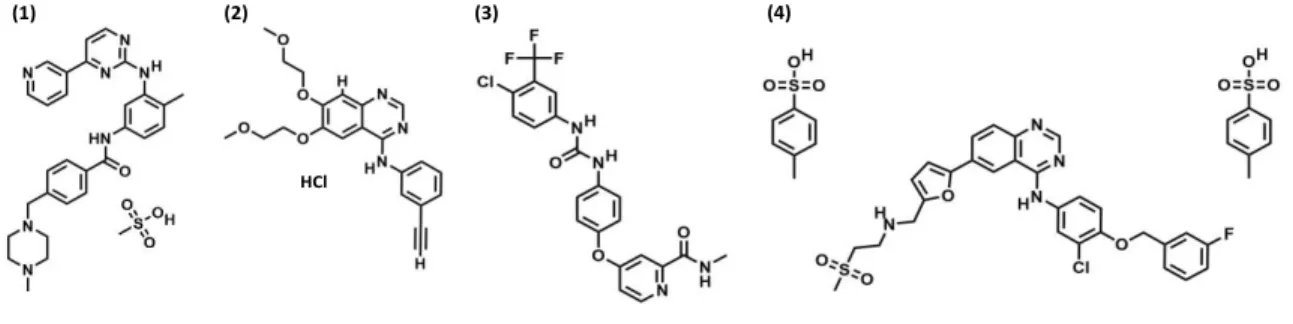
L'objectif de ce projet a été de développer une méthode d'analyse générique utilisant l’EC et pouvant être utilisée pour le STP de différents ITK. Quatre ITK ont été choisis pour ce projet : le mésylate d'imatinib, le chlorhydrate d'erlotinib, le sorafénib et le ditosylate de lapatinib (Fig. 2).
Figure 2: structures moléculaires des inhibiteurs de la tyrosine kinase étudiés (ITK). (1) le mésylate d'imatinib, (2) le
chlorhydrate d'erlotinib, (3) le sorafénib et (4) le ditosylate de lapatinib.
Une revue détaillée des différentes méthodes de préparation des échantillons utilisées pour extraire les analytes au sein de matrices biologiques, en particulier le plasma humain, est décrite et discutée. Cette étude bibliographique montre que la précipitation biologique de protéines à l’aide de solvants tels que l’acétonitrile (ACN) est la méthode la plus courante, la plus simple et la plus facile à appliquer. Elle permet d’obtenir des taux de recouvrement élevés des ITK dans le plasma.
Le chapitre II décrit une méthodologie analytique simple, sensible, spécifique et peu coûteuse qui a été développée durant ce projet pour l'analyse d’échantillons de plasma dopés à l’imatinib par ECZ-UV. Plusieurs conditions d'analyse comme la force ionique (I) et le pH de l'électrolyte de fond (BGE) composé d'acide citrique et d'acide ε-amino caproïque ont été testés. L’effet de la présence de présence de chlorure de sodium (NaCl), naturellement présent dans des échantillons de plasma à une concentration proche de 1,0% (m/v), sur le comportement électrophorétique de l’imatinib a été étudié. Des simulations informatiques réalisées avec le logiciel Simul (groupe ECHMET, université de Prague, République-Tchèque) ont été utilisées pour aider à l’interprétation des résultats expérimentaux et ainsi comprendre le comportement électrophorétique de l'imatinib dans un capillaire en présence de NaCl. Lors de tests à différents pH (2 et 4) et différentes force ionique I de BGE (de 50 à 150 mM), différentes formes ont été observées expérimentalement pour le pic d'imatinib et ont pu être corrélées avec la simulation informatique. Ces expériences ont prouvé que la déformation du pic d'imatinib était une conséquence de la présence de sel (ion sodium) dans l'échantillon, qui conduit à des mobilités de l’imatinib différentes
HCl
6
dans la zone d’échantillon en fonction du pH et de la force ionique du BGE. L’ajout d’ACN dans l’échantillon de plasma pour précipiter les protéines a permis d’améliorer la symétrie du pic à pH 2, permettant d’analyser l’imatinib dans des échantillons de plasma grâce à cette procédure simplifiée. Les Fig. 3A et 3B montrent les électrophérogrammes obtenus pour le plasma blanc (sans imatinib) et le plasma dopé à l'imatinib après précipitation des protéines par l’acétonitrile. Aucun pic interférent n’a été observé, ce qui démontre la spécificité de la méthode proposée. Le volume maximum d'échantillon injecté sans déformation du pic était de 156 nL (correspondant à 40% du volume capillaire jusqu'à la fenêtre du détecteur) et était similaire à celle obtenue avec une solution échantillon d'imatinib standard seul. Ce résultat indique que les performances de pré-concentration en ligne sont similaires pour les deux solutions injectées (étalon et échantillon plasmatique) et confirme la robustesse de la méthode proposée pour l'analyse de l’imatinib dans des échantillons de plasma.
Figure 3: Électrophérogrammes obtenus à partir (A) de blanc (sans l’imatinib) et (B) d'un échantillon de mésylate
d'imatinib dans le plasma humain. Conditions d'analyse : capillaire en silice 50 µm i.d., longueur totale : 30 cm, longueur effective 20 cm. BGE : acide citrique - tampon acide ԑ-aminocaproïque I 150 mM pH 2,0. Température : 25 ° C. Tension : 15 kV. Volume d'injection de l'échantillon : 156 nl (correspondant à 40% de la longueur du capillaire jusqu'à la fenêtre du détecteur). Détection : 254 nm.
Les limite de détection (LOD) et limite de quantification (LOQ) à 48 et 191 ng/mL, respectivement ont été obtenues à partir du surnageant des échantillons de plasma après précipitation avec l’ACN. Celles-ci sont beaucoup plus faibles que la concentration plasmatique moyenne d’imatinib observée chez des patients traités par le mésylate d’imatinib (environ 1000 ng /ml). Une bonne linéarité a été obtenue dans la gamme de concentration de 191 à 5000 ng/mL (r2> 0,997). Des écarts types relatifs inférieurs à 1,68% et à 2,60%
7
quantification. La même méthodologie a été appliquée pour les trois autres ITK (le chlorhydrate d'erlotinib, le sorafénib et le ditosylate de lapatinib). Bien que les formes de pics obtenues soient symétriques, les performances de la méthode en termes de LOQ et de résolution des pics, notamment dans le cas du lapatinib, n'étaient pas suffisantes par rapport à la concentration plasmatique du lapatinib (environ 1740 ng/mL). Une autre stratégie pour extraire et concentrer les quatre ITK a été développée par la suite.
Dans le chapitre III, le couplage d’une méthode d’extraction, salting-out liquid-liquid extraction (SALLE), à l’analyse par CZE a été développée pour surmonter les limitations rencontrées avec la méthode développée précédemment. La méthode SALLE est une méthode d’extraction liquide-liquide dans laquelle l'addition de sels (par exemple NaCl) dans une solution d'échantillon composée d'un mélange miscible d'eau et un solvant organique (tel que ACN ou acétone) induit la séparation en deux phases (la phase organique et la phase aqueuse).
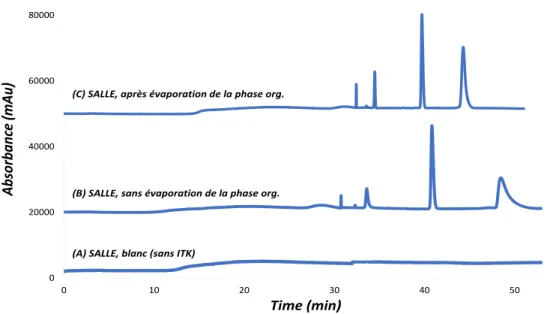
La méthode SALLE a permis d’extraire les 4 ITK d’intérêt dans la phase organique, ici l’ACN, avec des rendements d’extraction variant entre 60 et 100%. La phase organique contenant les molécules extraites a ensuite pu être analysée avec une séparation des ITKs en moins de 30 minutes par l’ECZ-UV. La pré-concentration en ligne des ITKs dans le capillaire a pu être développée grâce à la présence d’ACN dans l’échantillon et a permis de détecter les ITKs à des concentrations allant jusqu’à 200 μg/mL. La méthode SALLE-EC-UV a ensuite été appliquée à l’analyse des 4 ITKs dans le plasma humain et a donné des résultats similaires à ceux obtenus avec des solutions étalons. La Fig. 4 montre les électrophérogrammes obtenus à partir de plasma pour un volume d’échantillon injecté de 313 nl (correspondant à 80% du volume capillaire jusqu'à la fenêtre du détecteur). La Fig. 4A montre l’injection d’un échantillon blanc (sans ITK). La Fig. 4B montre l'électrophérogramme obtenu à partir de plasma dopé avec les 4 ITK. Aucun pic interférant au temps de la migration des analytes n’a été détecté, démontrant la spécificité de la méthode. En comparant les résultats obtenus avec la solution étalon, les profils électrophorétiques obtenus pour les 4 ITK, et particulièrement pour le sorafénib, sont très différents en termes de temps de migration, de formes de pic et de résolution. Cela peut être lié à un effet de la matrice entre les échantillons de plasma et les solutions étalons, notamment en ce qui concerne la teneur en sel. La Fig. 4C montre l’électrophérogramme d’un plasma dopé avec les quatre ITK après évaporation de la phase organique obtenue après la méthode SALLE et reconstitué dans de l’ACN. Une grande amélioration en termes de temps de migration, de formes des pics et de résolutions des 4 ITK a été observée, se rapprochant du profil obtenu avec la solution étalon. L’augmentation du signal observée après l’évaporation de
8
l’échantillon (Fig. 4C) peut être attribuée à l’élimination partielle des sels résiduels. Les limites de quantification de l’imatinib mésylate, du lapatinib ditosylate, du chlorhydrate d’erlotinib et du sorafenib ont été déterminées à 380, 900, 62 et 350 ng /mL, respectivement. Ces valeurs de LOQ sont bien inférieures aux concentrations plasmatiques moyennes observées chez les patients traités par les ITK. Des écarts-types relatifs (RSD) inférieurs à 1,24 et 2,84% sur les temps de migration et les aires corrigées, respectivement, ont été observés à la limite de quantification montrant la bonne répétabilité de la méthode basée sur l’utilisation de l’EC.
La méthode SALLE-CE-UV développée ici offre un certain nombre d’avantages, notamment une grande capacité de séparation entre les analytes, une procédure opérationnelle simple, une faible consommation de solvant organique, un faible impact environnemental et une forte tolérance à des matrices fortement salines.
Figure 4 : Électrophérogrammes (A) d’un échantillon blanc de plasma (sans ITK) et solutions de plasma humain dopés
avec les 4 ITK en utilisant la méthodologie SALLE (B) sans, (C) avec évaporation de l'extrait organique. Conditions analytiques : silice capillaire 50 µm i.d., longueur totale : 30 cm, longueur effective : 20 cm. BGE : acide citrique - tampon acide ԑ-aminocaproïque I 150 mM pH 2,0. Température : 25 ° C. Tension de séparation : 15 kV. Volume d'injection de l'échantillon : 313 nl (correspondant à 80% du volume capillaire jusqu'à la fenêtre du détecteur). Détection : 254 nm.
Dans le chapitre IV, la méthode de SALLE-EC-UV présentée au chapitre précédent a été entièrement automatisée. Cette méthode, appelée A-SALLE-EC-UV, permet le dessalage, la précipitation des protéines, l’extraction liquide-liquide automatisée, la pré-concentration en ligne et la séparation électrophorétique
0 20000 40000 60000 80000 0 10 20 30 40 50
(C) SALLE, après évaporation de la phase org.
(B) SALLE, sans évaporation de la phase org.
(A) SALLE, blanc (sans ITK)
Ab sorba nc e (mAu ) Time (min)
9
des analytes dans les échantillons de plasma de manière totalement intégrée. Cette méthodologie a été réalisée sans aucune modification au niveau de l’instrument commercial d’électrophorèse capillaire. Cette nouvelle approche, A-SALLE-EC-UV, a été appliquée pour l'analyse de 3 des ITK précédemment étudiés dans des échantillons de plasma. Cette méthode a été validée en termes de linéarité, LOQ, LOD et répétabilité. Ainsi, il peut être considéré comme un moyen rapide, simple, peu coûteux, pratique et bien adapté à un possible STP d’ITK.
Dans le dernier chapitre, des échantillons de sang de patients ont été traités par la technique SALLE, méthode décrite dans le chapitre III, pour l’extraction et la quantification d’ITK. Les échantillons obtenus ont ensuite pu être analysés par CE-UV ou chromatographie liquide-UV. Ces méthodes analytiques, SALLE-CE-UV et SALLE-LC-UV offrent de nombreux avantages en combinant une procédure d'extraction plus rapide à partir d'échantillons de sang et une grande efficacité de la séparation. Les performances des deux méthodologies ont été évaluées en termes de LOQ, LOD, spécificité, répétabilité, temps total d'analyse et de coût.
References
[1] C. Natoli, B. Perrucci, F. Perrotti, L. Falchi, S. Iacobelli, Consorzio Interuniversitario Nazionale per Bio-Oncologia (CINBO), Tyrosine kinase inhibitors, Curr. Cancer Drug Targets. 10 (2010) 462–83.
[2] H.J. Klümpen, C.F. Samer, R.H.J. Mathijssen, J.H.M. Schellens, H. Gurney, Moving towards dose individualization of tyrosine kinase inhibitors, Cancer Treat. Rev. 37 (2011) 251–260.
Tyrosine kinase inhibitors
(TKIs)-mechanisms, uses,
relevant problems and
bioanalysis
Omar S.AHMED
11
Preface
In this chapter, an introduction about cancer disease and the hallmarks causing this disease are discussed. In addition, a state-of-the-art on the importance of TKIs in targeted cancer therapy, their mechanisms of action, their use and associated issues will be presented. Also, the significance to measure the plasmatic concentrations of ITK on a regular basis to adapt their doses, i.e. Therapeutic Drug Monitoring (TDM) will be discussed. Eventually, an overview about the extraction methods used for the analysis of drugs from biological matrices is given. In addition, the importance of capillary electrophoresis (CE) technique for the bioanalysis of as an alternative technique to liquid chromatography (LC) is discussed.
12
1.
Cancer
1.1.
Definition of cancer
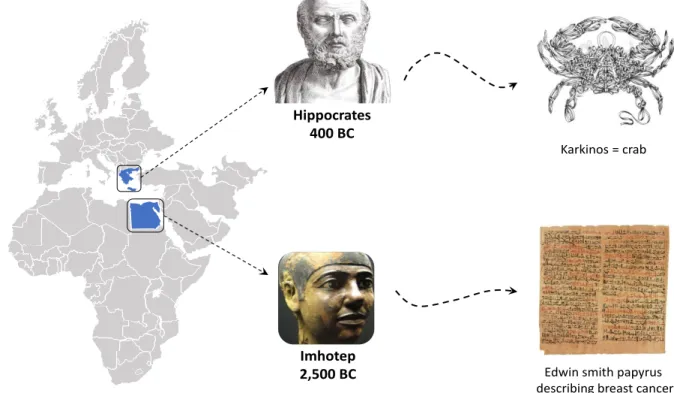
According to the national cancer institute [1], cancer is a term for diseases in which abnormal cells divide without control and can invade nearby tissues. Cancer cells can also spread to other parts of the body through the blood and lymph nodes systems. Edwin smith papyrus, possibly attributable to Imhotep (the Egyptian physician-architect), described the first documented case of breast cancer. The case was deemed incurable if the disease was “cool to touch, bulging and spread all over the breast”. Yet it was more than 2000 years later – around 400 BC that the Greek physician Hippocrates first named a mass of cancerous cells ‘’karkinos’’, the Greek word for ’’crab’’ (Fig. 1) [2]. This was because the finger-like spreading projections from a cancer called to his mind the shape of a crab.
Figure 1: Schema showing the linguistic journey to the origin of the word ''cancer''
According to the cancer research center in the United Kingdom (UK) [3], there are more than 200 types of cancer, characterized by abnormal cell growth. Many cancers are in the form of solid tumors, which are masses of tissue while, other types such as leukemia, generally do not form solid tumors. Cancerous tumors are malignant as they can spread into, or invade nearby tissues. In addition, as these tumors grow, some cancer cells can break off and travel to distant places in the body through the blood or the lymph system and form new tumors far from the original tumor.
Hippocrates 400 BC
Imhotep 2,500 BC
Karkinos = crab
Edwin smith papyrus describing breast cancer
13
1.2.
Cancer statistics
Cancer is responsible for more than one-fourth of deaths worldwide [4]. In France, cancer accounted for 28.5% of all deaths in 2014, followed by cardiovascular diseases (25%) [5]. Statistics presented gender differences as shown in Fig 2. 33% of all deaths among men were related to cancer. This proportion was lower among women with 24% of the total number of deaths compared to 27% for cardiovascular diseases. Occurrence of cancer is mainly correlated to the high rate of cigarette smoking and to the high consumption of alcohol, which are considered as risk factors for developing cancer [6,7].
Figure 2: Cancer and cardiovascular diseases are the leading causes of death in France in 2014 [5]
The number of new cases of cancer in 2018 in France was estimated at nearly to 455,618 for both sexes. Between 2007 and 2016, the number of new cases of cancer was estimated at 356,109 per year, an increase by nearly 22% was observed in 2018. Two main factors contribute to such increase: 1/an ageing populationand 2/delayed effect from the increase of women smokers [8]. The rate of lung cancer among women has increased by 5% every year since 1990 and now 45% of all cancers among women in France are lung cancer. All of these numbers show the devastating effect of cancer disease. In order to rationalize the complexity of cancer, we have to understand the hallmarks of cancer that will help to further understand the strategies used for the treatment of cancer.
1.3.
Hallmarks of Cancer
The hallmarks of cancer are a list of properties that cancerous cells all have in common. These properties are gained through mutations to genes that produce proteins responsible for cell division and cell survival. In 2000, D. Hanahan [9] published a very well-known article describing the hallmarks of cancer. They were
![Figure 2: Cancer and cardiovascular diseases are the leading causes of death in France in 2014 [5]](https://thumb-eu.123doks.com/thumbv2/123doknet/14658205.739124/45.918.115.810.345.612/figure-cancer-cardiovascular-diseases-leading-causes-death-france.webp)
![Figure 5: Therapeutic targeting of the hallmarks of cancer [10]](https://thumb-eu.123doks.com/thumbv2/123doknet/14658205.739124/56.918.156.772.102.519/figure-therapeutic-targeting-hallmarks-cancer.webp)