RESEARCH OUTPUTS / RÉSULTATS DE RECHERCHE
Author(s) - Auteur(s) :
Publication date - Date de publication :
Permanent link - Permalien :
Rights / License - Licence de droit d’auteur :
Institutional Repository - Research Portal
Dépôt Institutionnel - Portail de la Recherche
researchportal.unamur.be
University of Namur
Meaning of relative gene expression in multilayered cultures of epidermal keratinocytes
Malaisse, Jérémy; Hermant, Maryse; Hayez, Aurélie; Poumay, Yves; Lambert de Rouvroit, Catherine Published in: Experimental dermatology DOI: 10.1111/exd.12501 Publication date: 2014 Document Version
Early version, also known as pre-print Link to publication
Citation for pulished version (HARVARD):
Malaisse, J, Hermant, M, Hayez, A, Poumay, Y & Lambert de Rouvroit, C 2014, 'Meaning of relative gene expression in multilayered cultures of epidermal keratinocytes', Experimental dermatology, vol. 23, no. 10, pp. 754-756. https://doi.org/10.1111/exd.12501
General rights
Copyright and moral rights for the publications made accessible in the public portal are retained by the authors and/or other copyright owners and it is a condition of accessing publications that users recognise and abide by the legal requirements associated with these rights. • Users may download and print one copy of any publication from the public portal for the purpose of private study or research. • You may not further distribute the material or use it for any profit-making activity or commercial gain
• You may freely distribute the URL identifying the publication in the public portal ? Take down policy
If you believe that this document breaches copyright please contact us providing details, and we will remove access to the work immediately and investigate your claim.
Meaning of
relative gene expression in
multilayered cultures of epidermal keratinocytes
Jérémy Malaisse, Maryse Hermant, Aurélie Hayez, Yves
Poumay and Catherine Lambert de Rouvroit
Cell and Tissue Laboratory, URPHYM-NARILIS, University of Namur, Namur,
Belgium
Correspondence: Professor Yves Poumay, Cell and Tissue Laboratory, URPHYM-NARILIS, University of Namur, 61 Rue de Bruxelles, B-5000 Namur, Belgium.
Tel: +32-81-724257 Fax: +32-81-724261
Abstract
Reconstructed human epidermis (RHE) has become an in vitro model of choice for studying cell and tissue functions. Analysis of gene expression over the course of reconstruction must take into account the heterogeneous differentiation states of keratinocytes reconstituting the typical epidermal layers. In monolayer cultures, relative mRNA expression levels of differentiation markers are usually expressed as a ratio versus a classical reference gene (also named house-keeping gene) tested to be expressed equally in certain experimental conditions. Applied to complex tissues in which the cell number increases over time together with differentiation, calculation of relative gene expression does not take enough into account a crucial phenomenon: epidermal morphogenesis results in progressive restriction of differentiation markers, such as involucrin, to a specific layer, or in the delayed onset of mRNA expression of filaggrin or TMEM45A for instance following stratification. Our study illustrates that comparing the relative expression level of mRNAs to that of a basal layer-specific gene (e.g. ITGA6) better illustrates the contribution of layer-specific differentiation markers to the process of epidermal morphogenesis.
Background
Several culture models are available for the study of epidermal keratinocytes, from monolayers to multilayered reconstructed tissues (1). Recently, the development of reconstructed human epidermis (RHE) from stratified cultures of keratinocytes produced at the air-liquid interface over a porous membrane (2,3) or on a dermal matrix (4) has enriched experimental approaches of epidermal functions, such as those linked to the barrier. However, the heterogeneous differentiation states of keratinocytes involved in stratification of the RHE, renders the analysis of gene expression more complicated than in monolayers.
For analysis of gene expression, specific messenger RNA are quantified using most often qRT-PCR. In order to account for the cell number in each sample, the expression level of the gene of interest is divided by the mRNA level of a reference gene, i.e. a gene considered as transcribed at a constant level in defined experimental conditions. Diverse
reference genes are proposed (5), including GAPDH (6), cytoskeletal components, or ribosomal genes (RPLP0 or RPL13a) (5-9). The choice of adequate reference gene is better based on experimental selection of the most stable candidate (5). Applied to autocrine keratinocyte monolayers undergoing differentiation, normalization of mRNA levels to RPL13a appears suitable. Indeed, the relative expression levels of most epidermal differentiation genes increase as confluence is attained, accurately reflecting the change in cell phenotype revealed by loss of proliferation and clonogenicity, together with initiation of cell stratification (9).
Question addressed
The purpose of this letter is to draw attention of researchers to take caution when analyzing gene expression in RHE with techniques developed in the context of homogeneous cell populations. In particular, we show that comparing the relative expression level of mRNAs encoding differentiation markers to that of a basal layer-specific gene better illustrates the development of the morphogenesis process.
Experimental design
This study is focused on analysis of the relative mRNA expression of several epidermal differentiation markers during in vitro morphogenesis of RHE, and comparison to the distribution of the corresponding proteins by immunohistochemistry (2). Procedures for RNA extraction (3), qRT-PCR (Supplementary method and Table 1) and calculation of relative mRNA expression by the Ct method were performed as described (5,8). The differentiation process was controlled with keratin 10 and involucrin staining (Figure S1).
Results
In order to assess whether RPL13a is an adequate reference gene in our experimental settings, the immunoreactivity of the RPL13a gene product was monitored during the
reconstruction process. The RPL13a signal appeared uniformly distributed at all times throughout the living layers of the RHE (Figure 1), reflecting a constant mRNA expression level in every cell confirmed by geNorm analysis (10)(Figure S2). In addition, we sought to compare the mRNA levels of the genes of interest to those of mRNA species expressed solely in the basal layer (keratin 14; KRT14 and alpha6 integrin subunit; ITGA6). Immunostaining of the corresponding proteins revealed homogeneous labelling of every cell of the basal layer over the entire reconstruction period (Figure 1).
In parallel to these immunolabelling results, the relative mRNA levels of the basal markers ITGA6 and KRT14 decreased in comparison with RPL13a, as expected from the increasing number of cells (respectively Figure 2a and 2b).
Using RPL13a as reference gene, the relative expression levels of KRT10 and loricrin (Figure 2c and 2d) increased during reconstruction of the epidermis, suggestive of the development of a differentiated cell compartment. However, the relative expression of FLG was nearly stable (Figure 2e) and the relative expression levels of KRT14, IVL and TGM clearly decreased over the same period (Figure 2b, 2f and 2g). Similar results were observed using the mean of TBP and RPLP0 expression as reference (Figure S3). At first glance, these observations sounded in discordance with the progressive reconstruction of correctly differentiated epidermal layers shown by Frankart et al. (2). However, one has to consider other interpretations considering the various distributions of differentiation markers.
Indeed, the immunolabelling signals of KRT10 or FLG, which are barely detectable before stratification of keratinocytes, appear in differentiating layers during tissue reconstruction (2). Conversely, the immunoreactivity of IVL, a differentiation marker expressed at a significant level on day 1, concentrates in RHE in upper spinous and granular layers. This progressive restriction of IVL protein distribution likely explains why its relative expression to RPL13a decreases over the duration of culture (Figure 2f).
On the other side, calculation of relative mRNA levels compared to basal markers KRT14 or ITGA6 resulted in higher ratios as compared to those calculated in regard of RPL13a. After normalization with ITGA6, the changes in mRNA levels over time faithfully illustrate the process of differentiation, which is less evident using KRT14 as a reference. As an example, calculation in regard of ITGA6 indicated that the relative expression of IVL remained rather constant (Figure 2f). Simultaneously, the relative expression of TGM increased (Figure 2g). Interestingly, analysis of a novel marker of the granular layer, TMEM45A, showed stable expression in regard of RPL13a, whilst its level increased over time in regard of ITGA6 (Figure 2h). This result is in accordance with the distribution of TMEM45A immunoreactivity, which is present at a low level on day 1 and progressively concentrates in the granular layer (Figure S1)(11). The kinetics of both TMEM45A expression level and protein profile are reminiscent of that of FLG and TGM, known markers of the granular layer.
Conclusions
In conclusion, the meaning of relative gene expression varies between one homogeneous cell population on one hand, and the heterogeneous population found in complex tissues on the other hand. Altogether, expression levels calculated in regard of the ITGA6 mRNA during RHE morphogenesis best illustrate the localized distribution of markers, challenging the classical meaning of reference gene.
Author contributions
JM and YP designed the study. JM, MH and AH performed the research. JM, YP and CL analysed the data. JM,YP and CL wrote the paper.
Conflict of interest
Acknowledgments
Technical help from Noëlle Ninane, Catherine Demazy, Valérie De Glas, Benoît Balau and Daniel Van Vlaender is gratefully acknowledged. AH is research fellow funded by FRIA. Financial support from FNRS (1.5.033.06F and 2.4.522.10F) to YP.
References
1. Poumay Y, Coquette A. Arch Dermatol Res 2007: 298:361-369
2. Frankart A, Malaisse J, De Vuyst E et al. Exp Dermatol 2012: 21:871-875
3. De Vuyst E, Charlier C, Giltaire S et al. 2013 Methods Mol Biol doi 10.1007/7651_2013_40
4. van Drongelen V, Alloul-Ramdhani M, Danso MO et al. Exp Dermatol 2013: 22:807-812
5. Vossaert L, O'Leary T, Van Neste C et al. BMC Mol Biol 2013: 14: 21 6. Barrault C, Dichamp I, Garnier J et al. Exp Dermatol 2012: 21: 314-316
7. Poumay Y, Jolivet G, Pittelkow MR et al. Arch Biochem Biophys 1999: 364:247-253 8. Minner F, Poumay Y. J Invest Dermatol 2009: 129:770-773
9. Minner F, Herphelin F, Poumay Y. Methods Mol Biol 2010: 585:71-82 10. Allen D, Winters E, Kenna PF et al J dermatol Sci 2008: 49:217-25 11. Hayez A., Malaisse J., Roegiers E et al. Exp Dermatol 2014: 23(5):339-44
Figure 1: Localization of alpha6 integrin subunit, keratin 14 and RPL13a during reconstruction of an epidermis. Immunofluorescent staining of transversal histological
sections of RHE and of normal skin. RHE were analyzed after 1, 3, 5, 7, 9 or 11 days of reconstruction. Primary antibodies against RPL13a, alpha6 integrin subunit (ITGA6), and keratin 14 (KRT14) were used, followed by Alexa 488-conjugated secondary antibodies
(green). Nuclei are stained by Hoechst 33258 (blue). Sections were observed under confocal microscopy. Normal human skin is shown as control (bars = 50 µm).
Figure 2 : mRNA expression of differentiation markers normalized to keratin 14, alpha6 integrin subunit or RPL13a during the reconstruction of human epidermis. Total RNA
was extracted from reconstructed human epidermis (RHE) after 1, 3, 5, 7, 9 or 11 days of growth.Reverse transcription was then performed and cDNA analyzed by real-time PCR. The expression levels of alpha 6 integrin subunit (ITGA6; a), keratin 14 (KRT14; b), keratin10 (KRT10; c), loricrin (Lor; d), filaggrin (FLG; e), involucrin (IVL; f), transglutaminase (TGM; g) and TMEM45A (h) were normalized to expression of RPL13a (blue), KRT14 (green), or ITGA6 (red). The mRNA level at day 1 was taken as reference and arbitrarily set at 1. The y-axis is a logarithmic scale and error bars represent 95% confidence intervals (n=3, ANOVA 1RM, *P<0.05, **P<0.01, ***P<0.001 vs 1d).
Supplementary figures
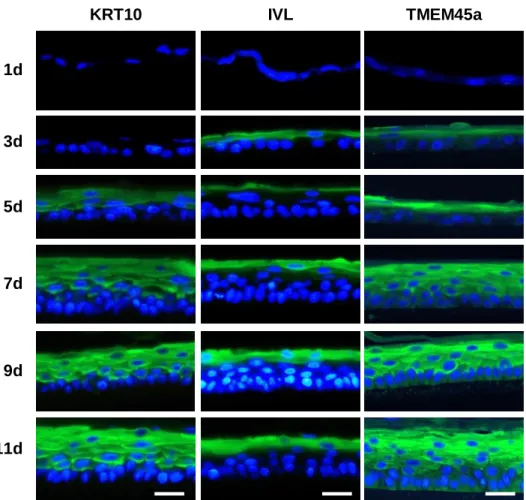
Figure S1: Localization of KRT10, IVL and TMEM45a during reconstruction of an epidermis. Immunofluorescent staining of transversal histological sections of RHE. RHE were analyzed after 1, 3, 5, 7, 9 or 11 days of reconstruction. Primary antibodies against keratin 10 (KRT10), involucrin (IVL), TMEM45a were used, followed by Alexa 488-conjugated secondary antibodies (green). Nuclei are stained by Hoechst 33258 (blue). Sections were observed under epifluorescence microscopy. (bars = 25 µm).
1d 7d 5d 3d 9d 11d IVL KRT10 TMEM45a
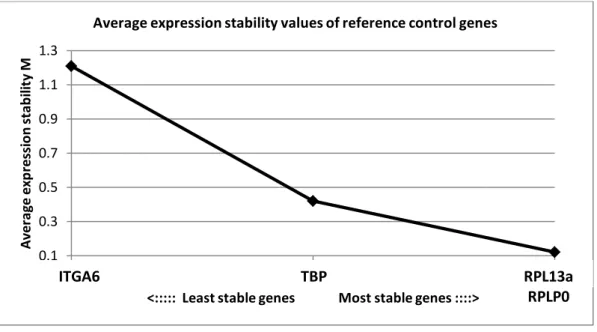
Figure S2 : Expression stability of reference genes (TBP-RPLP0-RPL13a) and basal layer reference gene (ITGA6). The geNorm analysis was performed in RHE at 1, 3, 5, 7, 9 or 11 days of reconstruction. Genes with the lowest M value have the most stable expression.
0.1 0.3 0.5 0.7 0.9 1.1 1.3 0 1 2 A ve ra ge ex p res si o n s ta b ili ty M
<::::: Least stable genes Most stable genes ::::> Average expression stability values of reference control genes
ITGA6 TBP RPL13a
Duration of R e la ti v e m R N A e x p re s s io n a Duration of culture Duration of R e la ti v e m R N A e x p re s s io n Duration of culture R e la ti v e m R N A e x p re s s io n Duration of culture R e la ti v e m R N A e x p re s s io n Duration of culture Duration of culture c e g f d b R e la ti v e m R N A e x p re s s io n R e la ti v e m R N A e x p re s s io n R e la ti v e m R N A e x p re s s io n h R e la ti v e m R N A e x p re s s io n Duration of culture 1.00E-02 1.00E-01 1.00E+00 1.00E+01 1d 3d 5d 7d 9d 11d ITGA6/RPL13 ITGA6/RGs 1.00E-01 1.00E+00 1.00E+01 1d 3d 5d 7d 9d 11d KRT14/RPL13 KRT14/RGs 1.00E-01 1.00E+00 1.00E+01 1.00E+02 1d 3d 5d 7d 9d 11d KRT10/RPL13a KRT10/RGs 1.00E-01 1.00E+00 1.00E+01 1.00E+02 1.00E+03 1.00E+04 1d 3d 5d 7d 9d 11d Lor/RPL13a Lor/RGs 1.00E-01 1.00E+00 1.00E+01 1d 3d 5d 7d 9d 11d FLG/RPL13a FLG/RGs 1.00E-02 1.00E-01 1.00E+00 1.00E+01 1d 3d 5d 7d 9d 11d IVL/RPL13a IVL/RGs 1.00E-02 1.00E-01 1.00E+00 1.00E+01 1d 3d 5d 7d 9d 11d TGM/RPL13a TGM/RGs 0.10 1.00 10.00 1d 3d 5d 7d 9d 11d TMEM45/RPL13a TMEM45/RGs
Figure S3: mRNA expression of differentiation markers normalized to RPL13a or mean of TBP and RPLP0 during the reconstruction of human epidermis. Total RNA was extracted from reconstructed human epidermis (RHE) after 1, 3, 5, 7, 9 or 11 days of growth.Reverse transcription was then performed and cDNA analyzed by real-time PCR. The expression levels of alpha 6 integrin subunit (ITGA6; a), keratin 14 (KRT14; b), keratin10 (KRT10; c), loricrin (Lor; d), filaggrin (FLG; e), involucrin (IVL; f), transglutaminase (TGM; g) and TMEM45A (h) were normalized to expression of RPL13a or mean of RPLP0 and TBP (RGs; red). The mRNA level at day 1 was taken as reference and arbitrarily set at 1. The y-axis is a logarithmic scale and error bars represent 95% confidence intervals (n=3).
Supplementary method
Total RNA isolation and relative-quantitative Real Time PCR
RNA was extracted using using RNeasy kit (Qiagen, Hilden, Germany ) and concentration measured with NanoDrop 1000 (Thermo Scientific, Rockford, USA). Super Script II RNase H-reverse transcriptase (Invitrogen, Merelbeke, BE) was used for first strand cDNA synthesis. cDNA was amplified with the 7300 real-time PCR system (Applied Biosystems, Lennik, BE) after mixing with FastStart Universal SYBR Green Master (Roche, Basel, Switzerland). Primers (Eurogentec) were used at 300 nM. They are listed in Supplementary Table. Data were analyzed using the DDCT quantitative method (Livak and Schmittgen, 2001).
Table
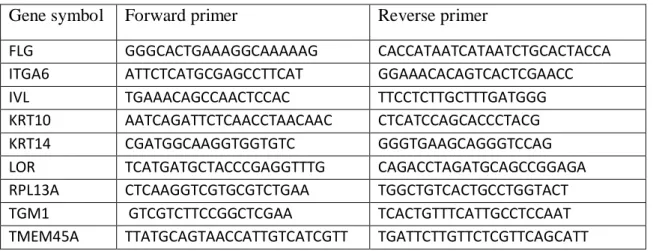
Table 1. Sequences of primers
Gene symbol Forward primer Reverse primer
FLG GGGCACTGAAAGGCAAAAAG CACCATAATCATAATCTGCACTACCA ITGA6 ATTCTCATGCGAGCCTTCAT GGAAACACAGTCACTCGAACC IVL TGAAACAGCCAACTCCAC TTCCTCTTGCTTTGATGGG KRT10 AATCAGATTCTCAACCTAACAAC CTCATCCAGCACCCTACG KRT14 CGATGGCAAGGTGGTGTC GGGTGAAGCAGGGTCCAG LOR TCATGATGCTACCCGAGGTTTG CAGACCTAGATGCAGCCGGAGA RPL13A CTCAAGGTCGTGCGTCTGAA TGGCTGTCACTGCCTGGTACT TGM1 GTCGTCTTCCGGCTCGAA TCACTGTTTCATTGCCTCCAAT TMEM45A TTATGCAGTAACCATTGTCATCGTT TGATTCTTGTTCTCGTTCAGCATT