HAL Id: tel-01171642
https://hal.inria.fr/tel-01171642
Submitted on 6 Jul 2015HAL is a multi-disciplinary open access
archive for the deposit and dissemination of sci-entific research documents, whether they are pub-lished or not. The documents may come from teaching and research institutions in France or abroad, or from public or private research centers.
L’archive ouverte pluridisciplinaire HAL, est destinée au dépôt et à la diffusion de documents scientifiques de niveau recherche, publiés ou non, émanant des établissements d’enseignement et de recherche français ou étrangers, des laboratoires publics ou privés.
Distributed under a Creative Commons Attribution - NonCommercial - NoDerivatives| 4.0
TOWARDS GENERIC SYSTEM OBSERVATION
MANAGEMENT
Vania Marangozova-Martin
To cite this version:
Vania Marangozova-Martin. TOWARDS GENERIC SYSTEM OBSERVATION MANAGEMENT. Operating Systems [cs.OS]. Université Grenoble-Alpes, 2015. �tel-01171642�
T
HÈSE D’H
ABILITATION ÀD
IRIGER LESR
ECHERCHESen vue de l’obtention du diplôme d’HABILITATION ÀDIRIGER DESRECHERCHES
de l’UNIVERSITÉ DEGRENOBLE-ALPES, Spécialité INFORMATIQUE présentée par
V
ANIAM
ARANGOZOVA-M
ARTINLe 12 Juin 2015
T
OWARDSG
ENERICS
YSTEMO
BSERVATIONM
ANAGEMENTJury
President Prof. Noël De Palma Reviewers Prof. Christine Morin
Prof. Pierre Sens Prof. Felix Wolf Examiners Prof. Yves Denneulin
There’s always a story. It’s all stories, really. The sun coming up every day is a story. Everything’s got a story in it. Change the story, change the world. — Terry Pratchett
Acknowledgements
It is an honor for me to present my habilitation thesis before the excellent scientists that have agreed to participate in my jury: Prof. Dr. Christine Morin, Prof. Dr. Pierre Sens, Prof. Dr. Felix Wolf, Prof. Dr Yves Denneulin and Prof. Dr. Noël De Palma. Thank you for your consideration and appreciation.
This habilitation is a result of numerous collaborations, exchanges and joint studies with colleagues and students. My gratitude goes to Prof. Jean-François Méhaut with whom I have worked during several years, who was the initiator of the embedded adventure and helped me mature through it. I also thank Miguel Santana, CPD Software Development Tools Manager at ST Microelectronics, the fruitful collaboration with whom was a major driver for this work. In more general terms, I thank my colleagues from the MESCAL and MOAIS teams for the rich environment in which I have evolved since my beginnings as associate professor. Passionate scientists, exuberant characters, ingenious thinkers or human treasures: they are numerous to have helped me with their example, ideas and encouraging smiles. Thanks to Brigitte Plateau, Jean-Louis Roch, Jean-Marc Vincent, Vincent Danjean, Florence Perronnin, Denis Trystram, Guillaume Huard, Gregory Mounié, Arnaud Legrand, Brice Videau and all the others.
A big thank you to all the "youngsters" I have supervised, who have helped me understand and have grown their way in the process. A special thought for the PhD students and the engineers whose work is reflected in this thesis: Carlos Hernan Prada Rojas, now Doctor and working at ST, Augustin Degomme, Kiril Georgiev, now Doctor and working in Denmark, Generoso Pagano, principal developer of the Framesoc benchmark, Alexis Martin who will undoubtedly have his startup one day... But also thanks to the masters: Thibault Jurado Leduc, Pedro Penna, Margaux Clerc, Johan Cronsioe, Mickaël Vanneufville, Dimitar Slavchev...
The Springboard community and my female colleagues were there to push me through the times of doubt. A special thank you to Françoise Le Mouël, Catherine Berrut, Gaëlle Calvary and Sara Bouchenak.
For the fun and the welcome in the change, I thank Noël De Palma, Vivien Quéma, Renaud Lachaize, Didier Donsez and Nicola Palix from the ERODS team.
On the personal side, my deep gratitude goes to my family whose love and belief in me have always been an invaluable support.
Abstract
One of the biggest challenges in computer science is to produce correct computer systems. One way of ensuring system correction is to use formal techniques to validate the system during its design. This approach is compulsory for critical systems but difficult and expensive for most computer systems. The alternative consists in observing and analyzing systems’ be-havior during execution. In this thesis, I present my research on system observation. I describe my contributions on generic observation mechanisms, on the use of observations for debug-ging nondeterministic systems and on the definition of an open, flexible and reproducible management of observations.
Résumé
Un des plus grands défis de l’informatique est de produire des systèmes corrects. Une manière d’assurer la correction des systèmes est d’utiliser des méthodes formelles de modélisation et de validation. Obligatoire dans le domaine des systèmes critiques, cette approche est difficile et coûteuse à mettre en place dans la plupart des systèmes informatiques. L’alternative est de vérifier le comportement des systèmes déjà développés en observant et analysant leur com-portement à l’exécution. Ce mémoire présente mes contributions autour de l’observation des systèmes. Il discute de la définition de mécanismes génériques d’observation, de l’exploitation des observations pour le débogage de systèmes non déterministes et de la gestion ouverte, flexible et reproductible d’observations .
Резюме
Едно от най-големите предизвикателства на информатиката е да създава правилно работещи компютърни системи. За да се гарантира коректността на една система, по време на дизайн могат де се прилагат формални методи за моделиране и валида-ция. Този подход е за съжаление труден и скъп за приложение при мнозинството компютърни системи. Алтернативният подход е да се наблюдава и анализира поведе-нието на системата по време на изпълнение след нейното създаване. В този доклад представям научната си работа по въпроса за наблюдение на копютърните системи. Предлагам един общ поглед на три основни страни на проблема: как трябва да се наблюдават компютърните системи, как се използват наблюденията при недетер-министични системи и как се работи по отворен, гъвкав и възпроизводим начин с наблюдения.Contents
Acknowledgements v
Abstract (English/French/Bulgarian) vii
1 Introduction 1
1.1 Computer Systems and Embedded Systems . . . 1
1.2 On the Importance of System Observation . . . 5
1.3 Observation Challenges in Embedded Systems . . . 10
1.4 Research Contributions . . . 12
2 Generic Observation with EMBera 15 2.1 Component-Oriented Systems and Observation . . . 15
2.2 EMBera : Component-based Generic Observation . . . 17
2.3 Conclusions and Research Perspectives . . . 21
3 Nondeterministic Error Debugging with ReDSoC 23 3.1 Deterministic Record-Replay (DRR) . . . 23
3.2 ReDSoC: A DRR-Debugger for MPSoC . . . 25
3.3 Conclusions and Research Perspectives . . . 28
4 Trace Management with Framesoc 31 4.1 Trace Management Challenges . . . 31
4.2 Framesoc: An Open Trace Management Infrastructure . . . 32
4.3 Conclusions and Research Perspectives . . . 39
5 Conclusion and Perspectives 41
References 43
1
Introduction
1.1 Computer Systems and Embedded Systems
A computer system is composed of hardware and software working together to provide a specified functionality. The hardware includes processing units (general purpose processors, accelerators), storage elements (memory, disks) and communication components (network, peripherals). The software defines the way hardware resources are to be exploited to ensure the system functionality.
Software Hardware
Figure 1.1 – A Computer System
The hardware and software architecture of a system differ according to its required func-tionality i.e. to its application domain. A desktop system, for example, mostly targets single users running interactive applications. A standard hardware configuration would include a processor, main memory, a storage disk and various peripherals. The software will typically be composed of an operating system (OS) and a number of user applications. The OS provides hardware abstractions, manages hardware resource sharing and guarantees the execution of the applications in isolation.
Distributed systems allow users to benefit from applications running on distant machines. At
the hardware level, a distributed system unites the resources of multiple machines intercon-nected through a network. The software of a distributed system typically includes a distributed
middleware whose role is to hide the distribution complexity from applications. The
middle-ware tackles the issues of failures and network latencies, provides an abstract vision of the network (e.g with a network overlay) and includes common services such as naming, commu-nication, group management, security, fault tolerance, etc. Distributed applications go from
OS
Text
Editor Game Navigator Web Software … Hardware CPU Memory Peripheral Peripheral Peripheral
Figure 1.2 – A Desktop System
classic client-server, through peer-to-peer architectures to large-scale hybrid organizations brought to existence by the development of cloud computing.
Distributed Middleware Software Distributed Application Hardware Machine Machine Machine
Machine Machine Machine
Network connection Naming Security Transactions
Network Overlay
Replication …
Figure 1.3 – A Distributed System
High performance computing (HPC) systems address data-intensive and computationally
intensive applications such as scientific simulations. These applications need to execute many computations on large sets of data while optimizing the global execution time or the computation throughput. The hardware, as a consequence, is designed for parallel computa-tions and typically includes hundreds, even thousands, processing cores. The architecture is hierarchical, with shared memory multi-core nodes interconnected by a fast network. These interconnections form clusters which can further be connected in a grid. At the software level, we usually find a resource management system monitoring resource availability and providing
for resource allocation. On top of it, there is a runtime environment providing a specific programming model (e.g MPI, OpenMP, Charm++,...) for the high-end parallel applications.
Resource Management
Software!
Parallel Application
Hardware!
Runtime Environment for Parallel Programming
Cluster! Multi-core Nodes!
Cluster!
Cluster! Network connection!
Group Communication Migration Checkpointing Data Partitioning
Dynamic adaptation to available resources Scheduling
Figure 1.4 – A High-Performance Computing (HPC) System
What about embedded systems? Initially, embedded systems were built as simple computer systems with specific hardware and software designed to control a specific task [62,13,61]. Such systems are used in consumer electronics, telecommunications, medical systems, trans-portation, military applications, etc. They operate in constrained environments imposing real time requirements, size constraints, limited data storage, energy efficiency, etc. Their design follows a top-down approach which consists in specifying their functional requirements first and providing the supporting hardware accordingly. Existing systems are closely integrated black boxes specific to the vendor.
Today, embedded systems have entered multiple spheres of everyday life and undergo a tremendous technological evolution. Indeed, the classic design approach cannot meet any-more the requirements for shorter time-to-market, lower production cost and smarter devices. The design process has evolved to consider separately the hardware and the software which both grow in complexity.
At the hardware level, the trend is to develop more general-purpose architectures that could serve multiple purposes. The term SoC (System-on-Chip) reflects the fact that today, a sin-gle chip integrates the hardware components and the performance characteristics of a full computer. As in standard computer architectures, SoC systems have memory, processors and I/O devices. Contrary to standard computer architectures, there is no standard SoC architecture but an exceptional variety of hardware designs. Moreover, a typical SoC includes
not only general-purpose processors but also accelerators (Digital Signal Processors, DSP) for fast specialized treatments. SoC systems have also increased the number of integrated computing cores and have evolved towards Multiple-Processor Systems-on-Chip (MPSoC) and Multiple-Core/Many-Core Systems-on-Chip (MCSoC). The increased number of hardware components has brought the use of Networks-on-Chip (NoC). With architectures such as the STHORM design [19] or the Kalray’s MPPA [73], SoC become integrated parallel systems with both HPC and distributed issues to tackle.
At the software level, embedded systems slowly evolve towards a layered approach including operating systems, middleware and applications. Currently, however, most of the embedded software provided by vendors concerns operating systems. Even if they implement similar concepts (interruption management, memory management, multitasking...), there is a rich variety of systems having their own interfaces [42]. Embedded middleware is in its beginnings and emerges mostly in specific areas, such as multimedia, whose common services start to be well-known. The generalized use of middleware is hindered by the fact that introducing additional software layers between the hardware and applications slows down the execution which is critical en embedded systems.
Micro-controller-specific control program
Hardware : Integrated Chip! CPU Memory I/O
Bus!
Figure 1.5 – A Microcontroller System
ST40 ST231 Audio ST231 Audio ST231 Video ST231 Video Memory! ST40 ST231 Video ST231 Video ST231 Audio ST231 Audio I/O STi7200 Board! STLinux RTOS RTOS
STMicroelelctronics Multimedia Middleware Video Decoder
General- purpose
CPU! Accelerators!
Figure 1.6 – A Multimedia System
Sensor! Sensor! Sensor! Sensor! Sensor! Sensor! Sensor! Wireless Network Connection! IoT Middleware
Smart Environment Application
Figure 1.7 – An IoT System
Kalray’s MPPA Architecture : HPC Platform On Chip!
One major change in the embedded system domain is the fact that embedded systems have evolved from closed, black-box, ready-to-use devices to open experimental platforms. Users can write and deploy their own applications [7,6,60] and even build their own hardware platforms [8]. The new technological possibilities, user imagination and the development of the Internet-of-Things (IoT) brings a new exciting era for embedded systems.
To conclude, the major aspects characterizing today embedded systems are:
• Size and Performance Constraints. Even if embedded systems undergo important tech-nological evolutions, they remain constrained systems. They are constantly diminishing in size and have limited autonomy, as well as computational and storage capacity. • Heterogeneity. There is an explosion in the variety of embedded hardware designs [61],
embedded software and embedded uses. Vendors provide multiple types of embedded processors, as well as interconnection boards. Embedded software covers proprietary solutions, real-time operating systems, releases of open-source operating systems like Ubuntu or Android, higher-level (middleware) services, etc.
• Ubiquity. Embedded systems are everywhere. Embedded systems include critical sys-tems as controllers in nuclear stations or airspace shuttles. Embedded syssys-tems bring TV to people homes with set-top boxes. Embedded systems are an integral part of all kinds of transports. Embedded systems include smartphones and tablets. Embedded systems include cameras, sensors and all kinds of connected "gadgets" for smart environments. • Lack of standards. The embedded system domain experiments today with the creation of various devices and corresponding software. The competition for providing the most optimized or original device results in the lack of standards in terms of both hardware and software architectures [153,101].
1.2 On the Importance of System Observation
System observation consists in gathering information about a system’s execution. It reflects what happens both at the hardware and the software levels. The gathered information may concern interruptions, hardware counters’ values, CPU load over time, function calls, memory management, etc.
System observation is used in the process of validating correct system functionality in cases where formal validation methods are too complex or too costly to apply. Indeed, formal methods [17,3] are widely used in critical systems, such as nuclear stations or space shuttles, where failures have dramatic consequences. Such systems follow a model-driven design in which the system behavior is modeled and proven correct before the actual development of the system [17,3]. In most cases, however, the scale, the complexity or the variability of a system cannot be properly represented with a formal model. This is why, the behavior of distributed, HPC and emerging embedded systems is mostly explored using system observation.
System observation is structured in two main phases: 1) information collection and 2) in-formation exploitation. The first phase is responsible of accessing and retrieving relevant information about the system. It happens during the execution of the system but may require an initial phase that prepares the system to be observed (instrumentation) (cf. Figure 1.9). The second phase consists in analyzing the captured information in order to understand and/or enhance the system. It may be done during the execution of the system (online) or after (off-line). The design and implementation of the two observation phases depend on what goals are pursued through system observation. In most works, the accent is put on the first phase i.e on the collection of execution-related information. How the information is to be used during the second phase is usually left up to the developer’s experience.
In the following, we start by identifying the major goals that are pursued through system obser-vation before discussing in turn the major issues in information collection and exploitation.
BEFORE&
EXECUTION& EXECUTION& EXECUTION&AFTER& Instrumenta6on& Observa6on&:&collec6ng&informa6on&
Observa6on&:&analyzing&collected&informa6on&
Figure 1.9 – Observation
1.2.1 Observation Goals
System observation has three major goals: • Check upon system correction
In this context, the system is observed in order to decide whether its execution is com-pliant with some well-defined use cases. This may be done in two forms: testing [74] or
monitoring [43]. Testing compares execution results to the ones defined in specifica-tions. The collection of information, as well as their exploitation is done at the end of an execution. Monitoring, on the other hand, considers long-running systems and collects information throughout the whole execution. The exploitation of these information is usually done online and consists in verifying that there is not an offending operation. • Find the cause for an incorrect execution
When an incorrect behavior is detected, debugging is used to execute the system step by step to identify the error’s source. The collection of information is done during execution, at specific execution points (e.g. breakpoints). The information typically reflects the call stack, the state of the memory, etc. The analysis is done by the developer who guides the debugging process.
• Characterize the execution
In multiple contexts, the information collected during system execution is basically used to provide an insight about the system’s behavior and performances. Profiling [126,
53,36], for example, provides statistical measures about the system execution. Typically, it counts the occurrences of a given event (function calls, context switches), quantifies resource usage (CPU load, disk activity, etc) and reflects the system activity in different parts of the code. Logging [18] captures the execution status of a set of predefined system operations and provides a historical record of error messages. Finally, tracing, targets fine-grained execution events and provides a detailed execution record. All three types of observation are done during the execution of the system. The collected information is usually exploited a posteriori to check the system correction or to debug an incorrect execution.
1.2.2 Collecting Observations
When collecting information about a system’s execution, the major design issues are the following.
• Coverage (What should be observed?
In most cases, the system complexity makes impossible the observation of all aspects of a system’s execution. As a consequence, it is necessary to decide what is to be ob-served. The choice is difficult as there are various entities and operations. For example, observation may focus on hardware (CPU, network links, sensors...), on the system layer (system calls, context switches, memory accesses,...), on middleware (replication operations, communication operations,...) or on the application (function calls, object instanciation,...). It may follow dynamic entities (tasks, processes...) or the static soft-ware structure (modules, packages,...). Finally, observation may need to consider all the occurrences of a given phenomenon or only the occurrences in a given context. In most cases, as it is impossible to predict what could cause an execution problem, the general trend is to observe as much as possible and make out what happened later.
• Cost (What is the overhead?)
Observation perturbs the behavior of a system. This perturbation represents the ob-servation cost and is called intrusion. It may affect the system in different ways: slow it down, modify the execution path or change the final result. It does not imperatively lead to an error. For example, in operating systems, an intrusion of maximum 5% is considered acceptable.
The intrusion is proportional to the quantity of information collected during system observation. Indeed, the more fine-grained the observation, the greater the number of execution events to be intercepted and recorded. The level of detail of an observation (its precision) is thus directly related to its cost.
• Result (What data should be collected?)
his-tory or, on the contrary, a synthetic representation. In the first case, observation reveals system events and produces a chronological trace of its execution. This information is useful for a detailed analysis of the system execution. The second case concerns the production of profiles which give a macroscopic vision of the system execution. This information is usually used to characterize the performances of the system.
An important aspect of system observation is the transport and the storage of the result. Not only it puts additional requirements in terms of system resources but the corresponding operations increase the slow down of the system.
• Quality (Did this really happen?)
As observations are used to reason about system behavior, a major question is to what extent they reflect the execution[50]. Indeed, gathered data may vary in precision and recording the exact ordering of system operations, especially in a large-scale system, is a challenge.
• Configurability (How to collect what the developer really needs?)
A tool for observation is configurable if it gives its user the ability to specify what is to be observed and what data is to be collected. Such features help minimizing the observation overhead and simplify the further analysis of the data. However, most observation solutions provide a predefined set of observables. If the user needs a different type of information, it is usually required to use a different tool.
1.2.3 Exploiting Observations
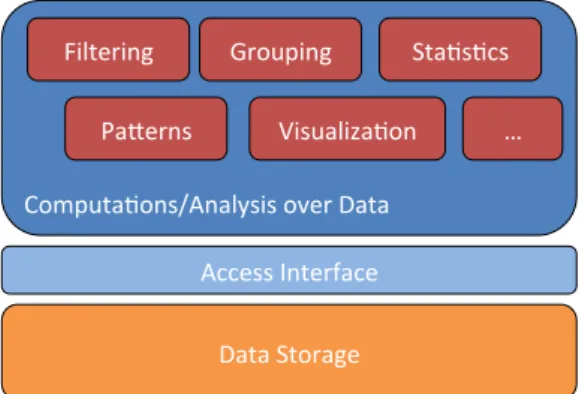
Observation exploitation includes all processing treatments applied to collected observational data. From the architectural point of view, it relies on a storage support, an access interface and a set of computational treatments (cf. Figure 1.10). The storage contains the collected data. It may be based on persistent storage or volatile memory, benefit from SQL-like systems or be a collection of files. It may also be encoded or encrypted for space-optimization or security reasons. The way data is represented in the storage is usually specific to the tool responsible for the data collection. For this reason, it is made accessible through an explicit interface. Typically, the interface will provide operations for going through and consulting attributes of the observation records. Finally, the computational treatments are the ones analyzing the observational data and producing different or more synthetic system representations. If there are various data collection techniques, data formats and data access interfaces [171], from the functional point of view, observation exploitation is still in its initial phase. Indeed, the extraction of synthetic human-understandable representation of a system execution is a major research topic. However, the following operations are common to multiple tools coming from different application domains and may be identified as an initial functional kernel for data exploitation.
• Read/Write Access
Access%Interface% Data%Storage% Computa4ons/Analysis%over%Data%
Filtering% Grouping% Sta4s4cs%
Pa=erns% Visualiza4on% …%
Figure 1.10 – Exploiting Observational Data
data structure, these operations may be more or less optimized, including aspects of encoding and parallelization.
• Filtrering/Selection
Most observations contain different types of data for different types of analysis. As a consequence, it is typical to first filter the useful data before applying some treatment. The filtering criteria may typically concern the time window or the type of considered events. In some domains, such operations are used to purify the data i.e to dismiss wrong or unrepresentative data.
• State Computation
Many observations reflect punctual events i.e phenomena happening at a given moment of time. State computation consists in revealing system states which are defined in relation with the system semantics. Examples of states are function durations and message communications.
• Statistics
Statistics provide a synthetic view of the system execution. They usually emphasize the importance of a certain characteristic (e.g number of function calls, CPU load) during a given execution period.
• Aggregation
Aggregation consists in applying a function on a set of data to obtain a synthetic result. It allows for diminution of data volume and is used to simplify the analysis. However, aggregation hides execution details and leads to information loss. Visualization aggrega-tion, for example, may be nondeterministic, hide execution problems and lead to false conclusions [121,122,82].
• Grouping
Groups, with possible hierarchical organization, are used to represent collected data following the application logic, the software architecture or the used hardware resources. In HPC, for example, it is typical to group observational data per process [78]. In embedded systems, it is typical to consider the execution events per processor [129].
• Pattern Detection
Closely related to the semantics of a system, pattern detection targets the identifica-tion of abnormal situaidentifica-tions indicating an execuidentifica-tion problem. In HPC applicaidentifica-tions, for example, it is used to search for long-duration communications or blocking synchro-nizations [112,120].
• Visualization
Visualization aims at representing the results from observing and analyzing the sys-tem [143,120,107,129]. It stays one of the major techniques for manipulating and understanding voluminous and complex data (big data) [45].
1.3 Observation Challenges in Embedded Systems
The growing complexity of embedded systems prevents the generalized application of formal methods to guarantee correct functionality and optimal performances at the design phase. The complexity of embedded systems architecture, as well as the distribution of the embedded systems design among different departments of the vendor companies and even among vendors and clients, make "the global picture" quite challenging to obtain and understand. In this context, execution observation becomes a major tool for enhancing system behavior. The definition of the JTAG standard [70] for testing, tracing and debugging is directly related to this phenomenon.
The observation process is faced with multiple challenges both during the collection and the exploitation phases.
Need for Genericity During the collection phase, the ultimate goal is to find the optimal
trade-off between the observation intrusion and the quantity of useful data reflecting the system exploitation.To minimize intrusion, most existing tools propose platform-specific observation solutions [135,147,86][171]. These may reflect the underlying hardware or focus on the specific entities of a given software. Not only the implementation of such a solution demands a great technical expertise, but it is also confined to its initial application context and cannot be reused. This is particularly true in the domain of embedded systems where observation requires additional resources and directly affects the execution performances. Existing solutions for embedded systems minimize the execution overhead in an ad-hoc and even vendor-specific manner.
The specificity and non reusability of tools is also reflected in their data exploitation facilities. Indeed, most existing tools come with some functionalities for accessing and manipulating observation-related data, the most sophisticated treatment being data visualization. Con-sidering different tools for the same domain or tools from different domains, one can notice that there is a common functional kernel concerning data organization, statistics treatments, machine learning methods, etc. However, even if the principles and the algorithms are close, their implementations remain context/platform-specific. The computational treatments over observational data should be separated from the domain specificity and define generic bricks
for data analysis. Such bricks would allow for reuse, optimization and refinement. Most of all, they would provide a starting point for data analysis and facilitate the definition of more complex and rich computations.
Need for High-Level Information As performances are a key issue in embedded systems, most observation solutions focus on low-level information concerning the hardware and the operating system. The collected data does reflect the resource usage of the system but presents two major flaws. First of all, low-level execution events have a high frequency and the resulting data has an important volume which is difficult to transport, store and manipulate. Second, it is quite challenging to establish the relation between low-level events and application-level phenomena. In most cases the gap is filled by the developer who may use ad-hoc tools to observe the application and rely on his/her experience to correlate low-level and application-level events. Such work is hindered by the important number of observation tools, their heterogeneity and the fact that they are meant to be used independently.
Extracting a macroscopic vision from microscopic execution events is a major issue in data analysis and thus is part of the data exploitation phase. The "big data" challenge consists in finding the right question to ask in order to obtain useful information. There is much research on the different methods to extract information from big data [5]. In the domain of embed-ded systems, however, the diversity of applications and therefore the lack of pivot domain semantics makes difficult the application of higher-level analysis methods. Investigations have started [14,76] but remain limited and context-specific.
Need for Scalability With the miniaturization of embedded systems and the increasing
number of hardware and software components, scalability is of prime importance. From the observation point of view, proposed solutions should not only be able to handle important data volumes but also target a subset of the system in order to zoom into interesting execution phenomena. Scalability support is to be thought of at all levels, starting from hardware support for observation, through the cost of software instrumentation, the infrastructure for data collection and up to the algorithms and frameworks to handle observation data.
The increasing scale of systems presents another challenge to observation which is nondeter-minism. Indeed, as the execution may take different paths, the results of observation are also nondeterministic. How can we decide to what extent these observations reflect the behavior of the system? Does an observation reflect a normal behavior, a frequent behavior or an abnormal one? How can we investigate what happened during the execution if we are not sure to reproduce the execution path? In a large-scale system where, due to intrusion reasons, developers observe different parts of the system during consecutive runs, how could they be sure that the corresponding observations are consistent and do not reflect different execution cases? A tempting solution may be to prevent nondeterminism via adapted hardware, run-time or programming mechanisms [38,20,21,24]. This solution does guarantee execution reproduction but is costly in terms of hardware or development efforts and cannot be applied in the general case.
1.4 Research Contributions
My work has contributed on the generic mechanisms for tracing of embedded systems, the exploitation of traces for debugging nondeterministic embedded systems and the definition of an open framework for trace exploitation. I have namely worked on:
EMBera: A Generic Framework for Embedded System Observation
The motivation behind this work lies in the existence of numerous observation tools for embedded systems which are technology-driven, platform-specific and non reusable. Usually they provide fine-grain low-level representation of the system execution and do not address the issues of multilevel tracing and of tracing configuration. In other terms, what is observed, what data is captured and what is done with the data is predefined in existing tools.
The work developed in the PhD thesis of Carlos Herman Prada Rojas proposes a generic framework for observation of embedded systems. Using a component-oriented approach, EMBera addresses the aspects of observation genericity, of partial observation, of multi-level observation and of configuration. The major contributions of this work consist in 1) identifying the major phases in a typical observation activity, 2) the proposal of generic basic building blocks for observing an embedded system and 3) the instantiation of the proposal on real embedded boards with use cases provided by STMicroelectronics.
After his PhD, Carlos Rojas Prada obtained a permanent position at the IDTEC team at STMi-croelectronics. He continues his work on observation tools and has been a principal instigator of the Multi-Target Trace API (MTTA).
The publications of this work are [190,189,188,186,187]. EMBera is presented in the first chapter of this report.
RedSoC: Debugging Nondeterministic Errors in Embedded Systems
The increasing complexity of embedded architectures has a strong impact on their debugging. A major problem, intensified by the increasing number of computing cores and the level of system parallelization, are nondeterministic errors. Classic debugging techniques do not apply in this context as, on one hand, they are not scalable enough and, on the other hand, they cannot guarantee the reproduction of the errors.
The work developed during the PhD thesis of Kiril Georgiev proposes a record-replay solution allowing for post mortem debugging using execution traces. RedSoC defines a debugging cycle allowing for zooming on errors by applying temporal and spatial selection criteria. The idea behind spatial and temporal selection is to consider not the entire execution of the whole application but deterministically replay a part of the application during a specific execution interval. The proposed mechanisms are connected to GDB and allow for a useful visual representation of the trace.
After his PhD, Kiril Georgiev obtained a permanent position at the R&D department of Excitor A/S, a Danmark company developing solutions for securing the working environment of mobile users.
The publications of this work are [158,155,156,159,160,161]. ReDSoC is presented in the second chapter of this report.
Framesoc: Trace Management Infrastructure for Embedded Systems
In the domain of embedded systems, the aspect of trace capture with minimum execution overhead is well managed by existing tracing solutions. However, trace exploitation is still at its early stage and most existing tools only provide time-chart visualizations and some basic statistics. Framesoc, developed in the context of the SoC-TRACE FUI project, targets the design of an open infrastructure for next generation trace management.
Publicly available since July 2014 (soc-trace.minalogic.net), the first version of the SoC-TRACE software product provides solutions for trace storage, trace access and trace analysis. For trace storage, Framesoc tackles the problem of trace format heterogeneity and provides a generic data model. Stored data includes not only captured trace data but also the results of trace processing (analysis) treatments. As for trace analysis, Framesoc provides a management framework that has successfully integrated data mining tools (LIG/UJF), sequence statistics (ProbaYes) and visualization (INRIA and STMicroelectronics).
Since september 2014, Framesoc has been published as an open-source project (http://
soctrace-inria.github.io/framesoc/). Recent works of Generoso Pagano, engineer in SoC-TRACE, have integrated the LTTng viewer in Framesoc. This connects our work to a very large open community and enlarges the application domain of the framework. Another line of work is pursued by Alexis Martin, a PhD student, investigating the automatization of trace analysis workflows. The idea is to be able to define basic analysis blocks that could be connected to form complex analysis chains. The support for such features would allow for reusing the processing treatments in different contexts with different traces, the construction of a knowledge base of interesting trace analysis cases and the reproduction of trace analyses. The publications of this work are [179,170,171,178,180,177,181,173,172].
The work around Framesoc and the definition of a trace management infrastructure are described in the third chapter of this report.
The three chapters dedicated to EMBera, ReDSoC and Framesoc are followed by Chapter 5 presenting the research perspectives of this work.
2
Generic Observation with EMBera
The performance requirements of embedded systems, as well as the hardware/software codesign have influenced existing observation solutions in an important way. Indeed, existing observation solutions are centered either on the SoC architecture [9,92], or on the operating system software [135,86]. At the hardware level, specialized components intercept, timestamp and trace processor, memory and bus events. At the processor level, there typically are registers containing information about the number of executed instructions, the number of memory accesses, the cache misses, etc. At the operating system level, the observed events are related to interruptions, context switches and system calls.
What can be said about these observation solutions is that they are platform(vendor)-specific and non reusable. They provide low-level information which is difficult to analyze and cor-relate with higher level software functionalities (cf. Figure 2.1). They provide a predefined set of observable data and the configuration facilities are limited to activating/deactivating observation points.
2.1 Component-Oriented Systems and Observation
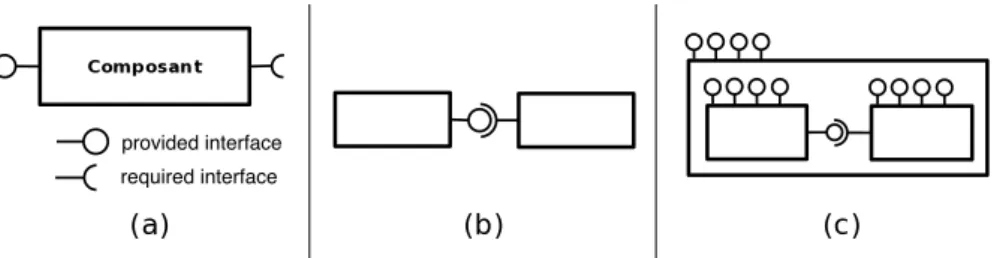
Components have been introduced to simplify the development and management of com-plex applications. They emphasize the modular approach to development, promote reuse and, most of all, address application administration. Indeed, components may be used to separate the software configuration aspects related to a specific platform from the reusable functional kernel [139,138]. Compared to the object-oriented approach, components are coarser grained, express the management aspects of applications (eg. security, fault tolerance, life cycle management) and explicit their architecture. A major advantage is the fact that components explicitly target application deployment and thus facilitate the process [163]. In our work we consider the definition of components given by Stal in [25]. A component is a reusable entity, a black box, with well-defined interfaces that characterize the services it requires from the external environment and the services it provides (cf. Figure 2.2(a)). Components are connected through their interfaces (cf. figure 2.2(b)). to create composite components and the final application (cf. figure 2.2(c)).
Figure 2.1 – STMicrolecetronics’ KPTraceViewer is part of STWorkbench and visualizes KPTrace
execution traces. This view shows the different processors (CPU0, CPU1), as well as the
relatedInetrrupts, software interrupts (SoftIRQ) and function executions (Tasks). The information displayed concerns a time window of only 10µs.
There are multiple component models [137,58,104,26,2,152,35] and their usage continues to spread, especially with the development of cloud computing. If observation facilities for component-based systems are provided, they are mostly focused on end-user applications and middleware. Observation typically targets component architecture and component interactions. The Fractal component model [26], for example, can detail the set of executing components and the existing bindings between components. It can also trace component
creations and communications. Similarly, OpenCCM [104], an open-source implementation
of the CORBA Component Model [58], uses interceptors in order to capture method invocation, and thus, monitor component creations and communications. The same approach is applied
to the implementations of the EJB model [137]. Component observation at the application
level has an important advantage which is to be independent of the underlying system software and hardware. However, it is unfortunately unrelated to low-level performance metrics which are crucial for embedded system development.
Few projects employ components for the needs of embedded systems. The PURE project [23], for example, targets deeply-embedded systems but focuses mainly on the trade-off between efficiency and software engineering and not on observation. The PIN component model provides a simple component framework targeting embedded system design [65]. It does not consider execution observation but features frameworks reasoning about system performance and prediction [15]. The ROBOCOP [115,87] ITEA project has combined the KOALA [144], COM and CORBA models to propose a suitable component-based solution for consumer
provided interface required interface
Figure 2.2 – Component interfaces, connexions and composition
electronics design. The Robocop model defines component properties related to memory consumption, timing and reliability. However, these properties are mostly used as resource requirements declared prior to the execution and managed through resource budgeting. Resource monitoring and control is mentioned but is left to future developments. As for
the Nomadik Multiprocessing Framework project [44] of STMicroelectronics which defines
the context of our work, observation concerns the application component level and stays disconnected from the resource perspective.
2.2 EMBera : Component-based Generic Observation
The EMBera project [186,187, 188,189] explores the use of components for designing a generic framework for observing embedded systems. The major contribution of EMBera is to provide an observation framework providing for partial observation, reuse, scalability and configuration.
Partial Observation As it is not realistic to observe everything that happens during the
exe-cution of an MPSoC system, the EMBera project allows for selection of the observable entities and actions in a system. To do so, EMBera encapsulates the chosen entities in observable components providing generic observation interfaces to control the data collection process. It may focus, for example, on a group of cores, on communications or on some application modules.
Genericity and Reuse EMBera abstracts the data collection framework from the underlying
platform’s complexity and heterogeneity. It defines a probe base layer which is responsible of collecting raw data from the system and relies on the implementation of specific components to encapsulate different data sources. The probe components provide unified observation interfaces upon which the data collection framework defines generic data processing compo-nents. These do not depend on the platform and thus may be reused in a different application contexts or on different MPSoC hardware.
Scalability Scalability is managed in EMBera through the possibility for partial observation, as well as using the natural capacity of components to form hierarchies. Indeed, in a large-scale system, it is possible to define coarse grain components providing observation information
about important parts of the system. When needed, these may be defined as composite components and zoom to a finer level of detail through the components they contain.
Configuration To take into account the specificity of embedded platforms and of the entities
to observe, EMBera provides source code skeletons to be completed with suitable optimized treatments.
2.2.1 Approach
The EMBera model is inspired by the Fractal component model [26]. We have chosen Fractal since it is a general component model that is system and language independent. Indeed, it can be used at the system level, as well as middleware or application level and it can be implemented in Java, C or other programming languages. Another major advantage of Fractal is that it is already used at STMicroelectronics which defines our working context [89]. An EMBera application is composed of a number of interconnected components. Components are active entities and each component has its own execution flow. This choice follows the current practice for MPSoC applications in which multiple treatments are executed on different processor units.
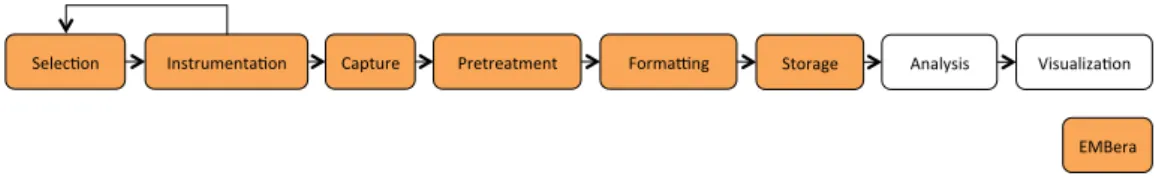
Each component is characterized by a set of provided and required interfaces. A predefined interface for component control includes operations for component creation, interconnection and life-cycle management. To explicitly address system observation, each EMBera com-ponent also provides observation interfaces. These include an introspection interface that provides information about the observable events, a control interface to enable or disable observation-related treatments and a data interface to access collected observation data. Targeting post-mortem data processing, EMBera focuses on the data collection aspects of observation (cf. Figure 2.3). The selection phase is responsible of defining the part of the system to target during observation. The instrumentation phase prepares the system to be observed. The capture phase collects execution data. The pretreatment phase typically relies on filtering and aggregation to eliminate wrong, redundant or unimportant data and decrease data volume. Formatting unifies data representation before the Storage.
!"#"$%&'( )'*+,-."'+/%&'( 0/1+-,"( 2,"+,"/+."'+( 3&,./4'5( !+&,/5"( 6'/#7*8*( 98*-/#8:/%&'(
;<=",/(
Figure 2.3 – Observation for post-mortem processing
To reflect the identified aspects of observation, EMBera defines three types of components: basic components, data treatment components and storage components.
Basic Components are the probe components that encapsulate platform-specific entities
Figure 2.4 – EMBera Components in the SVC Application [190]
encapsulate, for example, a process or a hardware register. Basic components represent the sources of observation data in the EMBera model.
Data Treatment Components are responsible for pretreating the observation data before
storage. Typically these encapsulates filter or aggregator operators and apply them to the data produced by one or more basic or data treatment components.
Storage Components address data formatting and the data storage on persistent supports.
They encapsulate the specific mechanisms for accessing the target storage.
2.2.2 Validation
The EMBera framework has been implemented in C and has been instantiated in three dif-ferent use cases, featuring difdif-ferent applications and execution platforms. It has been vali-dated with multimedia applications which represent a major part of the software running on commodity embedded systems. The applications include both component-based and not component-based software with different size and complexity. The simplest
applica-tion is a test decoder for the MJPEG format [93] which has been reengineered to become
component-based. The second application is a non component-based video decoding mid-dleware provided by STMicroelectronics. The software stack in the third use case is composed of the Linux operating system, a component-based multimedia middleware (Comete) and the SVC decoder application [123].
Figure 2.4 shows the integration of the EMBera components in the SVC application. The com-pilation process has been modified to enrich SVC components with the EMBera’s observation facilities and to monitor inter-component communications.
Figure 2.5 shows a partial representation of the multi-level EMBera observation. It features the observation of the application components, of their management at the middleware level and of their resource aconsumption at the system level.
Figure 2.5 – Partial representation of the EMBera Observation Components in the SVC use case [190]
In terms of target platforms, the first two applications have been deployed on two embedded
boards from the STi7200 family [132]. As at the time of the experience, SMP embedded
platforms were not available, in the third use case the target hardware platform is a Linux SMP with four six-core Intel Xeon processors.
In all cases, the experiences included the porting of the EMBera software for the used platform and the instrumentation of the available software. Observations are multi-level and target the system, the middleware and the applications. In addition to providing useful insight about the design of the software, EMBera observations revealed performance problems related to mem-ory management and non optimal processor usage. Moreover, they helped compare different application deployment schemes and identify the most consuming software components.
2.3 Conclusions and Research Perspectives
The EMBera framework shows that components can be successfully employed to manage data collection in a generic way. Its concepts may be applied in the context of non component-oriented software running on other than embedded systems.
EMBera has been used to provide multi-level observation in an unified way. Capturing the same data without EMBera would have implied the usage of several heterogenous tools. Using heterogenous tools is a complex issue as it requires simultaneous activation of the tools, the management of the heterogenous data formats and data correlation. In the case of EMBera, a simple time-related correlation has been sufficient and easy to put into practice. However, multi-level observation needs information about causal relations among system events whose discovery, maintenance and management are subject to research [140,4,52].
It is our conviction that observation should be configurable and, most of all, well targeted. In all EMBera use cases, the needed observation data has been clearly identified before defining and instantiating EMBera observation components. The fact to capture uniquely the needed information has greatly reduced the data volume to manage and facilitated data understanding and correlation. Our conclusion from the EMBera experience is that there should be a two-level instrumentation mechanism. There should be a base two-level ensuring access to different types of data at minimal cost and a higher configuration level taking care of the observation targets, parameters and correlation issues.
EMBera does not manage intrusion explicitly. Different experiences have produced differ-ent intrusion results and span from 7% to 1000% slow down. We consider that intrusion is acceptable as far as it does not change the behavior of the target system. However, as this is complex to verify, it is our belief that the target system should be dimensioned with observation-dedicated resources. As for the cost of EMBera components, it may be optimized by flattening their runtime structure and thus preventing indirection overhead.
Even if EMBera has focused on post mortem processing, its concepts may very well be applied to online activities. The features of selective observation and configuration may be used to find the reasonable trade-off between observation quality and overhead. Indeed, if the observed information is not sufficient or not well targeted, the observation process could be reconfigured online so as to capture more relevant data.
3
Nondeterministic Error Debugging
with ReDSoC
One major problem with interactive debugging is the difficulty to track nondeterministic errors. Indeed, there are, for example, ( Heisenbugs) i.e bugs that disappear when interactive debugging is on. In more general terms, in nondeterministic systems, factors such as the system load, the number of concurrently executing entities, the temperature or the the hard-ware components’ age cause system execution to take different execution paths, to produce different outputs and to bug in different ways. Moreover, repeated execution of the system does not guarantee the reproduction of previous behavior.
There are two approaches to tackle the problem: either nondeterminism is made impossible via adapted hardware, runtime or programming mechanisms [38,20,21,24], or debugging is done post factum. The idea is to trace an execution which exhibits a nondeterministic error and then use the trace as a support for debugging. Debugging thus targets not a live execution but an execution replay. A major advantage of this approach is backward debugging in which the information about the recorded buggy behavior is used as a starting point for the debugging analysis [77].
3.1 Deterministic Record-Replay (DRR)
A nondeterministic system is a system which may follow different execution paths when executed with the same data input [117]. The main causes are data inputs, scheduling, data races, interruptions and distributed communications.
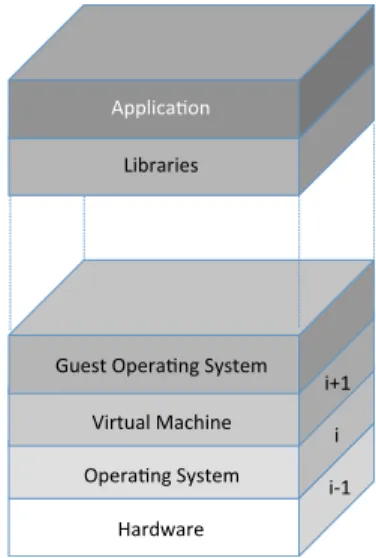
If we picture a system as a multi-layer stack (cf. Figure 3.1), nondeterminism concerns all levels but is easier to find at lower levels. Indeed, if layer i enforces a deterministic behavior and layer i + 1 is based entirely on the interfaces provided by i , then i + 1 is also deterministic. There are no guarantees about the layer i − 1. For example, the dOS system [77] enforces determinism upon process groups at the operating system level. Thus, above dOS, all sources of nondeterminism such as scheduling or conflicting shared memory accesses are elimi-nated. However, operations involving non controlled operations such as accesses to physical resources accesses or distributed communications, stay nondeterministic.
!"#$ !$ !%#$ &!'()(!*+$ ,-*()./0$12+3*4$ 5)(67)(*$ 8--9!:).;/$ <!(3=)9$>):?!/*$ @=*+3$,-*()./0$12+3*4$
Figure 3.1 – An Example of a Multi-Layered System: All layers are possibly nondeterministic
The idea of deterministic record-replay is to record a system’s execution and then determinis-tically replay the record in order to examine the system’s behavior. The record phase needs to produce an execution trace containing all the necessary elements reflecting and allowing the reproduction of the system execution. The record phase may be executed several times in order to capture some target abnormal behavior. The replay phase replays the execution under the constraints defined by the captured execution trace. The replay may re-execute the system or simulate its execution.
There are numerous DRR solutions which differ in their target application domains, implemen-tation and performance [161]. Indeed, there are DRR proposals in the domains of distributed systems, shared memory systems and embedded systems. They evolve chronologically from simpler, mono-processor systems [119,30], to more complex architectures such as modern multi-core platforms [81,145,96]. Numerous projects focus on data races [116,40,66,97,
110,95,16,114] while others have a more global approach [81,32]. At the implementation level, DRR solutions are hardware- and/or software-based [109,64] and may work on sim-ulated [66,110] or real platform [136,108,145,54] environments. DRR optimizations are various and include efficient log management, system slicing and parallel replay techniques. MPSoC systems are subject to all cited sources of nondeterminism. Indeed, the numerous peripherals are sources of hardware nondeterminism. As for the software level, data races, scheduling nondeterminism and nondeterministic network communications come as a natu-ral consequence of the increasing number of processors and the introduction of NoCs. Even though MPSoC systems are subject to all sources of nondeterminism, there are few DRR proposals [88,54,31] and they all focus on hardware interrupts and address single mono-core processor platforms. The RedSoC system pushes the effort of DRR for embedded systems further, by considering MPSoC architectures and working on a larger set of sources of nondeterminism.
3.2 ReDSoC: A DRR-Debugger for MPSoC
RedSoC proposes a general debugging methodology for MPSoC systems. It focuses on DRR for shared data accesses, network communications and I/O operations. Its approach is thus complementary to related works focusing on interruption replay.
!"#$% &'% (#)*+,-./% 0% (#1#+#.)#% 23#)45*.%6+0)#% !"#$%7'%6+0)#%8.09:;-;% !"#$%<'%!#0+)=%!$0)#%(#,4)5*.% !"#$% >'% ?#"#[email protected];5)% (#$90:% 0.,% (#)*+,-./%A0+509%6+0)#;%% !"#$% B'% ?#"#[email protected];5)% A0+509% (#$90:% 0.,%?#C4//-./% !"#$%D'%2++*+%?#"#)5*.% !"#$%E'%2++*+%F,#.5G)05*.% 8% H% I% 8% I% I=*-)#% A+*$*;#,%@#"=*,;% ?#J#9*$#+%0)5*.;% 8% I*."+-C45*.%*.%% ,#"#[email protected];5)%+#$90:%@#"=*,;% H% I*."+-C45*.%*.%% ;#0+)=%;$0)#%+#,4)5*.% I% I*."+-C45*.%*.%% $0+509%+#$90:%
Figure 3.2 – Debugging Cycle
The ReDSoC debugging cycle is shown in Figure 3.2. During Step 1, the execution of the whole MPSoC software is recorded to produce reference execution traces. During Step 2, the developer analyzes the reference traces in search of abnormal behavior. At Step 3, the developer decides whether a problem has been recorded and should be investigated, in which case the cycle continues with Step 4. Otherwise, typically if a targeted nondeterministic error has not yet been recorded, the cycle may restart with Step 1. During Step 4 the developer decides to focus on a particular part of the software execution thus reducing the error search space. To do so, he/she selects a suspected part of the application to debug during a specific time interval. Step 5 deterministically replays the reference trace to capture additional data reflecting the execution of the selected software part. Step 6 deterministically replays the selected software part with the possibility for standard debugging. At Step 7, if the error source is not identified, the developer goes back to Step 4.
The architecture of RedSoC is given on Figure 3.3. ReDSoC considers standard debugging configurations including a host platform connected to a target MPSoC platform. It is composed of four tools, namely a trace visualization tool, a partial replay tool, a trace collection tool and a deterministic replay tool.
!"#"$%&'"()*&$+,%-'*./%0)1* 234%5*&$+,%-'* 67(89*9:;* <!=* 234%5*>"-("$* 234%5*?3@* A-+B"*C708+$7D+E%(* *A%%$* 3+-E+$*F"&$+G*A%%$* A"'&%-+$** &+-EE%(7(H* <!=*I9)"(07%(* 4&+B"J(%K"*&+-EE%(7(H* A-+B"*5%$$"BE%(** A%%$* !")"-'7(70EB*F"&$+G*A%%$* 234%5*4%LM+-"*
Figure 3.3 – ReDSoC Architecture
The trace collection tool is in charge of capturing nondeterministic events and generating the corresponding execution traces. Trace capture is based on interception of the calls to a predefined MPSoC API which is POSIX-inspired and features operations for task management, synchronization, network communication and I/O.
The tool for deterministic replay enforces DRR through proven deterministic replay algorithms concerning synchronization operations [84], network communications [100,33] and I/O [118]. The partial replay tool monitors the replay phase to decide which operations are relevant to the selected (suspected) software part. To apply the time reduction criterion, we have implemented an extension for GDB to introduce replay breakpoints corresponding to the limits of the time interval that has been selected for debugging.
To visualize traces, RedSoC uses the Pajé [106] trace format and has adapted the KPTrace Viewer of STMicroelectronics [129].
In terms of performances, ReDSoC shows a very low intrusion and small trace logs in all considered cases of multimedia application debugging.
One example of successful application of ReDSoC is in a use case of a Tetris game for two players (cf. Figure 3.4a), running on a Stagecoach expansion board with two OveroFE COM nodes1. To investigate a nondeterministic crash, ReDSoC obtains a reference trace containing the error. The important number of execution events, however, does not allow the immediate identification of the problem. Being the node to fail, node 1 is chosen as a target for the partial replay. The time interval to debug is chosen to contain its last execution events (cf. Figure 3.4b). After deterministically replaying the whole application and gathering additional traces about the communications between node 1 and node 2, RedSoC uses a standard debugging session to investigate the problem (cf. Figure 3.5).
(a) Two Player Tetris. (b) Zoom on the last execution events of the failing Tetris node
Figure 3.4 – Debugging a Multimedia Application
The session clearly identifies the trace entry with its number (202459), type (IO), node identifier (Node1) and task identifier (Task0) (line 1). ThebtGDB shows the interaction between the GDB server and our GDB extension. Up the call stack, we see the replay function for IO operations (replayIOsize) and the MPSoC function calls.
The debugging session shows that the crash is due to an incorrect value sent by the other Tetris node which in turn is suspected and debugged. Examining its execution detects non regular behavior and a buffer overflow problem.
✁ ✂✄ ✄☎✆✝✁✞☎ ✄✟✝✠✡ ✞☎✝ ☛✄✂☞✌✁✍ ✎✝✁✏✆ ✑ ✒✓✔ ✒✕✖✗✘✠ ✄☎✑✏ ✙ ✚✘ ✝ ✛ ☛✑ ✔✚✜✂✆ ☎✑ ✎ ✢✝✛✁✁ ✞✝✣☎☞✌✤✂✥✏✙ ✍ ✒✓ ✔✒✕✖✗ ✚✘✝ ✛ ☛✑ ✔ ✦ ✧☞✁✣★☞✌✩✁ ✂✘★✞☎✝✆✔✪ ✫ ✤✎ ✔✒✝ ✒✡✆✫✔ ✔✬✢✭ ✮✯✔✒✯✗✰✱ ✬✩✆✡✰ ✡✁ ✍ ✔ ✞✆ ✡✲✌ ✂✁☞✤✠ ✲☎✳☎✌✁✬✰✝✁✞☎✄✟✝✠ ✲✆ ✡✓✣ ✥✎ ✎ ✍ ✎ ✔✪✔✔✔✔✫✤✎ ✔✒✣✝✡✫✴✆ ✔☞✌✞✆ ✡✲✌ ✂✁☞✤✠ ✲✛✠ ✛✣✝✟✟✬☞✆✑ ✒✓ ✔✒✕ ✖✗✚✁ ✠ ✄☎✑✏ ✙ ✚✁☞✆ ✑ ✔✚✌ ✂✆ ☎✑ ✎✰ ✝✁✞☎✄✟✝✠ ✲✆✡✓✣ ✥✒✕ ✍ ✒ ✔✪✔✔✔ ✔✔✔ ✔✔✔ ✔✕ ✎✒ ✵ ✎✒☞✌✞☎✄✟✝✠✏ ✙ ✛☞✶☎✬✰ ✝✁✷ ✞☎ ✄✟✝✠ ✲✸☎✣★✝✌☞ ✛ ✸✷ ✛ ✞✣✷✞☎ ✄✟✝✠ ✓✣ ✥✎✕✴ ✍✯ ✔✪✔✔ ✔✔✔ ✔✔✔ ✔✔✕ ✎☎✴✣✕☞✌✩☎✁ ✁ ✸✬✝✑ ✔✰ ✝✁✷✩✝ ✸☎✷ ✛ ✞✣✷ ✁☞ ✸☎ ✞✓✣ ✥✵ ✵ ✍✕ ✔✪✔✔✔ ✔✔✔ ✔✔✔ ✔✕ ✎✖✫✔ ✔ ☞✌✄✟✝✠ ✲✞ ✂✹✌✆ ✬✰ ✝✁✩✝✸☎✷✛✞✣✷ ✒ ✄✓✣ ✥✖✔✴ ✍ ✖ ✔✪✔ ✔✔✔ ✔✔✔ ✔✔✔✕✎ ✖✣✴✡☞✌✛✁✝ ✞✁✩✝ ✸☎ ✲✒ ✄✬✰ ✝✁✷✩✝ ✸☎✷ ✛ ✞✣✷✒✄✓✣ ✥✖✫✔ ✍✴ ✔✪✔✔ ✔✔✔ ✔✔✔✔ ✔✕ ✎✗✕✕✯☞✌✛✁ ✝ ✞✁✩✝ ✸☎✬✰ ✝✁✷✩✝ ✸☎✷ ✛ ✞✣✷✩✝ ✸☎✓✣✥✎ ✎ ✖ ✍ ✎ ✎✔✪✔✔✔ ✔✫ ✤✎ ✔✒✣ ✤✫✵✵✡✝☞✌✛✁ ✝ ✞✁ ✲✁★✞☎✝✆✬✰✤✞ ✂✸✷ ✟☞✡✷ ✟☞✡✄✁★✞☎✝✆ ✓ ✛✂✓ ✔ ✍ ✎ ✒✔✪✔✔ ✔✔✫ ✤✎✔ ✒✣✵ ✒ ✖✔ ✒✆☞✌✣✟ ✂✌☎✬✰✤✞✂✸✷ ✟☞✡✷ ✟☞✡✣✓ ✛ ✂✓✴ ✍ ✎✯✔✪✔ ✔✔✔ ✔✔✔ ✔✔✔ ✔✔✔✔ ✔✔☞✌✺✺✬✰ ✻✼ ✽✾✿ ❀❁❂ ❃❁❄❃ ❅✼❆❃❇✼ ✽❈ ❉❀❊✿❄✼❉❃❅❂❀ ✿❀ ❁❉❃ ❋✿❉❃❅✾✽❉❀❊✿❃✿❉ ❅❃✿❊❉ ❅❃ ❃❇❉❃✿ ❁❀❊✿❄ ❃● ❍■❃❉❁ ❃❅❏❃❈ ❅●❍■ ❃❇✼ ✽❈ ❉✼❁❈ ❅❑✾▲❑✾❉❃❆▼ ❊❅❂❃❃❂◆✾❅❖❈✼ P❊◗❀✽❀ ❃❑ ❘❅❅❙❉❁❈ ❅❑✾▲ ❅❃❂❀ ❚❅❃ ◆❊❅✿ ❃❄ ❃❑ ❯❀✿❉❃❅❏✾❑❑❃❄ ❃❉❃❂▲❁
Reaching the first replay breakpoint, start of the selected time interval
Interaction between the GDB server, executed
on the MPSoC and our GDB extension, executed on the host
Deterministic replay
MPSoC software function calls
3.3 Conclusions and Research Perspectives
With the increasing scale, complexity and nondeterminism of computing systems, determin-istic record replay (DRR) has recently regained interest as a promising solution to software design and debugging. Applied in various contexts, DRR targets different sources of nondeter-minism and proposes different trade-offs between performance and precision. In the domain of embedded systems, however, its application has been limited and has primarily considered the record and replay of interrupts.
ReDSoC is a software-level DRR solution targeting MPSoC and multiple sources of nonde-terminism. Considering a generic hardware model of MPSoC systems and standard API for embedded applications, it defines a debugging methodology applying space and time reduc-tion criteria to the error search space. The ReDSoC tools facilitate human comprehension as they are able to focus on a specific part of the target software and consider a limited time interval. ReDSoC has been implemented in real experimental platforms including an embed-ded system and a multicore NUMA system. It has been successfully used to debug several multimedia applications.
Concerning the debugging methodology, the selection of the suspected software parts and the time interval to debug is a delicate issue which for now relies on the developer experience. It would be highly beneficial and interesting to couple the proposed debugging methodology with techniques able to automatically delimit "problem zones". The automatic detection of abnormal behavior may be based on different methods including statistical analysis, data mining, probabilistic prediction evaluations, etc.
The idea of zoom debugging is not new. Indeed, every developer implicitly zooms and de-zooms during the analysis of a system. The developer executes an analysis cycle during which he/she decides to focus on a given part of the execution and strives to replay this part and obtain more information. However, in most cases there is no explicit support to guarantee the reproduction of the execution or to delimit the suspected part. The contribution of ReDSoC is to provide a set of tools to facilitate such a debugging cycle. The idea of zooming into an application by considering the different hierarchical levels of its architecture proves to be highly beneficial. However, in most cases and especially in the case of embedded systems, there is a need to explore lower levels of abstraction. The question is, however, how to marry acceptable performance with the possibility to zoom both horizontally and vertically? ReDSoC uses trace visualization which greatly facilitates the debugging task of the developer. Our belief is that a visual support, representing the execution history of a target system, with the possibility of going back and examining past events beyond the current call stack, becomes a necessary feature for future development environments. The question of trace visualization and the possibility of browsing trace data is related to the hot topic of data visualization [45,48]. Our proposal is independent from execution platforms as it is based on a general model for MPSoC and an MPSoC API. However, task-based programming models are not the only ones used in the embedded system domain. We think that the future of debugging techniques is to consider higher levels of the application stack and namely the used programming models.
The developer needs to be able to work in a top-down approach, starting by the human-comprehensive application entities and interactions before going down to operating system details. Some works exist in the domain of interactive debugging [111] but the approach is to be investigated for post-mortem analysis.


![Figure 2.4 – EMBera Components in the SVC Application [190]](https://thumb-eu.123doks.com/thumbv2/123doknet/14463858.713159/34.892.174.755.147.546/figure-embera-components-svc-application.webp)