NEURO
Differentiation between Parkinson disease and other forms
of Parkinsonism using support vector machine analysis
of susceptibility-weighted imaging (SWI): initial results
S Haller&S Badoud&D Nguyen&I Barnaure&
M-L Montandon&K-O Lovblad&PR Burkhard
Received: 7 April 2012 / Revised: 3 June 2012 / Accepted: 5 June 2012 / Published online: 15 July 2012 # European Society of Radiology 2012
DOI 10.1007/s00330-012-2579-y
Abstract
Objectives To diagnose Parkinson disease (PD) at the indi-vidual level using pattern recognition of brain susceptibility-weighted imaging (SWI).
Methods We analysed brain SWI in 36 consecutive patients with Parkinsonism suggestive of PD who had (1) SWI at 3 T, (2) brain123I-ioflupane SPECT and (3) extensive neurological testing including follow-up (16 PD, 67.4±6.2 years, 11 fe-male; 20 OTHER, a heterogeneous group of atypical
Parkinsonism syndromes 65.2±12.5 years, 6 female). Analy-sis included group-level comparison of SWI values and individual-level support vector machine (SVM) analysis. Results At the group level, simple visual analysis yielded no differences between groups. However, the group-level anal-yses demonstrated increased SWI in the bilateral thalamus and left substantia nigra in PD patients versus other Parkin-sonism. The inverse comparison yielded no supra-threshold clusters. At the individual level, SVM correctly classified PD patients with an accuracy above 86 %.
Conclusions SVM pattern recognition of SWI data provides accurate discrimination of PD among patients with various forms of Parkinsonism at an individual level, despite the absence of visually detectable alterations. This pilot study warrants further confirmation in a larger cohort of PD patients and with different MR machines and MR parameters. Key Points
• Magnetic resonance imaging data offers new insights into Parkinson’s disease
• Visual susceptibility-weighted imaging (SWI) analysis could not discriminate idiopathic from atypical PD • However, support vector machine (SVM) analysis provided
highly accurate detection of idiopathic PD
• SVM analysis may contribute to the clinical diagnosis of individual PD patients
• Such information can be readily obtained from routine MR data
Keywords Parkinson disease . SWI . Brain iron deposition . SVM . Early diagnosis
Abbreviations
AD Alzheimer disease DaTScan 123I-ioflupane SPECT
DN dentate nucleus (of the cerebellum) DTI diffusion tensor imaging
S. Haller (*)
:
K.-O. LovbladService neuro-diagnostique et neuro-interventionnel DISIM, Hôpitaux Universitaires de Genève,
Rue Gabrielle Perret-Gentil 4, 1211 Genève 14, Switzerland e-mail: sven.haller@hcuge.ch S. Badoud
:
P. BurkhardDepartment of Neurology, Geneva University Hospitals, Geneva, Switzerland
S. Badoud
:
P. BurkhardFaculty of Medicine, University of Geneva, Geneva, Switzerland
D. Nguyen
Centre Diagnostic Radiologique Carouge, 1b Clos de la Fonderie,
1227 Carouge, Switzerland I. Barnaure
Service de Radiologie, Geneva University Hospitals, Geneva, Switzerland
M.-L. Montandon
Nuclear medicine and molecular imaging unit, DISIM, Geneva University Hospitals,
Geneva, Switzerland M.-L. Montandon
Faculty of Medicine, University of Geneva, Geneva, Switzerland
FA fractional anisotropy GM grey matter
MCI mild cognitive impairment MRI magnetic resonance imaging
MSA-P Parkinson variant of multiple system atrophy PD Parkinson disease
PSP progressive supranuclear palsy RBF radial basis function
RN red nucleus ROI region of interest
SMO sequential minimal optimisation SN substantia nigra
SPECT single-photon emission computed tomography SVM support vector machine
SWI susceptibility-weighted imaging TBSS tract-based spatial statistics TFCE threshold free cluster enhancement VBM voxel-based morphometry
WM white matter
Introduction
Brain iron deposition has attracted increasing attention in neurodegeneration, occurring during normal aging [1] but being more marked in various neurodegenerative disorders [2], in particular in mild cognitive impairment (MCI) and Alzheimer disease (AD) [3–5]. Brain iron deposition has been proposed to play a key role in the pathogenesis of Parkinson disease (PD) [6,7].
In the current investigation, we assessed recently introduced susceptibility-weighted imaging (SWI) [8] in PD. Brain MRI is routinely performed in the diagnostic work-up of suspected PD, mainly to exclude other confounding abnormalities. An uncommon alteration visible on conventional MRI involves narrowing or disappearance of the pars compacta of the sub-stantia nigra (SN) on T2 weighted-imaging [9], yet this sign has low sensitivity and specificity, and contributes marginally to the diagnosis of PD, in particular at an early stage.
Based on the assumption that PD is associated with systematic brain SWI alteration, which is too subtle to be detected by visual analysis, we used an advanced computer-based analysis. It is important to distinguish PD from other degenerative or secondary forms of Parkinsonism, in view of its long disease duration, its relatively good prognosis and its remarkable response not only to dopaminergic agents but also to deep brain stimulation, providing relief of motor disability. This discrimination may sometimes be challeng-ing based on clinical assessment alone, in particular in early stages of the disease [10]. In order to achieve a potentially clinically applicable diagnosis at the individual level, we implemented a pattern recognition approach, which can be illustrated by the example of face recognition. Individual
faces are not detected based on single features such as the tip of the nose, ears or eyes, but by a combination of multiple features, even though each individual feature may not be significantly different between groups (review [11]). As the most relevant clinical question is not the discrimination of PD versus healthy controls, but the diagnosis of PD versus other forms of Parkinsonism, we included 36 consecutive community-dwelling subjects with suspected PD. Inclusion criteria were brain123I-ioflupane SPECT (‘DaTScan’) and extensive neurological testing including long-term follow-up as reference standard.
In particular, we addressed the question whether support vector machine (SVM) [12] pattern recognition of SWI data may contribute to the diagnosis of PD at an individual level.
Methods
Subjects
This retrospective study was approved by the local ethics committee. We included all consecutive patients seen in our institution between 2006 and 2010 with various forms of Parkinsonism who met the following criteria: (1) SWI at 3 T during clinical workup, (2) brain 123I-ioflupane SPECT (‘DaTScan’) as reference standard, (3) extensive neurological testing including clinical follow-up of at least 1 year and (4) absence of evident morphological findings on brain MRI.
The final sample included 16 PD patients (PD, 67.4± 6.2 years, 9 female) and 20 patients with another form of Parkinsonism (OTHER, 65.2±12.5 years, 8 female). Age, sex and Fazekas score did not differ significantly between the two groups.
For the PD group, a diagnosis of PD was made in the presence of typical, asymmetrical and levodopa-responsive Parkinsonism meeting the UK Parkinson’s Disease Society Brain Bank criteria, including at least two supportive criteria such as slow progression or peak-dose dyskinesia. PD was moderately advanced (mean Hoehn & Yahr stage [13]: 2.3+ 0.6), and none of these patients had atypical features, even after at least 1 year of follow-up (mean follow-up duration: 6.4+3.3 years). In addition, all had an asymmetrical de-crease of 123I-ioflupane uptake in the posterior aspect of one or both putamen on SPECT. The OTHER group was more heterogeneous, reflecting the prevalence of common PD-mimicking conditions in the daily activity of a move-ment disorders clinic. All of these patients exhibited Parkin-sonism defined as the presence of bradykinesia associated with resting tremor or rigidity. It included pathologies as varied as multiple system atrophy (MSA, n04), progressive supranuclear palsy (PSP, n01), dementia with Lewy body (n02), vascular Parkinsonism (n01), atypical tremors (n05) and psychogenic Parkinsonism (n02). In five cases, a firm
clinical diagnosis could not be established at last assess-ment, and these patients were labeled as having mixed Parkinsonism.
MR Imaging
MR imaging was performed using a conventional clinical 3.0-T MR system (Magnetom Trio, Siemens, Erlangen, Germany). We used a standard SWI sequence [8]: field of view 352×448, 72 slices, voxel size 0.5×0.5×1.2 mm, echo time TE 20 ms, repetition time TR 34 ms and 1 average. Additional sequences (T1w, T2w, FLAIR) were acquired and analysed to exclude major brain abnormalities. White matter lesions were analysed according to the Fazekas score [14].
Statistical analysis
Age, ROI volume and ROI mean signal intensity were ana-lysed in parametric unpaired t-tests, and gender and visual rating of SWI in non-parametric unpaired Mann-Whitney tests. P-values<0.05 were considered significant.
Visual Analyses
The presence of microbleeds was visually analysed because of the near-random distribution. A visual rating scale (0-3) anal-ysis [15] was applied to the SN, red nucleus (RN), dentate nucleus (DN) of the cerebellum and putamen. The DN was not covered in the investigated SWI volume in six subjects.
Voxel-wise analyses
The voxel-wise analyses were performed as in [5]. Pre-processing of the SWI data was done in the FSL software package [16]. All individual images were linearly trans-ferred into Montreal Neurological Institute (MNI) standard space using FLIRT (part of FSL). Since SWI images are relative data, we performed intensity normalisation by nor-malising each individual image with respect to the average signal of the ventricular system [5].
Group-level analyses
Voxel-wise statistical analysis was performed in RANDOM-ISE, part of FSL, corrected for multiple comparisons imple-menting threshold-free cluster enhancement (TFCE) considering fully corrected P-values<0.05 as significant [17]. Age and gender were used as non-explanatory co-regressors.
The linear spatial normalisation alignment of the infra-tentorial structures was less accurate than for the supraten-torial regions. In combination with the small volumes of the SN and RN, these structures were additionally manually segmented and analysed with respect to volume and mean
signal intensity. This manual segmentation was performed on the spatially normalised data, which already compensate for differences in global brain volume.
Individual-level SVM analysis
The individual SVM classification analysis is identical to previous studies [5,18] and analysed in the freely available WEKA software package (http://www.cs.waikato.ac.nz/ml/ weka, Version 3.6.1). In a first step, we performed a“Relief” [19] feature selection because not all voxels discriminate between groups. Both the inclusion of non-discriminative voxels and the exclusion of discriminative voxels reduce the classification accuracy. We selected the top 100, 250, 500, 750 and 1,000 features, implementing ten-fold cross validation. The second step consisted of the SVM classification sequen-tial minimal optimisation (SMO) [20] with a radial basis function (RBF) kernel [21]. There are two fundamental parameters. GAMMA represents the width of the radial basis function, and C represents the error/trade-off parameter that adjusts the importance of the separation error in the creation of the separation surface. Based on our previous experience of similar analyses in the domain of mild cognitive impairment, which showed best results for C01 [5, 18], GAMMA was iteratively explored from 0.01 to 0.09, with an increment of 0.01, while C was fixed to 1.00. We performed ten repetitions of a ten-fold cross validation technique.
Results
Visual analysis
Only one patient (of the PD group) had one microbleed. Due to the small number of microbleeds, no additional statistical analyses were performed.
There was no significant difference in the visual rating scale [15] between groups (Fig.1).
Group-level analyses
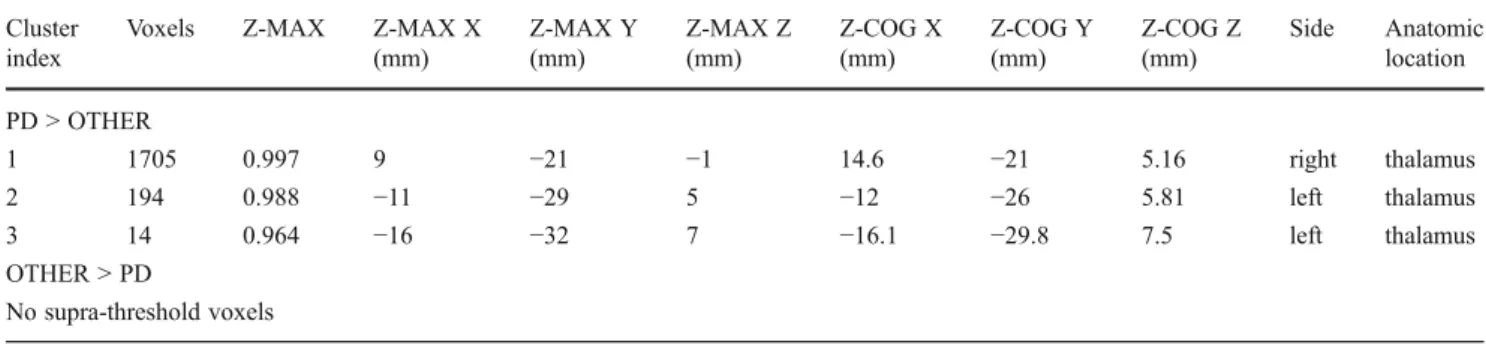
PD versus OTHER patients had increased SWI values in the bilateral, right-dominant thalamus (Fig. 2, Table 1). The inverse comparison yielded no supra-threshold clusters. The additional ROI analysis in SN and RN yielded no significant difference in volume between groups, yet signif-icantly (P< 0.05) increased signal intensity in PD versus OTHER in the left SN (Fig.3).
Individual-level SVM analysis
SVM analysis of SWI provided a correct classification of PD versus OTHER with an accuracy of up to 86.92 ±
16.59 % (Table 2). The spatial distribution of the most discriminative voxels (features) overlapped substantially with the results of the group-level analysis in particular in thalamus bilaterally, while additional discriminative voxels were identified in bilateral head of caudate nucleus (Fig.2).
Discussion
Computer-based SVM analysis of brain SWI data provided an accurate individual detection of PD patients despite the absence of visually detectable differences. Given the exten-sive use of brain MRI during routine clinical workup of Parkinsonism and the operator-independent and almost au-tomatic post-processing of the data, this analysis features easy applicability and significant benefit at the bedside. The method is not intended to replace but to complement exist-ing tests, ideally as combined multi-modal assessment in-cluding other imaging parameters such as 3DT1 and DTI as well as laboratory, neurological testing, nuclear medicine, etc., to further improve accuracy and robustness of an indi-vidual diagnosis of PD.
Visual analysis of SWI images in PD
In the investigated sample, only one microbleed was pres-ent. The presence of microbleeds thus does not represent a clinically useful parameter for the discrimination PD versus other forms of Parkinsonism.
The previously proposed semi-quantitative visual rating scale in PD [15] found no significant difference between groups. The original study included 11 patients with PD, 12 with PSP, 12 with the Parkinson variant of MSA (MSA-P) and 11 healthy controls. The RN discriminated PSP from PD and MSA-P. The putamen differentiated PSP from PD. The rating score could however not differentiate MSA-P and PD. In conclusion, the score proposed in this study appeared best suited to detect PSP, while the visual rating was not sufficient to discriminate PD from the other forms of Par-kinsonism. Our results are in agreement with these findings.
Group-level analysis of SWI
The voxel-wise analysis of the SWI images yielded signifi-cantly increased SWI values in PD patients versus other Parkinsonism in bilateral, right-dominant thalamus. The addi-tionally performed ROI analysis, which was performed be-cause of the inaccuracy of automatic spatial normalisation in the infratentorial region in relation to the small size of SN and RN, demonstrated a significant increase of the physiological
0 1 2 3
right RN left RN right SN left SN right putamen
left putamen
right DN left DN
Visual rating scale
PD OTHER
Fig. 1 Visual rating of SWI in PD. In accordance with a previous investigation [15], the SWI in substantia nigra (SN), red nucleus (RN) and dentate nucleus (DN) of the cerebellum and putamen was visually assessed and graded from 0-3. There was no significant difference in this visual rating score between PD versus OTHER. Average visual rating score separated into left and right for PD (dark grey) and OTHER (light grey). Error bars indicate standard deviation
Fig. 2 Voxel-wise SWI analysis in PD. PD patients versus OTHER had increased signal intensity in bilateral, right-dominant thalamus (red). The inverse comparison yielded no supra-threshold clusters. The most discriminative voxels (features) identified using the RELIEF feature selection algorithm, which are the basis for the individual-level SVM analysis, are illustrated for comparison in blue. Note the good overlap despite the fundamentally different methodology. Compared to the group-level voxel-wise analysis, the RELIEF additionally identi-fied bilateral head of caudate nucleus as discriminative regions. These regions also displayed a trend in the group-level analysis, which did not reach multiple comparisons corrected significance. Axial slices at the indicated position in MNI (Montreal Neurological Institute) stan-dard space coordinates (radiological convention with right hemisphere on left hand side). Grey: Mean SWI value. Threshold-free cluster enhancement (TFCE) corrected for multiple comparisons at P<0.05. Supra-threshold voxels were enlarged using TBSS fill (part of FSL) for illustrative purposes
low SWI signal in the left SN in PD patients, and a clear yet non-significant trend in the contralateral SN. This observation is in agreement with previous studies [15]. This asymmetry might be related to Parkinsonism being clinically more prom-inent on the right in the majority of PD patients (12 right versus 4 left dominant parkinsonism).
Only few previous studies used SWI to assess brain iron deposition in PD. The visual analysis study of SWI at 1.5 T discussed above showed brain iron in the putamen, SN, RN and DN in PD patients (and healthy controls) compared to MSA-P and PSP patients [15]. Another SWI study at 1.5 T in 16 PD, 8 MSA-P patients and 44 age-matched healthy controls used manually defined ROIs. MSA-P patients had higher iron deposition in the putamen and thalamus [22]. Both investigations are in principle agreement with our results.
SWI-derived phase shift values were analysed using a ROI approach in 40 patients with PD without dementia and 26 controls [23]. The SN was the only region that differed
between PD and controls. Huang et al. evaluated SWI at 3 T in 30 PD patients and 19 controls in a manual ROI analysis [24]. The mean phase values of both the SN and globus pallidum differed significantly between the PD group versus normal controls. Three studies focussed more on methodo-logical aspects. A study in 51 patients with symptoms of PD compared several pulse sequences at 3 T to assess brain iron concentrations [25]. SWI contrast correlated well with brain iron concentration. One study assessed SWI-derived phase radians in 42 PD patients and 30 control subjects at 1.5 T, and demonstrated lower phase radians of the SN, caudate nucleus and RN in PD patients [26]. Finally, SWI-derived phase shift was assessed at 3 T in 12 PD patients and 5 controls [27]. Most of these studies provide group-level results; application of these findings in daily clinical neuroradiology is therefore limited.
The group-level comparisons in the current investigation should be interpreted with caution because of the composition
Table 1 Lists all significant voxels in SWI signal intensity between PD and OTHERS. Significant TFCE corrected differences were observed for PD versus OTHERS in bilateral thalamus, while the inverse comparison of OTHER versus PD yielded no supra-threshold clusters
Cluster index
Voxels Z-MAX Z-MAX X
(mm) Z-MAX Y (mm) Z-MAX Z (mm) Z-COG X (mm) Z-COG Y (mm) Z-COG Z (mm) Side Anatomic location PD > OTHER 1 1705 0.997 9 −21 −1 14.6 −21 5.16 right thalamus 2 194 0.988 −11 −29 5 −12 −26 5.81 left thalamus 3 14 0.964 −16 −32 7 −16.1 −29.8 7.5 left thalamus OTHER > PD No supra-threshold voxels
Cluster index0 number of cluster, voxels 0 number of supra-threshold voxels in cluster, Z-MAX 0 maximum Z value (or 1 - p-value) within each cluster, Z-MAX X,Y,Z0 location of maximum p-value per cluster in MNI standard space (X, Y, Z) and Z-COG X,Y,Z 0 centre of gravity of the cluster in MNI standard space (X, Y, Z), side and anatomic location
0 200 400 600 800 1000 1200
left RN right RN left SN right SN
Volume PD OTHER PD OTHER 700 750 800 850 900 950 1000
left RN right RN left SN* right SN
Signal intensity
Fig. 3 ROI analysis of red nucleus and substantia nigra. The region of interest analysis of red nucleus (RN) and substantia nigra (SN) yielded no significant difference in volume between groups (A). Concerning
signal intensity, there was a uniform tendency of increased signal intensity in PD (dark grey) versus OTHER (light grey), which was significant (P<0.05) in left SN
of the control group. The focus of the current investigation was the individual diagnosis of PD subjects. The clinically relevant analysis was thus oriented towards detection of PD in a group of individuals with a variety of PD-like conditions. The inclusion of healthy controls would have been irrelevant in this context. Even a classifier that perfectly discriminates between confirmed PD and healthy controls does not neces-sarily discriminate between PD and other forms of Parkinson-ism. Indeed, the group composition of the control group may influence the performance of a classifier depending on the prevalence of each condition. For example, the frequency of PD (69.6 % of Parkinsonian syndromes) is approximately 22 times higher than the prevalence of MSA (3.2 %) [28]. This means that a“dummy” or null classifier that simply always gives the diagnosis of PD would obtain 95 % accuracy for the correct diagnosis of PD versus MSA in a community-dwelling sample. The pre-selection of patients with specific diseases might represent a systematic confound with respect to the performance of a classifier in the clinical setting, and we consequently included consecutive, unselected patients from our institution. Moreover, the presence of a 123I-ioflupane SPECT was an inclusion criterion in this study, but this is not available in healthy controls because of radiation exposure. The apparent disadvantage of using unselected consecutive patients is that it is difficult to interpret group-level results. We present these group-level results mainly to visualise detectable SWI changes between PD versus OTHER as the basis for the individual-level pattern recognition analysis.
Individual-level SVM classification analysis
In order to obtain an individual discrimination of PD sub-jects, we adopted a complex methodology including a spa-tial and intensity normalisation of SWI data, feature selection of the most discriminative voxels, and subsequent SVM classification [5,18]. The best classification accuracy was about 86 %.
The already-discussed manual ROI analysis study by Huang et al. evaluated SWI at 3 T in 30 PD patients and 19 age-matched normal controls [24]. The best diagnostic accuracy for the detection of PD was 59.2 % (29/49), which is actually close to the null classification accuracy. The other study by Wang et al. [22] analysed SWI phase shift in manually defined ROIs in 16 PD, 8 MSA-P and 44 age-matched healthy controls. The putamen provided the best differentiation of MSA-P versus PD with an area under the curve of 0.92, which translates into a sensitivity of approximately 90 % and a specificity of approximately 82 %. The approach of voxel-wise data preprocessing followed by SVM classification described in this study is operator independent and nearly auto-matic, and yielded higher classification accuracy com-pared to these manual ROI investigations. Moreover, as discussed above, the pre-selection of specific diagnoses such as MSA-P, which do not mirror the prevalence of these conditions in a community-dwelling sample, may systematically confound the results of such classification analyses with respect to potential clinical applications in prospective, unselected cases.
It is noteworthy that SVM [12] analyses for individual classification are fundamentally different from the group-level ROI or voxel-wise analyses discussed above. Such voxel-wise analyses are univariate tests, which separately analyse each included ROI or voxel between two (or more) groups. Given the multiple tests for voxel-wise analyses, it is necessary to implement a correction for multiple compar-isons as a second step. By comparison, individual-level SVM analyses are multivariate tools that originate from a field called“machine learning” or multi-voxel pattern anal-ysis (MVPA), a branch of artificial intelligence. The aim is to identify patterns that allow for the discrimination of individual subjects. There is only one resulting parameter per subject; hence, there is no need for corrections for multiple comparisons (review [11]). There are only a few previous applications of SVM classification in the domain
Table 2 Individual SVM classification of PD based on SWI SVM classification
16 PD, 20 OTHER-NULL classification accuracy 55.6 % (20/36)
No. of features Accuracy TP rate FP rate TN rate FN rate
100 86.92(16.59) 0.87(0.28) 0.14(0.23) 0.87(0.23) 0.13(0.28)
250 82.83(18.38) 0.87(0.28) 0.21(0.28) 0.79(0.28) 0.13(0.28)
500 83.42(18.18) 0.87(0.28) 0.20(0.27) 0.80(0.27) 0.13(0.28)
750 81.58(18.44) 0.83(0.31) 0.20(0.26) 0.81(0.26) 0.18(0.31)
1000 82.25(18.98) 0.81(0.32) 0.17(0.26) 0.83(0.26) 0.19(0.32)
Accuracy, true positive (TP), false positive (FP), true negative (TN) and false negative (FN) rates for individual classifications using a SVM classifier using the indicated number of selected features for the individual classification of PD versus OTHER. Note that the accuracy is calculated as average accuracy of ten repetitions using ten-fold cross validation (average and standard deviation)
of PD. The majority of these studies applied SVM classifiers to behavioral data of gait analysis [29], fine motor force tracking [30], analysis of wearable accelerometer sensors [31] or joint movement [32], and even voice recording [33]. The only previous SVM application to MRI data in the domain of PD analysed VBM pre-processed grey matter in 21 PD, 11 MSA-P and 10 PSP, and 22 healthy controls [34]. The best classification accuracy up to 96.8 % was obtained for PSP versus PD, while the accuracy was 71.9 % for MSA versus PD. PD could not be discriminated from controls. These classification accuracies are consistent with the clinical neuroradiological experience that PSP has the most pronounced visible alterations in brain MRI with selected atrophy of the mesencephalon, referred to as the “king penguin” or “hummingbird” sign [35], while changes in MSA-P are more subtle and PD-associated changes are almost always absent. Concerning analyses of white matter derived from diffusion tensor imaging (DTI) data, there are currently no SVM investigations in the domain of PD. However, a previous stepwise logistic regression analysis study discriminated PD versus PSP based on apparent dif-fusion coefficient (ADC) values in ROIs in the basal gan-glia, notably the putamina, with a sensitivity of 90 % and a positive predictive value of 100 %, while this region did not discriminate between PSP and MSA-P [36]. Another related study demonstrated that ADC discriminates between MSA-P versus MSA-PD and controls, yet not between MSA-PD and controls [37]. Assessment of SWI may be a complimentary parame-ter with respect to the discussed VBM grey matparame-ter and DTI white matter data. Ideally, a classification analysis should integrate multiple imaging contrasts e.g., T1w VBM, DTI and SWI, preferably in combination with other parameters such as gait analysis, laboratory tests, neuropsychology, etc., with the intention to further increase the accuracy and ro-bustness of individual diagnosis. It is however not trivial to optimise such multimodal classification analyses, which is a domain of current research. The SVM analysis can be per-formed on standard computer hardware within minutes us-ing free software, which is thus eventually potentially applicable in a clinical routine setting.
Limitations
The major limitation of this investigation is the relatively small sample size. The high accuracy rates of individual classification exceeded our expectations. These values were obtained by a well-established ten-fold cross validation where nine parts are used for training and the remaining part is used for testing the classifier. Even though this cross-validation approach is an appropriate method and for the number of subjects involved in our study, the present results seem too optimistic, probably related to some degree of overfitting of the data. Moreover, we first performed a
feature selection. The rationale behind this approach is that not all voxels discriminate between groups and the inclusion of non-discriminative voxels will decrease classification performance. Also, the number of voxels without feature selection clearly exceeds the number of subjects. This pro-cessing chain of feature selection followed by SVM classifi-cation was successfully applied in a few recent investigations [5, 18,38], but it might still contribute to some degree of overfitting of the data. We present our data as a pilot study showing the feasibility of this methodology in the domain of Parkinson disease. Additional validation in larger independent data sets, which should be ideally acquired on different MR systems, field strengths and MR parameters, which might influence the image contrast [39], is warranted to confirm the present findings.
Most previous research-oriented SWI studies used phase images [40]. These phase images are not used for clinical diagnosis and are infrequently stored on image servers. We analysed SWI images taking into account that these SWI images correspond to relative values and that iron deposi-tion is not the only origin for lower SWI values. Other origins of decreased SWI values include haemorrhage, cal-cifications, post-operative debris and deposition of other metals. We normalised the SWI images with respect to the water signal in the cerebrospinal fluid, inferring a constant SWI value in water [5]. A recent study compared several pulse sequences at 3-T MRI implementing a similar ap-proach showed that SWI correlates well with brain iron content [25]. Although this approach is less direct than the analysis of the phase images, it allows for a wider applica-tion of the presented analysis strategy.
References
1. Aquino D, Bizzi A, Grisoli M et al (2009) Age-related iron deposition in the basal ganglia: quantitative analysis in healthy subjects. Radiology 252:165–172
2. Thomas M, Jankovic J (2004) Neurodegenerative disease and iron storage in the brain. Curr Opin Neurol 17:437–442
3. Smith MA, Zhu X, Tabaton M et al (2010) Increased iron and free radical generation in preclinical Alzheimer disease and mild cog-nitive impairment. J Alzheimers Dis 19:363–372
4. Bishop GM, Robinson SR, Liu Q et al (2002) Iron: a pathological mediator of Alzheimer disease? Dev Neurosci 24:184–187 5. Haller S, Bartsch A, Nguyen D et al (2010) Cerebral microhemorrhage
and iron deposition in mild cognitive impairment: susceptibility-weighted MR imaging assessment. Radiology 257:764–773
6. Dexter DT, Carayon A, Javoy-Agid F et al (1991) Alterations in the levels of iron, ferritin and other trace metals in Parkinson’s disease and other neurodegenerative diseases affecting the basal ganglia. Brain 114:1953–1975
7. Youdim MB, Ben-Shachar D, Riederer P (1993) The possible role of iron in the etiopathology of Parkinson’s disease. Mov Disord 8:1–12 8. Haacke EM, Xu Y, Cheng YC et al (2004) Susceptibility weighted
9. Oikawa H, Sasaki M, Tamakawa Y et al (2002) The substantia nigra in Parkinson disease: proton density-weighted spin-echo and fast short inversion time inversion-recovery MR findings. AJNR Am J Neuroradiol 23:1747–1756
10. Hughes AJ, Daniel SE, Ben-Shlomo Y et al (2002) The accuracy of diagnosis of parkinsonian syndromes in a specialist movement disorder service. Brain 125:861–870
11. Haller S, Lovblad KO, Giannakopoulos P (2011) Principles of classification analyses in mild cognitive impairment (MCI) and Alzheimer disease. J Alzheimers Dis 26:389–394
12. Noble WS (2006) What is a support vector machine? Nat Bio-technol 24:1565–1567
13. Hoehn MM, Yahr MD (1967) Parkinsonism: onset, progression and mortality. Neurology 17:427–442
14. Fazekas F, Chawluk JB, Alavi A et al (1987) MR signal abnor-malities at 1.5 T in Alzheimer’s dementia and normal aging. AJR Am J Roentgenol 149:351–356
15. Gupta D, Saini J, Kesavadas C et al (2010) Utility of susceptibility-weighted MRI in differentiating Parkinson’s disease and atypical parkinsonism. Neuroradiology 52:1087–1094
16. Smith SM, Jenkinson M, Woolrich MW et al (2004) Advances in functional and structural MR image analysis and implementation as FSL. NeuroImage 23:S208–19
17. Smith SM, Nichols TE (2009) Threshold-free cluster enhance-ment: addressing problems of smoothing, threshold dependence and localisation in cluster inference. NeuroImage 44:83–98 18. Haller S, Nguyen D, Rodriguez C et al (2010) Individual
predic-tion of cognitive decline in mild cognitive impairment using sup-port vector machine-based analysis of diffusion tensor imaging data. J Alzheimers Dis 22:315–327
19. Kononenko I,Šimec E, Robnik-Šikonja M (1997) Overcoming the myopia of inductive learning algorithms with RELIEFF. Appl Intell 7:39–55
20. Platt J (1999) Sequential minimal optimization: A fast algorithm for training support vector machines. Advances in Kernel methods-support vector learning 208
21. Scholkopf B, Sung KK, Burges CJC et al (1997) Comparing support vector machines with Gaussian kernels to radialbasis func-tion classifiers. IEEE Trans Signal Process 45:2758–2765 22. Wang Y, Butros S R, Shuai X et al (2011) Different iron-deposition
patterns of multiple system atrophy with predominant parkinsonism and idiopathetic parkinson diseases demonstrated by phase-corrected susceptibility-weighted imaging. AJNR Am J Neuroradiol 23. Zhang J, Zhang Y, Wang J et al (2010) Characterizing iron
depo-sition in Parkinson’s disease using susceptibility-weighted imag-ing: an in vivo MR study. Brain Res 1330:124–130
24. Huang XM, Sun B, Xue YJ et al (2010) Susceptibility-weighted imaging in detecting brain iron accumulation of Parkinson’s dis-ease. Zhonghua Yi Xue Za Zhi 90:3054–3058
25. Rossi M, Ruottinen H, Elovaara I et al (2010) Brain iron deposi-tion and sequence characteristics in Parkinsonism: comparison of
SWI, T* maps, T-weighted-, and FLAIR-SPACE. Invest Radiol 45:795–802
26. Zhang W, Sun SG, Jiang YH et al (2009) Determination of brain iron content in patients with Parkinson’s disease using magnetic susceptibility imaging. Neurosci Bull 25:353–360
27. Grabner G, Haubenberger D, Rath J et al (2010) A population-specific symmetric phase model to automatically analyze susceptibility-weighted imaging (SWI) phase shifts and phase symmetry in the human brain. J Magn Reson Imaging 31:215– 220
28. Pezzoli G, Canesi M, Galli C (2004) An overview of parkinsonian syndromes: data from the literature and from an Italian data-base. Sleep Med 5:181–187
29. Jeon HS, Han J, Yi WJ et al (2008) Classification of Parkinson gait and normal gait using spatial-temporal image of plantar pressure. Conf Proc IEEE Eng Med Biol Soc 2008:4672–4675
30. Brewer BR, Pradhan S, Carvell G et al (2009) Feature selection for classification based on fine motor signs of Parkinson’s disease. Conf Proc IEEE Eng Med Biol Soc 2009:214–217
31. Patel S, Lorincz K, Hughes R et al (2009) Monitoring motor fluctuations in patients with Parkinson’s disease using wearable sensors. IEEE Trans Inf Technol Biomed 13:864–873
32. Chan J, Leung H, Poizner H (2010) Correlation among joint motions allows classification of Parkinsonian versus normal 3-D reaching. IEEE Trans Neural Syst Rehabil Eng 18:142–149 33. Ozcift A (2011) SVM feature selection based rotation forest
en-semble classifiers to improve computer-aided diagnosis of Parkinson disease. J Med Syst
34. Focke NK, Helms G, Scheewe S et al (2011) Individual voxel-based subtype prediction can differentiate progressive supranuclear palsy from idiopathic parkinson syndrome and healthy controls. Hum Brain Mapp 32:1905–1915
35. Groschel K, Kastrup A, Litvan I et al (2006) Penguins and hum-mingbirds: midbrain atrophy in progressive supranuclear palsy. Neurology 66:949–950
36. Seppi K, Schocke MF, Esterhammer R et al (2003) Diffusion-weighted imaging discriminates progressive supranuclear palsy from PD, but not from the Parkinson variant of multiple system atrophy. Neurology 60:922–927
37. Schocke MF, Seppi K, Esterhammer R et al (2002) Diffusion-weighted MRI differentiates the Parkinson variant of multiple system atrophy from PD. Neurology 58:575–580
38. Plant C, Teipel SJ, Oswald A et al (2010) Automated detection of brain atrophy patterns based on MRI for the prediction of Alz-heimer’s disease. NeuroImage 50:162–174
39. Haacke EM, Mittal S, Wu Z et al (2009) Susceptibility-weighted imaging: technical aspects and clinical applications, part 1. AJNR Am J Neuroradiol 30:19–30
40. Hopp K, Popescu BF, McCrea RP et al (2010) Brain iron detected by SWI high pass filtered phase calibrated with synchrotron X-ray fluorescence. J Magn Reson Imaging 31:1346–1354
![Fig. 1 Visual rating of SWI in PD. In accordance with a previous investigation [15], the SWI in substantia nigra (SN), red nucleus (RN) and dentate nucleus (DN) of the cerebellum and putamen was visually assessed and graded from 0-3](https://thumb-eu.123doks.com/thumbv2/123doknet/14844663.626739/4.892.462.816.79.386/visual-accordance-previous-investigation-substantia-cerebellum-visually-assessed.webp)