by
Nuria Margarit Bel
Diploma in Chemical Engineering
Chemical Institute of Sarria, Ramon Llull University, 2001
SUBMITTED TO THE DEPARTMENT OF MECHANICAL ENGINEERING
IN PARTIAL FULFILLMENT OF THE DEGREE OF
MASTER OF SCIENCE IN AERONAUTICS AND ASTRONAUTICS
at the
MASSACHUSETTS INSTITUTE OF TECHNOLOGY
February 2004
© 2004 Massachusetts Institute of Technology
All rights reserved
Signature of Author ...
Certified by ...
A tdb. .. MASSACHUSETTS INSTIT OF TECHNOLOGYJUL 01 2004
LIBRARIES
Department of Aeronautics and Astronautics
January 2004
John B. Heywood
Sun Jae Professor of Mechanical Engineering
Thesis Supervisor
...
Edward M. Greitzer
H.N. Slater Professor of Aeronautics and Astronautics
Chair, Committee on Graduate Students
IRE
AERO
by
Nuria Margarit Bel
Submitted to the Department of Aeronautics and Astronautics
January, 2004 in Partial Fulfillment of the
requirements for the Degree of Master of Science
at the Massachusetts Institute of Technology
ABSTRACT
A model for a plasma fuel reformer or plasmatron has been developed. The model was
based in a series of experiments realized at the Plasma Science and Fusion Center with
such a plasmatron. The device is set up to produce syngas (hydrogen and carbon
monox-ide gas mixture) from partial oxidation of any hydrocarbon. We studied the behavior of
methane as fuel and used the GRI methane combustion mechanism in our simulations.
The goal was to characterize the reactor to be able to understand and predict its
perfor-mance for a wide range of operating conditions, such as different flow rates, air to fuel
flow ratio or power supply.
The simulation tool used for this purpose was CHEMKIN 3.7. The fuel reformer was
designed as a reactor where combustion is initiated by an electric discharge due to ohmic
heating of the arc region. Two different types of reactors were used to model the
plasma-tron. The Plug Flow Reactor (PLUG) assumed a homogenous zero-dimensional closed
system. The Partially Stirred Reactor (PASR) considered random mixing determined by a
frequency mixing parameter, which is directly dependant of the system fluid dynamic
properties.
Experimental results with methane generated 6%-7% molar of hydrogen and 5% of
car-bon monoxide. Hydrogen and oxygen balance evidenced that water and carcar-bon dioxide
are important co-products, obtaining respectively 10% and 3% at the exhaust. Also
15%-20% of methane and 3%-5% of oxygen remained unreacted. From discharge observations,
energy estimations and model simulations, it was found that the electric arc initiates
com-bustion by locally rising the temperature and then propagating the reaction by heat and
mass transfer/mixing to the surroundings. Simulation results demonstrated that there is an
optimum characteristic mixing time for each residence time, depending on the initial
tem-perature reached at the arc. It was also found that the more spread the energy is, or the
more mass is heated to a moderate temperature, the better the performance results.
Thesis Supervisor: John B. Heywood
Title: Sun Jae Professor of Mechanical Engineering
First of all, I would like to thank Professor Heywood and Dr. Leslie Bromberg. Their
wis-dom and support have been of great assistance on my research. They taught me how to
develop my reasoning skills and how to ask for help when required. This thesis has been
possible thanks to their unconditional trust and guidance.
Alex Rabinovich and all the scientist working in the PSFC developing the plasmatron
pro-vided me with the knowledge and the data I needed for this project to go on. Thanks to
them all.
My friends in the Sloan Automotive Laboratory and at MIT contributed to my well-being
during the graduate student years, but above them all, I want to thank Jennifer Topinka,
because she has always been a wonderful mate.
Finally, I would like to thank my family and friends back in Spain, because I owe them
being here. They always encouraged me to come to MIT and now I am glad I listened to
them!
This research was supported by Arvin Meritor. Thanks to their interest in computation I
have been able to finish this work.
To Ernesto, for being there, for little things...
Abstract .. . . ..... ... . . .. . .. ... . ... 3
Acknowledgm ents . . . 5
Chapter 1. INTRODUCTION TO PLASMA FUEL REFORMING . . . . 1.1 Hydrogen benefits in Spark Ignition (SI) Internal Combustion Engines (ICE) 1.2 Objectives of modeling effort ... 1.2.1 Study of device performance ... 1.2.2 Prediction of behavior ... 1.3 Model description ... 1.3.1 Plasm atron design . . . . 1.3.2 Thermodynamic, chemical and fluid dynamic models . . . . 1.3.3 M ethane versus other fuels . . . . Chapter 2. PLASMATRON EXPERIMENTAL RESULTS
2.1 Plasmatron description
. . . .
2.1.1 Geometry and input streams . .
2.1.2 Characteristics of the discharge
2.2 Performance of the plasmatron . . . . Chapter 3. MODELING APROACH . . . .3.1 Chemical modeling . . . .
3.1.1 Equilibrium simulations . . . .3.1.2 Kinetic models: mechanisms
. . . . .
3.2 M ixing process . . . .3.2.1 Mixing parameters: epsilon and kappa
3.2.2 Perfectly mixed
. . . .
3.2.3 Partially mixed . . . .
Chapter 4. PERFECTLY MIXED MODEL . . .4.1 Chemical effects of the discharge . . . .
4.1.1 Temperature effect . . . .
4.1.2 Radicals presence
. . . .
4.2 Sensitivity analysis: adiabatic plug flow model
4.2.1 Premixed one-stage process . . . .
4.2.2 Oxygen enrichment
. . . .
4.2.3 Two-stage process: pre-combustion . .
4.3 Non-adiabatic plug flow model . . . .
15 15 1617
17
18
18 20 2123
23 2327
36
. . . . 47 . . . . 47 . . . . 47. . . .
50
54
5458
59
. . . . 65. . . .
65
. . . .
65
. . . . 70 . . . . 73 . . . . 74. . . .
76
. . . . 77. . . .
81
. . . . . . . . . . . .4.4 NOx generation: ammonia and hydrogen cyanide presence . .
Chapter 5. PARTIALLY STIRRED REACTOR MODE
5.1 Methane results with PASR . . . . 5.1.1 Effect of mixing time to residence time ratio 5.1.2 Different energy supply . . . .
5.1.3 Temperature analysis . . . .
5.1.4 Alternative model for energy supply . . . . 5.2 Comparison with experimental results . . . .
Chapter 6. CONCLUSIONS . . . .
R eferences . . . .
Appendix A. ADDITIONAL EXPERIMENTAL RESULTS Appendix B. KINETIC MECHANISMS . . . .
B. 1 Leeds mechanism . . . . B.2 GRI mechanism . . . . B.3 Warnatz mechanism . . . . L: PASR . . . . 87 . . . . 87 . . . . 90 . . . . 93 . . . . 95 . . . . 97 . . . . 97 99 101 . . . . 105 . . . 107 . . . 107 . . . 115 . . . 133 82
.
.
.
.
Figure 1.1 Sketch of the Plasmatron Design . . . . 19
Figure 2.1 Drawing of the Plasmatron Design Tested . . . . 24
Figure 2.2 3-D Mesh used to Simulate the Fluid Dynamics in the Plasmatron using
FLUENT: Wall and Atomization Air (purple), Plasma Air (yellow and
green), Core of the Discharge Region (red) . . . . 25
Figure 2.3 View of the Discharge Zone of the Plasmatron along the Vertical Direction
(Example of Fluid Dynamics Calculation using FLUENT) . . . . 26
Figure 2.4 View of the Discharge Region along the y Direction from the Plasmatron Exit. The Sequence of Images along Time includes Two Complete Dis-charges and a Third Arc Initiation . . . . 28
Figure 2.5 Characterization of the Length and Duration of the Arc of the Plasmatron
with a 600-W Power Supply . . . . 29
Figure 2.6 Arc Voltage Trace along Time Measured for the running Plasmatron with a
600-W Power Supply . . . . 30
Figure 2.7 Arc Current Trace along Time Measured for the running Plasmatron with a
600-W Power Supply . . . . 31
Figure 2.8 Arc Instantaneous Power Calculated from the Measured Voltage and Current
Traces with a 600-W Power Supply . . . . 31
Figure 2.9 Power Supplied to the Gas Mixture under the Arc along Time . . . . . 34 Figure 2.10 Heat Capacity of the Gas Mixture under the Arc as a Function of
Tempera-ture and Corresponding Used Linear Approximation . . . . 34 Figure 2.11 Volume of the Arc along Time . . . . 34
Figure 2.12 Molecular Weight of the Gas Mixture under the Arc as a Function of Tem-perature . . . . 34
Figure 2.13 Molar Composition of the Gas Mixture along the Plasmatron for Methane
Partial Oxidation with O/C = 1.01, 23% 02 Enrichment in Air and a 700-W
Power Supply (Dry Basis) . . . . 38
Figure 2.14 Molar Composition of the Gas Mixture along the Plasmatron for Methane
Partial Oxidation with O/C = 1.06, 23% 02 Enrichment in Air and a 700-W
Power Supply (Dry Basis) . . . . 38
Figure 2.15 Molar Composition of the Gas Mixture along the Plasmatron for Methane
Partial Oxidation with O/C = 1.11, 23% 02 Enrichment in Air and a 700-W
Power Supply (Dry Basis) . . . . 39
Figure 2.16 Molar Composition of the Gas Mixture along the Plasmatron for Methane
Partial Oxidation with O/C = 1.01, 23% 02 Enrichment in Air and a 700-W
Figure 2.17 Figure 2.18 Figure 2.19 Figure 2.20 Figure 2.21 Figure 2.22 Figure 2.23 Figure 2.24
Molar Composition of the Gas Mixture along the Plasmatron for Methane
Partial Oxidation with O/C = 1.06, 23% 02 Enrichment in Air and a 700-W
Power Supply (Wet Basis) . . . . 41
Molar Composition of the Gas Mixture along the Plasmatron for Methane
Partial Oxidation with O/C = 1.11, 23% 02 Enrichment in Air and a 700-W
Power Supply (Wet Basis) . . . . 41
Experimental Hydrogen Production Measured at the Exhaust of the Dis-charge Region as a Function of O/C ratio for Different 02 Air Enrichment of
Methane Partial Oxidation (Mass Fraction) . . . . 42
Experimental Water Production Measured at the Exhaust of the Discharge Region as a Function of O/C ratio for Different 02 Air Enrichment of
Meth-ane Partial Oxidation (Mass Fraction) . . . . 42
Experimental CO Production Measured at the Exhaust of the Discharge Region as a Function of O/C ratio for Different 02 Air Enrichment of
Meth-ane Partial Oxidation (Mass Fraction) . . . . 43
Experimental C02 Production Measured at the Exhaust of the Discharge Region as a Function of O/C ratio for Different 02 Air Enrichment of
Meth-ane Partial Oxidation (Mass Fraction) . . . . 43
Experimental Methane Composition Measured at the Exhaust of the Dis-charge Region as a Function of O/C ratio for Different 02 Air Enrichment of
Methane Partial Oxidation (Mass Fraction) . . . . 44
Experimental Methane Conversion at the Exhaust of the Discharge Region as a Function of O/C ratio for Different 02 Air Enrichment of Methane
Par-tial O xidation . . . . 44
Figure 3.1 Molar Composition along Time in a PLUG reactor for Methane Partial
Oxi-dation with Air at O/C= 1 and T= 1,500K using the Leeds Mechanism . 52
Figure 3.2 Molar Composition along Time in a PLUG reactor for Methane Partial
Oxi-dation with Air at O/C=1 and T=1,500K using the GRI Mechanism . . 53
Figure 3.3 Molar Composition along Time in a PLUG reactor for Methane Partial
Oxi-dation with Air at O/C=1 and T=1,500K using the Warnatz Mechanism 53
Figure 3.4 Turbulent Kinetic Energy in the Plasmatron Reactor Zone for Swirl Velocity
50 m/s and Total Mass Flow Rate of 5.9 g/s . . . . 57
Figure 3.5 Turbulent Dissipation Rate in the Plasmatron Reactor Zone for Swirl
Veloc-ity 50 m/s and Total Mass Flow Rate of 5.9 g/s . . . . 57
Figure 4.1 Molar Concentration of Species along Time and along the Plug Flow
Reac-tor for 1,100K Initial Temperature and O/C= . . . . 67
Figure 4.2 Temperature Profile inside the Plug Flow Reactor along Time for 1,100K
Figure 4.3 Molar Concentration of Species along Time and along the Plug Flow Reac-tor for 1,500K Initial Temperature and O/C=1 (Steam Reforming) . . . 68
Figure 4.4 Temperature Profile inside the Plug Flow Reactor along Time for 1,500K Initial Temperature and O/C= 1 (Steam Reforming) . . . . 68
Figure 4.5 Ignition Time as a Function of Initial Temperature in the Plug Flow Reactor
for O /C = 1 . . . . 69
Figure 4.6 Temperature Peak and Steady State Temperature as a Function of Initial Temperature in the Plug Flow Reactor for O/C=1 . . . . 69
Figure 4.7 Molar Concentration of Species along Time and along the Plug Flow Reac-tor for 500K Initial Temperature, O/C=1 and 10% of Initial Oxygen Dissoci-ated into Radicals 0 (3% molar fraction) . . . . 72
Figure 4.8 Temperature along Time and along the Plug Flow Reactor for 500K Initial Temperature, O/C= 1 and 10% of Initial Oxygen Dissociated into Radicals 0
(3% molar fraction) . . . . 73
Figure 4.9 Molar Composition of the Syngas at the Plasmatron Exit (4g/s and 30cm
long) as a Function of O/C Ratio using an Adiabatic Plug Flow Reactor
M odel (Tinitial=1,500K) . . . - - - - - 74 Figure 4.10 Figure 4.11 Figure 4.12 Figure 4.13 Figure 4.14 Figure 4.15 Figure 4.16 Figure 4.17
Ignition Delay Time at the Plasmatron as a Function of O/C Ratio
(Tini-tial= 1,500K) using an Adiabatic PFR Model . . . . 75
Steady Temperature in the Plasmatron as a Function of O/C Ratio
(Tini-tial=,500K) using an Adiabatic PFR Model . . . . 75
Molar Composition of the Syngas at the Plasmatron Exit (4g/s and 30cm long) as a Function of 02 Enrichment using an Adiabatic Plug Flow Reactor
Model (T=1,500K; O/C=I) . . . . 76
Hydrogen Molar Fraction at the Plasmatron Exit as a Function of Global
O/C ratio for Different Air Oxygen Enrichment, using a Two-stage
Combus-tion Model with 10% CH4 Precombusted . . . . 79
Hydrogen Molar Fraction at the Plasmatron Exit as a Function of Global
O/C ratio for Different Air Oxygen Enrichment, using a Two-stage
Combus-tion Model with 20% CH4 Precombusted . . . . 80
Hydrogen Molar Fraction at the Plasmatron Exit as a Function of Global
O/C ratio for Different Air Oxygen Enrichment, using a Two-stage
Combus-tion Model with 30% CH4 Precombusted . . . . 80
Heat of Combustion and Heat Loss through the Walls along a Non-Adiabatic
PFR with U=1050 W/m2K, Initial Temperature=2,000K and O/C=1.
Com-parison between Hydrogen Composition along the Reactor with Equal Oper-ating Conditions for an Adiabatic and a Non-Adiabatic System . . . . 82
Equilibrium Composition of Products of Conversion of Methane with Air
Figure 4.18 Molar Fraction along Time of Nitrogen-Based Species in a PFR for methane
combustion with O/C=1 and Tinitial=1,500K. Simulation using PLUG 84
Figure 4.19 Molar Fraction along Time of Nitrogen-Based Species in a PFR for methane
combustion with O/C= 1 and Tinitial=2,000K. Simulation using PLUG 85
Figure 5.1 PASR Exhaust Composition (Mass Fraction) for Methane Partial Oxidation
using Different O/C, tmix=O. Ims and tres=Ims, and setting 10% of the M olar Flow at 4,000K . . . 89
Figure 5.2 PASR Exhaust Composition (Mass Fraction) for Methane Partial Oxidation
using Different O/C, tmix=lms and tres=lms, and setting 10% of the Molar
Flow at 4,000K . . . . 89
Figure 5.3 PASR H2 Exhaust Composition (Mass Fraction) for Methane Partial
Oxida-tion using tres= 1 ms, O/C= 1 and Different tmix, setting 10% of the Molar
Flow at Different Initial Temperatures . . . . 90
Figure 5.4 PASR CO Exhaust Composition (Mass Fraction) for Methane Partial
Oxida-tion using tres=Ims, O/C=I and Different tmix, setting 10% of the Molar
Flow at Different Initial Temperatures . . . . 91
Figure 5.5 PASR H20 Exhaust Composition (Mass Fraction) for Methane Partial
Oxi-dation using tres= 1 ms, O/C= 1 and Different tmix, setting 10% of the Molar
Flow at Different Initial Temperatures . . . . 91
Figure 5.6 PASR H2 Exhaust Composition (Mass Fraction) for Methane Partial
Oxida-tion using tmix=0. 1 ms, tres= 1 ms, O/C= 1 and setting Different FracOxida-tions of the Molar Flow at Different Initial Temperatures . . . 93
Figure 5.7 PASR H20 Exhaust Composition (Mass Fraction) for Methane Partial
Oxi-dation using tmix=0. 1 ms, tres= 1 ms, O/C= 1 and setting Different Fractions
of the Molar Flow at Different Initial Temperatures . . . . 94
Figure 5.8 PASR CO Exhaust Composition (Mass Fraction) for Methane Partial
Oxida-tion using tmix=0. Ims, tres=lms, O/C=1 and setting Different FracOxida-tions of the Molar Flow at Different Initial Temperatures . . . 94
Figure 5.9 Power Required to Heat the Arc Volume (Experimentally Measured and
Simulations Calculated) to Different Temperatures . . . 96
Figure 6.1 Experimental Measured Composition at the Exhaust of the Discharge
Region as a Function of O/C ratios for Different Power Inputs (see next
fig-ure) . . . 105
Figure 6.2 Experimental Measured Composition at the Exhaust of the Discharge
Region as a Function of Power Inputs for Different O/C ratios (see previous
TABLE 2.1 TABLE 3.1 TABLE 3.2 TABLE 3.3 TABLE 4.1 TABLE 4.2 TABLE 4.3 TABLE 4.4 TABLE 5.1
Temperature Increase Estimation of the Gas Mixture Mass under the
Elec-tric Discharge Effect for two Different Arc Duration Times . . . . 35
Equilibrium Temperature and Molar Composition for Methane Oxidation
with O/C =1 and Different Initial Temperatures for Limited Species . 48
Equilibrium Temperature and Molar Composition for Methane Oxidation
with O/C =1 and Different Initial Temperatures for All Mechanism
Species . . . . 49
Turbulent Kinetic Energy from the Input Air and Fuel Stream Jets . . 55
Reaction Ignition Time (s) due to Radicals Presence . . . . 71
PLUG Molar Results and Initial Temperature at the Second Stage for Partial
Oxidation of Methane in a Two Stage Reactor using O/C =1.2 . . . . 78
PLUG Molar Results and Initial Temperature at the Second Stage for Partial
Oxidation of Methane in a Two Stage Reactor using O/C =1.4 . . . . 78
PLUG Molar Results and Initial Temperature at the Second Stage for Partial
Oxidation of Methane in a Two Stage Reactor using O/C =1.6 . . . . 79
Mass Fractions of Plasmatron Products at Exhaust of the Discharge Region and Power Supplied to the Discharge for PASR Simulations and
INTRODUCTION TO PLASMA FUEL
REFORMING
The technology for a plasma fuel reformer has been developed at the MIT Plasma Science and Fusion Center (PSFC). This specific device, also called a plasmatron, is the subject of study in this present thesis. Its posterior use and benefits onboard of engine-driven vehi-cles are briefly commented on as an introduction. An outline of the plasmatron
function-ing mode and the purpose of modelfunction-ing it are reported as well in this chapter.
1.1 Hydrogen benefits in Spark Ignition (SI) Internal
Combustion Engines (ICE)
Hydrogen gas (H2) is a small molecule with particular properties. Its size, its low density
and its rapid diffusivity confer it the ability to rapidly dissipate. As a direct consequence, hydrogen as fuel has a very high flame speed. When mixed with other fuels, helps increase flame speed and improve engine combustion stability as proved by [Tully, 2002]. Due to higher flame stability for fuel-hydrogen mixtures, the possibility for engines to run effec-tively ultra-lean arises, engines can burn mixtures with low fuel content without misfire. Running the engine ultra-lean provides several advantages. Lean operation means higher engine efficiency, lower combustion temperature and hence, important reduction in NOx emissions. An engine working with hydrogen addition can be redesigned to have a higher compression ratio and thus, higher efficiency can be achieved. Due to the higher heat capacity of the new mixture inside the cylinder, combustion reaches more moderate tem-peratures. When having lower combustion temperatures, the engine will produce less NOx, because nitric oxide formation is directly related to temperature conditions [Brom-berg, 2000].
However, mixing hydrogen with fuel in SI engines is not always feasible. One of the main
issues with H2 gas is the difficulty of handling and storage. Therefore, being able to
gener-ate hydrogen onboard of vehicles results in a positive solution for ICE use.
When burning any hydrocarbon (HG) in a combustor with low content in oxygen (02) or air, we say we are reforming the fuel. Instead of achieving complete combustion of the
hydrocarbon into water (H20) and carbon dioxide (CO2), we can ideally obtain a gas
mix-ture of hydrogen and carbon monoxide (CO). This mixmix-ture is often referred as synthesis gas mixture or syngas. The actual gas mixture that is produced in the plasmatron and routed to the ICE together with more gasoline is close to this ideal mixture.
The presence of CO in addition to pure hydrogen has been proved to be beneficial in
hydrogen-enhanced engines [Topinka, 2003]. The CO-H2 mixture helps inhibit knock by
slowing the autoignition reactions and by accelerating the flame speed (mainly due to H2
presence, as commented before). Carbon monoxide is a molecule with chemical energy
content that can be combusted into CO2 releasing heat and also be counted as a dilutant in
terms of lean operation.
The plasmatron is in fact a small combustor (20 cm to 30 cm long) that can be placed onboard. Besides, it requires low energy supply (200 W to 900 W power source) and it is directly feed by the same fuel used in the vehicle, producing syngas as it is required. In order to control the syngas diverted to the plasmatron, we need to understand how the device functions and responds to any change in conditions. Thus, a comprehensive model than can predict such behavior would be specially useful.
1.2 Objectives of modeling effort
A model is a representation of an object or device. Its main goal is to schematically
describe the system for its known or inferred properties for further study of its characteris-tics. For our particular system we required a simulation tool capable of reproducing the
behavior of the plasma fuel reformer or plasmatron. Once this first step is achieved, the same tool must be able to predict the plasmatron performance under different conditions.
The plasmatron is a combustor, i.e., a very specific type of chemical reactor. Knowing the geometrical characteristics of the same, we opted to use CHEMKIN to perform our mod-eling task. CHEMKIN is a software system for solving complex chemical kinetics prob-lems. The program consists of a collection of applications. Each application represents a different chemical reactor model. In particular we are interested in two types of reactors:
the Plug Flow Reactor (PFR or PLUG) and the Partially Stirred Reactor (PASR). We will
describe their particular characteristics in Chapter 3.
1.2.1 Study of device performance
The first step in the modeling process is the study of the object or device performance. Being the model of a real system, we are interested in the particular behavior of such item for a wide range of operation. Also, we need to understand the geometry and setup of the whole.
The researchers at the PSFC provided us with experimental data for different plasmatron tests using methane as fuel. They ran experiments varying input parameters such as air flow rate, oxygen content in air, fuel flow rate and oxygen to fuel flow ratio. They also supplied information about the geometry of the plasmatron, the energy supplied to the sys-tem, the number of streams entering the reactor and images of the arc plasma discharge.
All the various parameters and results will be described in detail in Chapter 2.
1.2.2 Prediction of behavior
The idea of having a faithful representation of the system is necessary to predict the plas-matron performance in a broad variety of conditions. The model is already based on a wide operation range.
o first, understand the physical and chemical behavior of the system,
- second, reproduce the experimental results,
- then, perform parametric variations,
- and finally, validate the model for predicted values.
When these four steps are completed, the model can be utilized: either to predict behaviors for different setups, or the opposite, to optimize setups to obtain desired behaviors.
In our particular case, only the first two steps were accomplished. We ran experiments/ simulations to check the modeling software. This allowed us to understand the correct use of CHEMKIN and its applications, since the source code was not available for viewing by the user. Next, we ran simulations to match the experimental results, using equal setups and conditions than those of the experiments. Because the simulation results only repro-duced the experimental results partially, no further steps were pursued.
1.3 Model description
In order to model the plasmatron, we first need to understand the main factors that have an influence in the reactor performance. To adapt the model to the real plasma reformer, we need to abstract specific domains. The experimental plasmatron was divided into sections to simplify the task of modeling.
1.3.1 Plasmatron design
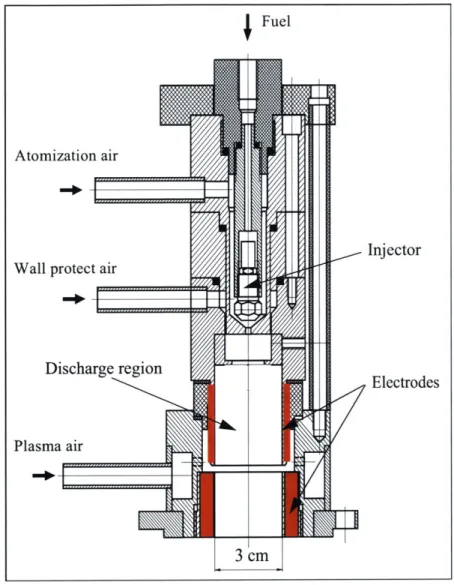
A simple schematic of the plasmatron fuel reformer is shown next in Figure 1.1. This
sketch represents the initial step in the reactor operation, where the electric discharge takes place and where combustion initiation occurs. Downstream of the plasma reactor (upper part of the drawing), there is an extension that allows reaction to complete (Reaction extension cylinder). The downstream section length and diameter may vary.
Figure 1.1 Sketch of the Plasmatron Design
As the plasmatron is still in development process and many different versions of it have
been tested along the course of this thesis work, we decided to concentrate on one specific
design, for which the largest amount of data using methane as fuel had been obtained.
We focussed our modeling effort on the plasmatron discharge region, putting less effort on
the chemical and mechanical processes that take place afterwards in the downstream
region. When any calculations in this thesis relate to the downstream section, it will be so
indicated. A more specific description of the plasmatron will be given in Chapter 2, since
the geometry and other characteristics of the device will be correlated to the experimental
results.
1.3.2 Thermodynamic, chemical and fluid dynamic models
The main factors to be described in the fuel reformer model are:
1. Thermodynamic behavior of the system.
2. Chemical behavior: equilibrium and kinetics.
3. Fluid dynamics within the reactor.
The thermodynamic properties define the state of the gaseous mixture. The behavior of each species under changes in pressure, temperature or heat transfer effects are determined based on a series of polynomial fits for each property. The arbitrary-order polynomials are formulated from their respective coefficients.
The chemical behavior of a process must be first explained by a global reaction. The spe-cies A is transformed into the spespe-cies B. Then, a kinetic mechanism, which is a collection of elementary reactions, describes all the intermediary steps that must be taken in order to convert A into B. Each global reaction can be described by many different kinetic mecha-nisms. Our job is to find which mechanism is the most suitable for our case. An indepen-dent elemental reaction within the kinetic mechanism is defined by:
- The species involved: reactants and products. - The rates of the forward and reverse reactions.
The various possible mechanism and its structure are further developed in Chapter 3. The fluid mechanics is a very important factor in a reactor. Evidently, the molecules of dif-ferent species must mix at the molecular level in order to react. The rate at which the spe-cies mix directly depends on the turbulent mixing process within the reactor, which depends on the turbulence intensity in it. Either computational fluid dynamics (CFD) cal-culations or laboratory experiments with the plasma reformer can be used to study the degree of mixing caused by the fluid motion into and within the reactor. The results of those studies are shown in Chapter 3.
1.3.3 Methane versus other fuels
As previously commented, the plasmatron is intended for use onboard of vehicles that mainly use SI engines. The hydrocarbon conducted through the fuel reformer in that case is gasoline. Gasoline is primarily a mixture of long chain paraffinic and aromatic hydro-carbons such as iso-octane and toluene. Combustion processes for such species have been studied, however, the chemical mechanisms that represent their oxidation are especially complex, e.g. [Curran, 1998] and [Curran, 2002]. In addition, rich combustion of gasoline is not as well known as stoichiometric or lean combustion. Thus, trying to simulate the plasma reformer with gasoline as fuel becomes an important challenge.
A simpler alternative could be the use of propane in the model, as it is the shortest
hydro-carbon molecule that illustrates most of the gasoline properties and behavior. But again, its rich combustion has not been extensively studied. The appropriate hydrocarbon partial
oxidation mechanism is yet to be developed.
A more straightforward approach is to model the rich combustion of methane, the smallest
possible hydrocarbon molecule. Its combustion process has been comprehensively stud-ied. However, methane behaves differently than gasoline. Its small size and symmetric structure give the molecule specific properties. It is a very stable molecule. At atmo-spheric temperatures, methane reacts so slowly with oxygen that it is considered unreac-tive. Ignition is more difficult with methane than with other hydrocarbons, since the first oxidation step, extraction of one H radical, takes about 40 kJ more. Anyhow, being the plasmatron able to run with this fuel, we decided to model the reformer burning methane on a first step.
PLASMATRON EXPERIMENTAL
RESULTS
A series of experiments carried out at the Plasma Science and Fusion Center (PSFC) using
methane as fuel are the basis for the plasmatron study and further modeling.
2.1 Plasmatron description
As seen in the previous chapter, the plasmatron is a complex device with several input
parameters. In this section we explore the reactor performance.
2.1.1 Geometry and input streams
Several versions or generations of the plasmatron have been developed within a short
period of time. We concentrated our measurements and tests to a single setup which is
schematically described in Figure 2.1.
The main reactor chamber consists of a cylinder shaped duct with two annular electrodes
(in red), one on the top, closer to the fuel injector, and one on the bottom, next to the
dow-stream reactor zone, both across from an air inlet ring. The chamber has a 3-cm inner
diameter and it is
6.5
cm long. The zone limited by the two electrodes is the discharge
zone and it comprises 6 cm in length, from the top of one electrode to the bottom of the
other one. Here is where combustion initiation takes place, primarily because of the
plasma generation by the electric discharge between electrodes.
The system has two main inlet streams: one for fuel and one for air, both at ambient
tem-perature. The reactor is fed by more than two inlets. Fuel is pressure-driven in through one
Figure 2.1 Drawing of the Plasmatron Design Tested
channel and is directly injected into the discharge region. On the other hand, there are
three different paths for the air to enter the plasmatron:
1. Premixed with the fuel, and injected into the center of the plasma region
(Atomization air).
2. Flowing next to the walls (Wall protect air).
3. Creating swirl in the discharge region (Plasma air).
Fuel
Injector
Therefore, when we account for air flow rate coming into the plasmatron, we are referring
to the sum of the three air streams. The fuel mass flow rate may oscillate between 0.5 g/s
and 1.0 g/s, while the air flow is measured in volumetric rate and it varies from 30 1/min to
250 1/s at standard conditions, which corresponds in mass rate to a range from 0.50 g/s to
3.50 g/s. These latter values are obtained from experimental data rather than from
molecu-lar gas correlation, since in some cases, the air flow input is a mixture of air and pure
oxy-gen.
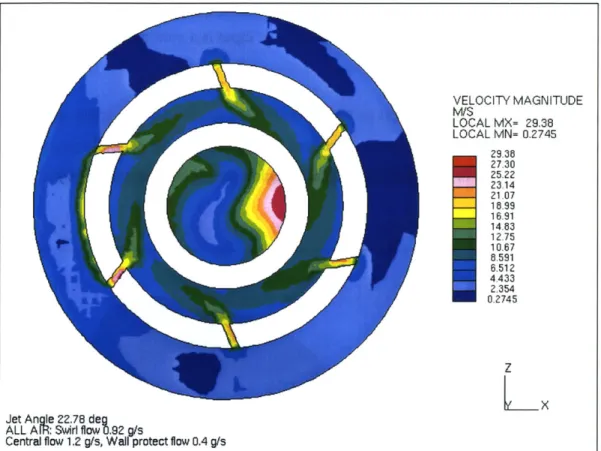
Figure 2.2 illustrates the different sections found in the reactor core: in green and yellow,
the plasma air distribution; in purple, the wall protect air and the centrally injected fuel
and atomization air; in red, the main discharge region and swirl generating pipes.
Figure 2.2 3-D Mesh used to Simulate the Fluid Dynamics in the Plasmatron using FLUENT: Wall
A cross-sectional image of the core reactor and the plasma air distribution perpendicular
to the vertical direction (y) is presented in Figure
2.3.
VELOCITY MAGNITUDE M/S LOCAL MX= 29.38 LOCAL MN= 0.2745 29.38 27.30 25.22 23.14 21.07 16.99 16.91 14.83 12.75 10.67 8.591 6.512 4.433 2.354 0.2745 Z LX
Jet Angle 22.78 deg
ALLA eR: Sw.rl .low 92 g/s
Central flow 1.2 g/s, Wall protect flow 0.4 g/s
Figure 2.3 View of the Discharge Zone of the Plasmatron along the Vertical Direction (Example of
Fluid Dynamics Calculation using FLUENT)
The uncolored rings correspond to the annular electrodes. The central circle represents the
flow from the injector and wall protect air, the inner ring corresponds to the discharge
zone where swirl is generated, and finally, the outer ring corresponds to the distribution
channel for the plasma air. The downstream region, usually wider than the plasma region,
is attached to the discharge region. It can operate with or without catalyst. The length is
not a fixed parameter, but it ranges from
25
to 30 cm.
2.1.2 Characteristics of the discharge
One critical aspect of the plasma fuel reformer is the arc discharge. Its characteristics, such
as energy supplied, current through the arc, frequency of the discharge and even shape and
length, are a useful source of knowledge. We try to obtain as much information as possible
from the study of the plasma arc in this section.
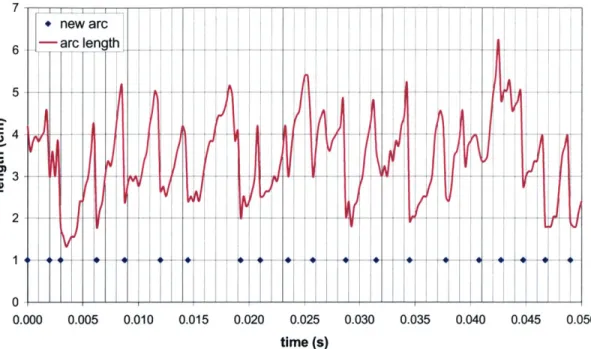
Discharge visualization
A useful way to examine the arc behavior is to look at the image that generates. Movies
contain information about flame size and shape, location, contact areas, as well as volume
and radius. Although the latter cannot be accurately measured from a 2-D image, they are
still of qualitative interest.
A series of movies were taken using a Redlake MASD monochrome high-speed video
camera, with up to 12,000 images per second framing capability. An example of arc
images in a sequence is shown in Figure 2.4. The picture is a view of the discharge in the y
direction from the plasmatron exit. When the pictures were taken, the plasmatron was
run-ning with only air, so the light seen is produced by the electric discharge. It is not
combus-tion related.
From Figure 2.4, we observe how the arc curls, grows and moves around the reactor
vol-ume from its start up to its end. The arc reappears with a certain frequency, measured to be
in average 350 Hz. The contact zone with the electrodes cannot be appreciated because it
happens to be an alternated current discharge.
The figure window size measures 4 cm. Using this scale, we estimated that the average
length of the arc is 3.5 cm, growing from 2 cm at start up to 5 cm before extinction (see
length of the arc measured along time in Figure 2.5). Pictures also showed that the
diame-ter of the arc ranges from 0.5 mm to 0.7 mm. That covers a total volume of 7x10-
9m
3to
lx10~8 m3 (7ptl-10pl). It is important to note that all this information was obtained from a
time = 0.0 ms (new arc)
time = 0.4 ms
time = 2.0 ms (new arc)
time = 2.2 ms
time = 0.8 ms
time = 2.4 ms
time = 1.2 ms
time = 1.6 ms
time = 2.6 ms
time = 2.8 ms (new arc)
Figure 2.4 View of the Discharge Region along the y Direction from the Plasmatron Exit. The Sequence of Images along Time includes Two Complete Discharges and a Third Arc Initiation
7 + new arc 6 -arc ength 5 --4 - ---0 0.000 0.005 0.010 0.015 0.020 0.025 0.030 0.035 0.040 0.045 0.050 time (s)
Figure 2.5 Characterization of the Length and Duration of the Arc of the Plasmatron with a 600-W Power Supply
the distance between electrodes and assuming that the arc is confined between those, we can state the following:
- the average length of the arc must be larger than the distance between elec-trodes,
" the curves and wider parts of the arc represent the arc traveling in the y
(ver-tical) direction, which we accounted for twice as much as the thinner ones.
The movies besides evidenced that the discharge was restarting approximately every 3 ms,
being the apparent frequency of strike equal to 350 Hz (see dots in Figure 2.5). The
dis-charge duration is found to be similar to the residence time of the reactor. Electrical characterization
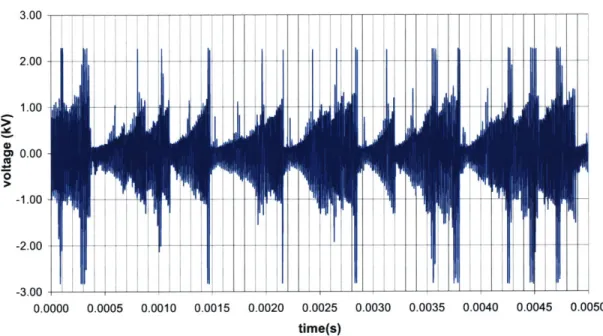
Simultaneous to the image taking moment, measurements of the current and voltage traces
2.7 show the actual current and voltage traces measured, while Figure 2.8 represents the
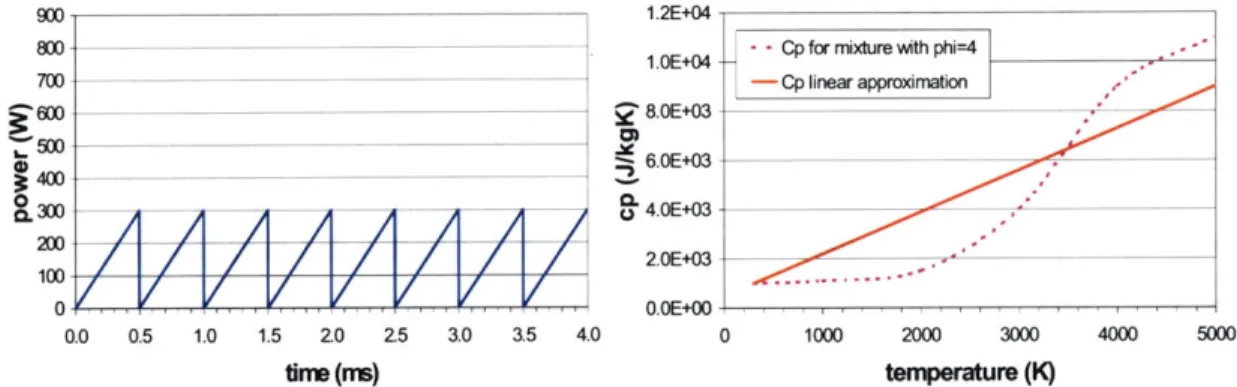
equivalent instantaneous power P, result of the current I and voltage V product:
P=IxV
(2.1)
3.00 2.00 1.00 CD 0.00 0 -1.00 -2.00 0.0000 0.0005 0.0010 0.0015 0.0020 0.0025 0.0030 0.0035 0.0040 0.0045 0.0050 time(s)Figure 2.6 Arc Voltage Trace along Time Measured for the running Plasmatron with a 600-W Power Supply
Although we may observe random high peaks in the instantaneous power estimation, the
average instantaneous power supplied to the arc is equivalent to 200 W. From the voltage
and current traces we draw a new apparent frequency for the arc strike. On average, every
0.5 ms the power drops and immediately reappears, which is a different frequency for the
arc strike than the visually observed discharge frequency. The power-measured frequency
is considered to correspond to the breakdown of the arc and its posterior new formation,
while the visual-measured frequency is assumed to be correlated to the residence time of
high temperature gas mixture within the arc discharge region.
3.00 2.00 1.00 0.00 -1.00 -2.00--- ---3.00 0.0000 0.0005 0.0010 0.0015 0.0020 0.0025 0.0030 0.0035 0.0040 0.0045 0.0050 time (s)
Figure 2.7 Arc Current Trace along Time Measured for the running Plasmatron with a 600-W Power
Supply 2000-1500 ---1000 -500 0 C. 0 -500--10007 0.0000 0.0005 0.0010 0.0015 0.0020 0.0025 0.0030 0.0035 0.0040 0.0045 0.0050 time (s)
Figure 2.8 Arc Instantaneous Power Calculated from the Measured Voltage and Current Traces with a 600-W Power Supply
The plasmatron functions with an alternate current (AC) power supply whose power ranges from 200 W to 900 W. The frequency of the power supply is 200 kHz and the volt-age varies between 0.6 kV and 0.7 kV. From current and voltvolt-age traces measured with the oscilloscope when using a power supply of 600 W, we were able to integrate the amount of energy that was delivered through the are discharge per second. The average current was 0.40 A and the average voltage, 0.62 kV, which gives us a total mean power of 250 W. This indicates that the power supply system is not ideal, and that it has an approximate delivery efficiency of 50%, since less than 50% of the available power is driven into the arc. In addition, only a fraction of the power supplied to the arc is transmitted to the gas mixture. For arc discharges, the total loss to the electrodes due mainly to dissipation in sheaths is estimated to be 50% [Heywood, 1988]. This adds up to a total of 75% energy loss from the power supply to the gas mixture (equivalent to an efficiency of 25%). In con-clusion, the real power dissipated in the discharge must be about 150 W.
From the real power input in the system P, we can determine the amount of energy dissi-pated E per second within the arc discharge which is converted into thermal energy
Q.
An ohmic heating process is assumed. This process produces a differential temperature increase dT on a specific mass m for each time differential dt. The equation that represents this energy conservation process is:dQ I dT
P = =m xc, x
dt
CPdt
(2.2)
which is derived from the first law of thermodynamics at constant pressure. For that rea-son, we work with the heat capacity of the mixture c, at constant pressure as a function of temperature T only. The calculation can be completed through multiple ways, depending on the hypothesis for time r, mass m or real power P implied on each case. The discharge energy E to be converted into thermal energy
Q,
may be estimated using the equation:where I is the current through the arc, V the voltage difference and rq the efficiency of the electrodes, previously estimated to be 50%. The integration must be over a time r which is
still undetermined. Then, using Equations 2.2 and 2.3 we can draw the expression:
i x I x V x dt = m x c, x dT (2.4)
Using Equation 2.4 eliminates the uncertainty about the real power P supplied to the arc. However, we still need to make assumptions for r and m. Instead of working with mass, we rewrote Equation 2.4 as:
q xIx Vxdt = pxvxcpxdT (2.5)
From the discharge visual study in Section 2.1.2, we concluded that the arc volume v
var-ies from 7x10⁻⁹ m3 at formation to x 10-8 m3 at extinction. Density p may be estimated
using the equation of state of an ideal gas:
p x MW
(2.6)
where the pressure of the system p is atmospheric, R is the constant of ideal gases, and MW is the molecular weight of the gas mixture.
Equation 2.5 must be integrated over -c, the time during which the power is supplied. We estimated the discharge duration is in average equal to 0.5 ms, as observed from the volt-age and current traces. But we also observed, from discharge visualizations, that the arc extinguishes every 3 ms, which is of the order of the reactor residence time. Whether we use the residence time or the arc duration for r, the hypothesis will procure very different results. The first hypothesis assumes that the arc is almost continuos and is heating the same mass of gas for the total amount of time this mass is inside the reactor (residence time). The second hypothesis assumes that the power is supplied through the discharge
only for a certain period that corresponds to the duration of the arc (from its formation to
its breakdown).
To integrate Equation
2.5
we have already specified the variables that are constant: the
electrodes efficiency, the pressure in the reactor and the ideal gas constant. The remaining
involved variables are dependant on either time or temperature as follow:
-
o
-F
77LV7F7F7
IV
V V
-I-V
I
0.0 0.5 1.0 1.5 20 25 3.0 3.5 4.0
time (nms)
Figure 2.9 Power Supplied to the Gas Mixture under the Arc along Time
0 1 2 3 4 5
time (ms)
Figure 2.11 Volume of the Arc along Time
8.OE+03 6.OE+03 4.OE+03 0.OEtOO 0 1000 2000 3000 4000 5000 temperature (K)
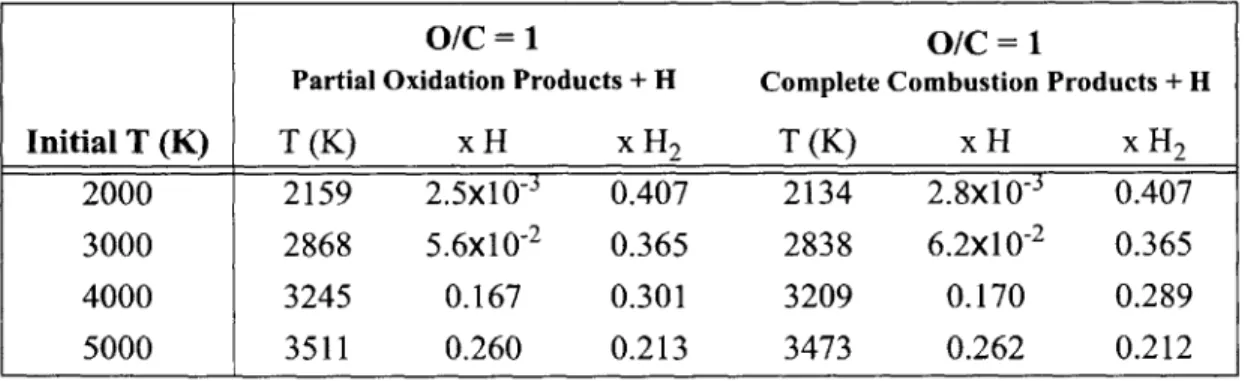
Figure 2.10 Heat Capacity of the Gas Mixture under the Arc as a Function of Temperature and Corresponding Used Linear Approximation
E E 6 30 20 10 - - -5 0, 0 1000 2000 3000 4000 50( temperature (K)
Figure 2.12 Molecular Weight of the Gas Mix-ture under the Arc as a Function of TemperaMix-ture
For each time interval of integration, the power supplied and the volume of the arc were
assumed to be constant and equal to their averages 200 W and 9x10⁻⁹ m3respectively. The
800 700 Z500
~4W
10 200 2.OE-08 1.8E-08 1.6E-08 1.4E-08 1.2E-08 1.OE-08 8.OE-09 6.OE-09 4.OE-09 2.OE-09 0.OE+00 0 E e (U 00molecular weight was assumed to be constant and equal to 17 g/mol, and the heat capacity
function for the gas mixture was substituted by a linear correlation of type c, = a + bT
Based on these assumptions, Equation 2.5 became:
M x
MWdT =
fqx IxVx
RdtT
vxp(2.7)
An analytical integration of Equation 2.7 is now possible and gives:
rixIx VxR (Tnal ±
MWxvxp
xTi=nti+ b(Tfinal Tinitia)(2.8)
Iterating for the final temperature (the initial temperature is set to 300 K) provides us with the temperature increase of the arc due to ohmic heating by the discharge. Schematically shown in Table 2.1, we obtain two different levels of gas mixture temperature rise for each one of the arc duration times determined t=At. When assuming the energy release heats up only the arc contained mass during a period equal to the discharge duration, the tempera-ture increase estimation is of the order of 3,000 K. However, if we consider that the dis-charge is almost continuous and affects the mass comprised inside the total volume of the arc for a period equal to its residence time in the reactor, then the temperature rise is of the
order of 13,000 K.
TABLE 2.1 Temperature Increase Estimation of the Gas Mixture Mass under the Electric Discharge Effect for two Different Arc Duration Times
Residence Arc
Time Duration
Arc duration time (s) 0.003 0.0005
Arc volume (m3) 9x10⁻⁹ 9X10⁻⁹
Efficiency x Power (W) 150 150
So distant numbers are caused by the lack of knowledge on the time during which the gas mixture is affected by the same current discharge. [Pischinger, 1989] states that in the arc discharge breakdown phase, a small amount of plasma is generated, such that its peak tem-perature reaches 60,000 K. This will initiate combustion, that will afterwards continue even if the spark is extinguished. His value is higher than our estimates. Pischinger worked with spark plugs of different characteristics. However, the initiation and propaga-tion processes of combuspropaga-tion are thought to be the same. Note also that these initially very high temperatures at the discharge core rapidly decrease due to thermal conduction and dissipation [Thiele, 2002].
Our calculations suggest that the temperature increase due to dissipation within the elec-tric arc lies somewhere in between 3,000 K and 13,000 K. It is unreal to assure that all power is transformed into thermal energy. The discharge generates plasma, and therefore, part of the dissipated electric energy is used to ionize the gas (breaking up molecular bonds) at the same time that is heating it up. From [Suris, 1985] we found that between
2 kWh/m3 and 8 kWh/m3 are necessary to heat up to 5,000 K and dissociate any two-atom
molecule of gas. Then, considering that the plasmatron arc volume varies between
7x10⁻⁹ m3 and 1x10⁻⁸ M3, we calculated that we need from 0.1 J to 0.3 J to generate plasma and raise the temperature of the arc to 5,000 K. The plasmatron electric discharge contains between 0.1 J and 0.6 J of available energy, depending on which time interval is used for a 200-W power release: residence time or arc duration time. It is thus plausible to have the discharge energy to be converted into both thermal energy (ohmic heating) and chemical energy (dissociation), since we are dealing with the same order of magnitude power densi-ties.
2.2
Performance of the plasmatron
When producing experimental data with the plasmatron, a series of measurement struc-tured on a table are generated. For each run, the following type of data is taken and noted:
- power input,
- opacity in the reactor,
- temperature at sample points,
- composition at sample points.
From these measurements, other interesting values can be computed:
- the rate of moles of each species entering and exiting the plasmatron,
- the O/C ratio, which is the number of atoms of oxygen going in, divided by
the number of carbon atoms,
- the conversion efficiency of the system,
- the energy conversion.
The composition of the flow, at different points of the reactor was sampled using a gas
chromatograph (GC) Hewlett Packard Micro GC model M200 11. Since the column is set
up for non-polar species, such device does not accept polar substances in the samples, so
the first step consists of removing water from the sampled flow. Therefore, no water
mea-surement can be directly performed. Other various comments, such as catalyst
informa-tion, characteristics of the flow or soot formainforma-tion, are also reported for each experiment
run.
Since the measurements were taken using a GC equipped with an apolar gas
chromato-graph column, it was necessary to convert all experimental results from a dry basis to a
wet basis. We implemented an elements balance (C, H and 0) based on the measured
com-position results. First, we checked that the carbon balance was satisfied. Then, we used the
H balance to estimate the amount of water (H
20)that must be present. Finally, we
matched the amount of oxygen present in the calculated water with the global balance of
the 0 atom. The calculated difference resulted in an average relative error of less than
5%.
In Figures 2.13 to 2.16, the exact results obtained from the GC are shown as measured
along the plasmatron in a molar dry basis. Next we used the species balance to estimate
the amount of water present in each sample.
35.0 30.0 25.0 =20.0 U 05. E 10.0 5.0 0.0 0 2 4 6 8 10 length (in) 12 14 16 18
Figure 2.13 Molar Composition of the Gas Mixture along the Plasmatron for Methane Partial Oxida-tion with O/C = 1.01, 23% 02 Enrichment in Air and a 700-W Power Supply (Dry Basis)
0 2 4 6 8 10
length (in)
12 14 16 18
Figure 2.14 Molar Composition of the Gas Mixture along the Plasmatron for Methane Partial Oxida-tion with O/C = 1.06, 23% 02 Enrichment in Air and a 700-W Power Supply (Dry Basis)
*H2 A02 ACH4 NCO *C02 xC2H4
A AA A A - -A
~
-C 0 0 E 35.0 30.0 25.0 20.0 15.0 10.0 5.0 0.0 AA+H2 A02 A CH4 .CO 0 CO2 xC2H4
--
35.0 30.0 25.0 0 20.0 15.0
E
10.0 5.0 0n 0 2 4 6 8 10 12 14 16 18 length (in)Figure 2.15 Molar Composition of the Gas Mixture along the Plasmatron for Methane Partial Oxida-tion with O/C = 1.11, 23% 02 Enrichment in Air and a 700-W Power Supply (Dry Basis)
Figures 2.16, 2.17 and 2.18 show the molar composition in wet basis of the gas mixture
for combustion of methane at different O/C ratios. Water molar fraction represents between a 10% and a 15% of the gas mixture composition, which is a significant fraction
of the hydrogen.
From this graphs we can observe that the maximum hydrogen yield is as low as 6%-7%. At this conditions, most of the methane is not combusted (about 15% or more remains). In
fact, almost 5% oxygen remains unreacted. This could be explained by poor mixing in the
reactor. If that is the case, we could have zones in which the O/C ratio for the gas mixture
is not equal to the global one, but lower or in some cases much higher. Consequently, we
would be dealing with local lean mixtures that allow part of the oxygen to go through.
High temperatures at the exhaust of the plasma region (over 1,200 K) may indicate than
even higher temperatures are achieved at the combustion core, however complete methane conversion does not occur. This may also be considered as an indirect indicator of inade-quate local mixing, since some regions are thought to be at higher temperature than others.
*H2 A02 ACH4 NCO 9 C02 xC2H4
A A
M
0 0 *J E 45.0 40.0 35.0 30.0 25.0 20.0 15.0 10.0 5.0 0.0 0 2 4 6 8 10 12 14 16 18 length (in)
Figure 2.16 Molar Composition of the Gas Mixture along the Plasmatron for Methane Partial
Oxida-tion with O/C = 1.01, 23% 02 Enrichment in Air and a 700-W Power Supply (Wet Basis)
It is known that all light alkanes homogeneously pyrolyze around 1,000 K. Nevertheless,
methane is the least reactive and has a conversion time of hours at such temperatures, thus
the only cause of methane conversion at our conditions must be driven by oxidation.
In Figures 2.19 to 2.24 we present a series of experiments in which only one gas sample at
the exhaust of the discharge region was taken. The results are presented as separate plots
for each measured species. In addition, mole fractions were converted to mass fractions, to
simplify subsequent comparisons between the experimental results and the model
solu-tions. Figure 2.24 shows the methane conversion experienced through the plasma
reformer.
*H2 *H20 A02 ACH4 ECO eC02 C2H4
AT
A
-
0 2 4 6 8 10
length (in)
12 14 16 18
Figure 2.17 Molar Composition of the Gas Mixture along the Plasmatron for Methane Partial Oxida-tion with O/C = 1.06, 23% 02 Enrichment in Air and a 700-W Power Supply (Wet Basis)
0 2 4 6 8 10
length (in)
12 14 16 18
Figure 2.18 Molar Composition of the Gas Mixture along the Plasmatron for Methane Partial Oxida-tion with O/C = 1.11, 23% 02 Enrichment in Air and a 700-W Power Supply (Wet Basis) r_ 0 E 45.0 40.0 35.0 30.0 25.0 20.0 15.0 10.0 5.0 0.0
A *H2 3H20 A02 ACH4 NCO *C02 C2H4
- -A4 A A A A ---ia _ _ _ _ _ _ _ _ _ _ _ _ _ _ A -.2 75 E 50.0 45.0 40.0 35.0 30.0 25.0 20.0 15.0 10.0 5.0 0.0
*H2 mH20 A02 ACH4 NCO 0C02 C2H4
A 2
1.15 1.20 1.25 1.30 0/C ratio 3.0 2.5 2.0 1.5 1.0 0.5 0n
Figure 2.19 Experimental Hydrogen Production Measured at the Exhaust of the Discharge Region as a Function of O/C ratio for Different 02 Air Enrichment of Methane Partial Oxidation (Mass Fraction)
0 E 30.0 25.0 20.0 5.0 |i 10.0 -5.0 0 n 1.15 1.20 1.25 1.30 0/C ratio 1.35 1.40 1.45 1.50
Figure 2.20 Experimental Water Production Measured at the Exhaust of the Discharge Region as a Function of O/C ratio for Different 02 Air Enrichment of Methane Partial Oxidation (Mass Fraction)
1.35 1.40 1.45 C 0 E -~l 02 enrichment * 28% * 38% L* 48% 1.10 1.50 02 enrichment + + 28% * 38% * 48% * ** 1.10 1
25.0 20.0 15.0 10.0 5.0 0.0
4--1.10 1.15 1.20 1.25 1.30 1.35 1.40 1.45 1.50 O/C ratio
Figure 2.21 Experimental CO Production Measured at the Exhaust of the Discharge Region as a Func-tion of O/C ratio for Different 02 Air Enrichment of Methane Partial OxidaFunc-tion (Mass FracFunc-tion)
20.0 20.0 15.0 10.0 5.0 0.0 1.10 1.15 1.20 1.25 1.30 O/C ratio 1.35 1.40 1.45 1.50
Figure 2.22 Experimental CO2 Production Measured at the Exhaust of the Discharge Region as a
Function of O/C ratio for Different 02 Air Enrichment of Methane Partial Oxidation (Mass Fraction) .2 E -- 9 02 enrichment _______+ 28% +38% +48% C .2*0 (U E 02 enrichment S28% + 38% +48%
20.0 18.0 16.0 14.0 12.0 10.0 8.0 6.0 4.0 2.0 0.0 1 1.35 1.40 1.45 1.50
Figure 2.23 Experimental Methane Composition Measured at the Exhaust of the Discharge Region as a Function of O/C ratio for Different 02 Air Enrichment of Methane Partial Oxidation (Mass Fraction)
1.25 1.30 O/C ratio
1.35 1.40 1.45 1.50
Figure 2.24 Experimental Methane Conversion at the Exhaust of the Discharge Region as a Function of O/C ratio for Different 02 Air Enrichment of Methane Partial Oxidation
r-0 M EU
E
1.15 1.20 1.25 1.30 O/C ratio -9 02 enrichment * 28% + 38% + +.+ 48% , 9 .10 9--* 02 enrichment +-28%1 +38% +48% - --.2 0 0 90.0 80.0 70.0 60.0 50.0 40.0 30.0 20.0 10.0 0.0 1.10 1.15 1.20Working on a mole fraction basis, the mayor species concentrations at the discharge exhaust are: - Hydrogen: 6% - 7% - Water: 10% - 15% - Carbon monoxide: 4% -6% - Carbon dioxide: 3% -4% - Methane: 15% -20% - Other hydrocarbons: ~ 1%
When converted to a mass fraction basis, those result:
- Hydrogen: 1.0% - 2.5% - Water: 10% - 15% - Carbon monoxide: 10% -20% - Carbon dioxide: 5% - 7% - Methane: 4% -10% e Other hydrocarbons: ~ 1%