Genotyping faeces reveals facultative kin association on capercaillie’s leks
Se´bastien Regnaut
1,*, Philippe Christe
2, Michel Chapuisat
2& Luca Fumagalli
11
Laboratory for Conservation Biology, Department of Ecology and Evolution, Biophore, University of Lausanne, Lausanne, CH-1015, Switzerland;2Department of Ecology and Evolution, Biophore, University of Lausanne, Lausanne, CH-1015, Switzerland
(*Corresponding author: Phone: +41-21-6924172; Fax: +41-21-6924165; E-mail: sregnaut@excite.com)
Received 13 May 2005; accepted 7 November 2005
Key words: capercaillie, genetic structure, lek mating system, non-invasive sampling, microsatellites, relatedness
Abstract
The role that kin selection might play in the evolution of lekking in birds remains controversial. Recent molecular data suggest that males displaying on leks are related. Here we investigated the genetic structure and pattern of relatedness on leks of a declining population of capercaillie (Tetrao urogallus) using microsatellite genetic markers. Since the species is highly sensitive to disturbance, we adopted a non-invasive method by using faecal samples collected in the field. Based on a dataset of 50 males distributed in 6 sub-populations, we found significant genetic structuring among sub-populations, and a significant pattern of isolation by distance among leks. Estimates of relatedness showed that males displaying on the same lek were related, even when controlling for the effects of genetical differentiation among sub-popu-lations. In addition, the frequency distribution of relatedness values indicated that leks contain a mixture of close kin and unrelated individuals (34 and 66%, respectively). This pattern is consistent with the hypothesis that leks often contain kin associations, which might be due to very restricted dispersal of some of the males or to joint dispersal of kin. The results are discussed with respect to their implication for the conservation of endangered populations.
Introduction
The evolution of lekking as a mating system remains a puzzling issue and a debated question in sexual selection theories (Andersson 1995; Hogl-und 2003). Leks are patches of territories on which males gather together during the mating season, and display with a ritualized courtship in order to attract females. Females mate preferentially with dominant males, resulting in a potential skew in males reproductive success (Fiske et al. 1998). Until recently, direct fitness benefits and competi-tion among males have been considered to be the main factors driving the evolution of lek mating. However, because females usually prefer to mate in larger male aggregations rather than in small
leks, it has been proposed that low-rank males could enhance their inclusive fitness by increasing lek size of related high-rank males (Kokko and Lindstro¨m 1996). Indeed, the idea that kin selec-tion could play an important role in the evoluselec-tion and maintenance of lekking has received empirical supports from at least four bird species. Male peacocks (Pavo cristatus) were more closely related to other males within the same lek than to males in other leks (Petrie et al. 1999). Similarly, molecular data on lekking black grouse (Tetrao tetrix) (Hoglund et al. 1999), lesser prairie-chicken (Tympanuchus pallidicinctus) (Bouzat and Johnson 2004) and white-bearded manakin (Manacus manacus) (Shorey et al. 2000) have revealed that relatedness was high among males sharing the
same lek. However, genetic similarity between males on leks may also result from limited male dispersal (philopatry) independently from kin selection (Hoglund 2003).
Lekking strategy and kin structures can have important consequences for conservation. Indeed, if the mating success is highly skewed towards a small number of males in the lek, effective popu-lation size (Ne) is expected to decrease, amplifying
stochastic genetic processes such as drift. More-over, kin association on leks might increase the level of inbreeding. The resulting loss of genetic diversity in small and fragmented populations of threatened species is then expected to reduce the ability to evolve and thus to increase extinction risks due to environmental changes (Frankham et al. 2002). In this context, Møller (2003) emphasized the importance of including sex when theoretically studying extinction risks in conser-vation biology.
Capercaillie (Tetrao urogallus), the largest European grouse, occurs in boreal or mountain forests. The species has highly specific habitat requirements, such as the presence of coniferous trees, open structures with moderate canopy cover and rich ground vegetation. In winter, capercaillies are arboreal and feed on coniferous needles, whereas in spring and summer they live on the ground and feed on leaves, seeds and fruits. Direct observations and telemetry suggest that most individuals, and particularly males, do not disperse far (Storch 1995; Storch and Segelbacher 2000). Populations of western and central Europe have shown a strong decline during the last decades, owing to habitat losses, habitat fragmentation and human disturbance (Storch 2000). The relict Jura population is dis-tributed over ca. 550 km2 in France and Swit-zerland, and is thought to contain approximately 500 breeding adults, with a balanced sex-ratio (Sachot 2002).
The aim of the present study was to investigate the genetic structure within and between leks of this declining population of capercaillie, as well as to investigate if males on leks cluster preferentially with kins. Because capercaillies are particularly sensitive to human disturbance and because the population of the Swiss and French Jura moun-tains has drastically declined since 20 years (Sachot et al. 2002), we used a non-invasive ap-proach based on the genotyping of faeces.
Material and methods Sampling
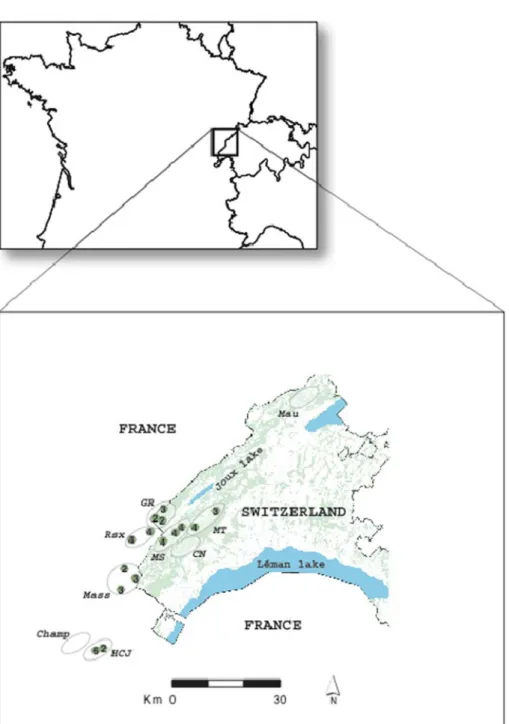
The study was conducted across the south-western portion of the Swiss and French Jura Mountains (Figure1). We collected capercaillie faecal samples under deciduous and fir trees where individuals spend the night or feed, and also in 15 lek sites precisely identified by field observations during the breeding season (faeces from lekking birds were collected immediately after they had left the leks in the morning). The average distance among leks was 17±12 km. The samples were distributed among nine discrete sub-populations defined as continuous patches of suitable habitat and deter-mined by habitat suitability analysis (Sachot and Perrin 2004), of which six contained the lek sites (Figure 1 and Table 1). Faeces were individually dried in vials containing silica gel beads, and processed in a separated laboratory dedicated to low-content DNA samples.
Faecal samples DNA extraction and genotyping We extracted DNA from 340 faecal samples. DNA extraction was performed with the QIAamp Stool kit (QIAGEN), using an optimized protocol (Regnaut et al. in press). We amplified 11 micro-satellite loci, 7 of which had been specifically designed for capercaillie (Segelbacher et al. 2000) and 4 for the black grouse T. tetrix (Caizergues et al. 2001). We monitored DNA contamination by adding negative controls in both the extraction and amplification experiments. Amplification products were visualized using an ABI377 auto-mated sequencer (Applied Biosystems). In order to minimize genotyping errors due to the analysis of non-invasive samples with low or degraded DNA content (i.e. allelic dropout, false alleles), we adopted a multitube approach (Taberlet et al. 1996). Heterozygous individuals were genotyped twice and homozygous four times. Based on measures of allelic dropout and false alleles rates, using computer simulations with the software Gemini (Valie`re et al. 2002) we estimated the reliability of the genotyping procedure to be as high as 98% with five genotyping repetitions. Probabilities of identity at the 11 loci were low enough to assume that levels of chance matches were negligible, thus allowing for individual
identification (details in Regnaut et al. (in press)). In addition, genotypes differing by only one allele were considered as belonging to the same indi-vidual. Sex was determined by a PCR-based method adapted from Fridolfsson and Ellegren (1999). Two replicate PCRs were carried out for
each sample which was scored as male (one single band). Results of molecular sexing were also con-firmed by morphological criteria (stool size; see Leclercq 1987). Detailed protocols of all molecular analyses and feasibility assessment are given in Regnaut et al. (in press).
Figure 1. Sampling area and location of sub-populations and leks. Ovals correspond to the nine studied sub-populations (codes as in Table 1); small circles correspond to leks with number of lekking males.
Genetic data analysis
Gene diversities (heterozygosities), deviation from random mating within populations (Fis) per locus and sample and deviation from Hardy Weinberg Equilibrium (HWE) within samples were esti-mated and tested for significance with FSTAT 2.9.3.2 (Goudet 1995). Population genetic struc-ture was investigated with a hierarchical analysis of variance, using the FSTAT software. Nei’s distances D (1978) were computed with the GE-NETIX software (Belkhir et al. 1996–2004). The significance of the correlation between geographi-cal distance and Nei’s genetic distance was tested with a Mantel test using FSTAT.
We measured the relatedness (r) among males lekking together using the software RELATED-NESS 5.0 (Queller and Goodnight 1989), first with respect to the allele frequencies in the whole pop-ulation as a reference (the 238 males and females; see below), and second with respect to the allele frequencies in each local sub-population (males and females). The 95% confidence intervals (CI) were obtained by jackknifing over loci.
To estimate pairwise relatedness among males in the same lek we used the software KINSHIP (Goodnight and Queller1999). We also obtained the distribution of relatedness values for expected relationships by simulating 5000 pairs of unrelated or full-sib individuals, respectively, drawn from a population with the observed microsatellite allelic frequencies. In addition, we used a likelihood ap-proach to determine which distribution of two relatedness classes best fitted the observed distri-bution.
Results
Population genetic structure
The number of alleles per locus ranged from 3 to 17 (average=9), with a total of 101 alleles across 11 loci. Expected heterozygosities per locus within sub-populations (Hs) ranged from 0.28 to 0.745, with an average of 0.55. Randomization tests indicated that eight loci were at HWE, two loci had an heterozygous deficit and one locus had a heterozygous excess. We repeated all analyses without the three loci which deviated from HWE, which returned qualitatively similar results and did not affect the conclusions. In order to exploit all available information, we present here the results obtained with 11 loci. Expected overall heterozy-gosity (Ht) averaged 0.57 (range per locus: 0.29– 0.78). Observed heterozygosity (Ho) ranged from 0.28 to 0.73, with an average of 0.535. There was evidence for significant deviation from random mating in none of the nine sub-populations (global Fis=0.019). Fstamong sub-populations was 0.033
over all loci, a value significantly greater than zero when randomising genotypes among sub-popula-tions (P<0.001).
Two hundred and thirty eight unique genotypes were scored throughout the whole sample set, of which 65% were genotyped as males, 29% as fe-males and 6% as unknown (possibly due to DNA degradation; Table1). The sex ratio was strongly male biased in the data set. We suggest that this is an effect of sampling, since collecting faeces on leks offers more opportunities to collect male samples, and since other counting methods did not
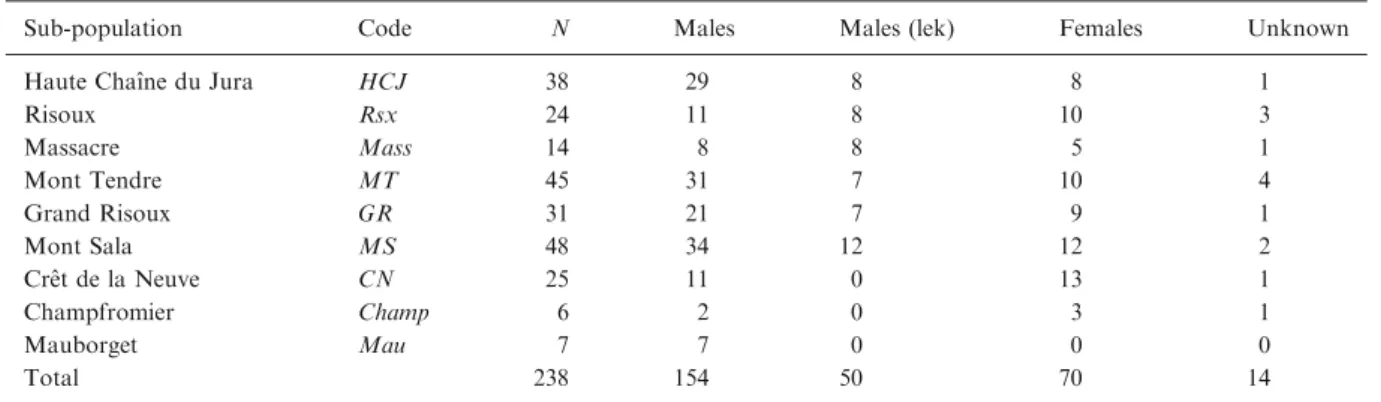
Table 1.List of sub-populations and samples of T. urogallus analyzed in the present study
Sub-population Code N Males Males (lek) Females Unknown
Haute Chaıˆne du Jura HCJ 38 29 8 8 1
Risoux Rsx 24 11 8 10 3 Massacre Mass 14 8 8 5 1 Mont Tendre MT 45 31 7 10 4 Grand Risoux GR 31 21 7 9 1 Mont Sala MS 48 34 12 12 2 Creˆt de la Neuve CN 25 11 0 13 1 Champfromier Champ 6 2 0 3 1 Mauborget Mau 7 7 0 0 0 Total 238 154 50 70 14
N: nr. of samples; Males: nr. of males; Males (lek): nr. of males within lek; Females: nr. of females; Unknown: nr. of samples for which sex has not been identified.
reveal unbalanced sex ratio in this population (Leclercq 2004). The male dataset consisted of 50 individuals in 15 leks within 6 sub-populations (see Figure 1; mean number of males ± SE within leks=3.3±1.1), 84 males distributed outside leks in these 6 sub-populations, and 20 males within 3 sub-populations with no clear lek structure.
Isolation by distance
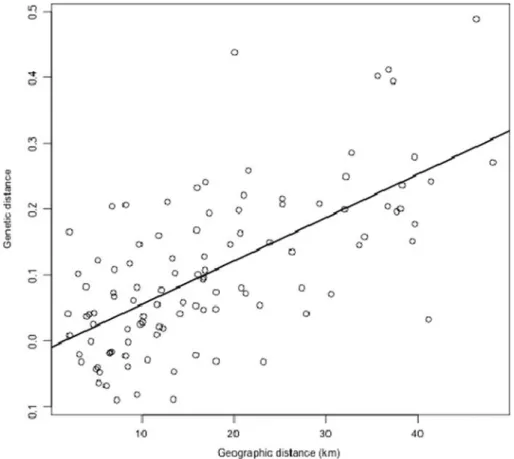
Isolation by distance was inferred from the dataset of 50 males in 15 lek sites. A pattern of isolation by distance was detected among leks, as shown by the significant correlation between Nei’s genetic dis-tance and geographic disdis-tance (r2=0.43, P<0.001, Mantel test with 20,000 randomizations; Figure 2).
Relatedness among males on leks
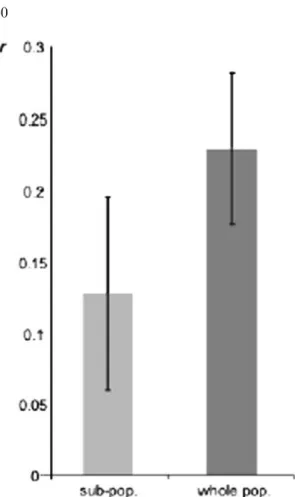
The relatedness among males sampled on the same lek was as high as 0.22 when measured with respect
to the entire population (the 238 males and fe-males, Figure 3). This value decreased to 0.12 when the relatedness was measured with respect to the neighbouring sub-populations, thus control-ling for the effect of genetic differentiation among sub-populations (Figure 3). Both values were sig-nificant, as shown by the 95% CI that do not overlap with zero.
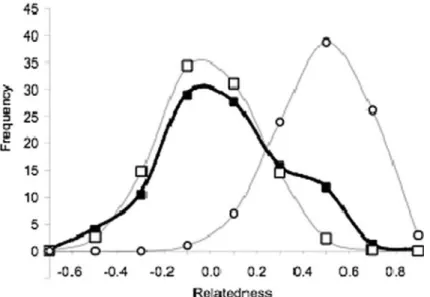
Within sub-populations, the pairwise related-ness between males on the same lek ranged from )0.45 to 0.62 (Figure4). Interestingly, the fre-quency distribution of relatedness values suggests a combination of two underlying unimodal gaussian curves, one centred on zero as expected for unrelated individuals, and one around 0.4, which lies between the theoretical values for half-sibs (0.25), and full-half-sibs or fathers–sons (0.5). This pattern is significantly different from the distribu-tion obtained by simulating unrelated pairs of individuals with the observed microsatellite allele frequencies (Mann–Whitney U76,5000=161,982,
Figure 2. Correlation between Nei’s genetic distances and geographic distances among leks for 50 males of T. urogallus distributed in 15 lek sites (r2=0.43, P<0.001).
P=0.027; Figure 4). The observed frequency tribution of pairwise relatedness best fitted a dis-tribution in which 66% of the pairs of males were unrelated and 34% were highly related (r=0.4; likelihood=)11.9).
Discussion
As in most of the species range in western Europe, the capercaillie (T. urogallus) population studied here has been drastically declining in the last dec-ades, due to habitat loss and human disturbance (Sachot et al. 2002; Leclercq 2004). Hence, cap-turing free-ranging individuals for genetic sam-pling during reproductive period would have been dangerous for population survival. Here we used a non-invasive genetic approach to estimate
population parameters such as individual and sex identification, relatedness estimates and levels of genetic differentiation that are important for the conservation of this sensitive species (see Regnaut et al. in press).
We found that male capercaillie displaying on the same lek are significantly related and that leks contain a mixture of close kin and non-kin. These results have implications for the understanding of lekking and for the conservation of these highly endangered populations.
The simplest explanation for this genetic simi-larity on leks is that males’ dispersal is restricted to short distances. Indeed, our results show a signif-icant genetic differentiation among sub-popula-tions and a strong pattern of isolation by distance among leks, which indicates that males have a higher probability of establishing on leks close to their natal sites. This is in agreement with field data indicating that male capercaillies do not dis-perse more than a few kilometres (Storch 1995). Isolation by distance has also been documented in other grouse populations (Piertney et al. 1998; Caizergues et al. 2003a, b) and in capercaillie at larger spatial scales (Segelbacher and Storch 2002; Segelbacher et al. 2003).
This study adds to a growing body of evidence that males on leks are often close relatives (Hoglund et al. 1999; Petrie et al. 1999; Shorey et al. 2000; Bouzat and Johnson 2004). In some species, the high relatedness of males might be due to kin association by phenotype matching (Petrie et al. 1999; Shorey et al. 2000). In some other species, genetic similarity might simply be explained by very limited dispersal of males and fidelity to lek sites (Hoglund et al. 1999; Bouzat and Johnson 2004). Whatever the mechanism, genetic structuring among leks seems common in lekking bird species, suggesting that there is a potential for kin selection to act in the mainte-nance of this mating system (Saether 2002; Hoglund 2003).
We found evidence that both close kin and unrelated male capercaillies share the same leks. Approximately 34% of the pairs of males on leks were highly related, often to the level of half-sibs, full-sibs or fathers–sons, when compared to ran-dom individuals from the same sub-populations. However, the rest of the pairs of cocks were unrelated. This pattern is consistent with the hypothesis that pairs of males often result from
Figure 3. Average pairwise relatedness (r) among males from the same leks, measured with respect to allele frequencies in the local sub-populations (light grey bar), and with respect to allele frequencies in the whole population (dark grey bar). The 95% CI obtained by jackknifing over loci do not overlap with zero (vertical lines).
kin association, which might be due to very restricted dispersal of part of the males, or to joint dispersal of kin. However, indirect measures such as the distribution of genetic diversity within and among leks can only bring partial insight into the factors that concur to the establishment and maintenance of lekking behaviour. Hence more studies are needed to evaluate the direct and inclusive fitness benefits of males lekking together. In particular, it would be interesting to study if male capercaillie modify their social behaviour accordingly to their degree of related-ness to neighbours, as has been suggested in red grouse (Watson et al.1994).
Information on parentage is crucial to study the impact of inbreeding in threatened species, to determine Ne, and to verify pedigrees used in
genetic management. The mating system of the capercaillie, with leks, restricted dispersal and probably kin association of males, has a strong effect on the distribution of genetic diversity within populations. In association with the very small current population size and recent habitat fragmentation, the mating system might tend to increase drift and loss of genetic diversity within sub-populations. Our results show a significant level of genetic differentiation (global Fst) at this
small spatial scale, suggesting genetic drift within semi-isolated sub-populations. The lek mating system together with the presence of
highly related individuals within leks might further lead to increased inbreeding and inbreeding depression. However, the presence of unrelated individuals might allow females to choose between mates with well-differentiated genotypes, and such choice might minimize inbreeding and its short-term deleterious out-comes. Thus, kin structure on leks should be taken into account in conservation plans such as the creation of artificial leks in captivity, trans-location of individuals between populations, and reintroduction within sites with suitable habitat (Storch 2000).
Acknowledgements
We thank I. Dupanloup, P. Fontanillas, J. Goudet, H. Niculita, N. Perrin and P. Taberlet for helpful discussions; F. Guillaume for help with the likelihood analysis; A. Bloc (Parc Nat-urel Re´gional de la Haute Chaıˆne du Jura,
France), B. Leclercq (Groupe Te´tras Jura,
France) and S. Sachot (Conservation de la Faune du Canton de Vaud, Switzerland) for organising the sampling and providing essential information on leks. We also thank C. Primmer and two anonymous reviewers for helpful comments on earlier drafts of this paper.
Figure 4. Observed relatedness distribution for pairs of males from the same leks, measured with respect to allele frequencies in the local sub-populations (filled squares), and simulated values for unrelated (open squares) and full-sib (open circles) individuals.
Appendix
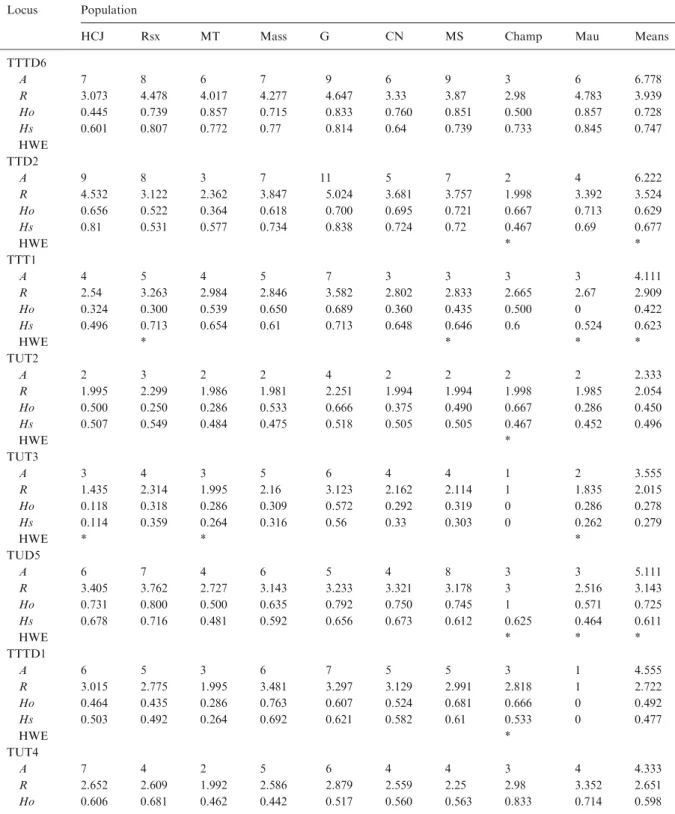
Table A.1. Diversity indices for 11 microsatellite loci used in this study. Population codes as in Table Locus Population
HCJ Rsx MT Mass G CN MS Champ Mau Means
TTTD6 A 7 8 6 7 9 6 9 3 6 6.778 R 3.073 4.478 4.017 4.277 4.647 3.33 3.87 2.98 4.783 3.939 Ho 0.445 0.739 0.857 0.715 0.833 0.760 0.851 0.500 0.857 0.728 Hs 0.601 0.807 0.772 0.77 0.814 0.64 0.739 0.733 0.845 0.747 HWE TTD2 A 9 8 3 7 11 5 7 2 4 6.222 R 4.532 3.122 2.362 3.847 5.024 3.681 3.757 1.998 3.392 3.524 Ho 0.656 0.522 0.364 0.618 0.700 0.695 0.721 0.667 0.713 0.629 Hs 0.81 0.531 0.577 0.734 0.838 0.724 0.72 0.467 0.69 0.677 HWE * * TTT1 A 4 5 4 5 7 3 3 3 3 4.111 R 2.54 3.263 2.984 2.846 3.582 2.802 2.833 2.665 2.67 2.909 Ho 0.324 0.300 0.539 0.650 0.689 0.360 0.435 0.500 0 0.422 Hs 0.496 0.713 0.654 0.61 0.713 0.648 0.646 0.6 0.524 0.623 HWE * * * * TUT2 A 2 3 2 2 4 2 2 2 2 2.333 R 1.995 2.299 1.986 1.981 2.251 1.994 1.994 1.998 1.985 2.054 Ho 0.500 0.250 0.286 0.533 0.666 0.375 0.490 0.667 0.286 0.450 Hs 0.507 0.549 0.484 0.475 0.518 0.505 0.505 0.467 0.452 0.496 HWE * TUT3 A 3 4 3 5 6 4 4 1 2 3.555 R 1.435 2.314 1.995 2.16 3.123 2.162 2.114 1 1.835 2.015 Ho 0.118 0.318 0.286 0.309 0.572 0.292 0.319 0 0.286 0.278 Hs 0.114 0.359 0.264 0.316 0.56 0.33 0.303 0 0.262 0.279 HWE * * * TUD5 A 6 7 4 6 5 4 8 3 3 5.111 R 3.405 3.762 2.727 3.143 3.233 3.321 3.178 3 2.516 3.143 Ho 0.731 0.800 0.500 0.635 0.792 0.750 0.745 1 0.571 0.725 Hs 0.678 0.716 0.481 0.592 0.656 0.673 0.612 0.625 0.464 0.611 HWE * * * TTTD1 A 6 5 3 6 7 5 5 3 1 4.555 R 3.015 2.775 1.995 3.481 3.297 3.129 2.991 2.818 1 2.722 Ho 0.464 0.435 0.286 0.763 0.607 0.524 0.681 0.666 0 0.492 Hs 0.503 0.492 0.264 0.692 0.621 0.582 0.61 0.533 0 0.477 HWE * TUT4 A 7 4 2 5 6 4 4 3 4 4.333 R 2.652 2.609 1.992 2.586 2.879 2.559 2.25 2.98 3.352 2.651 Ho 0.606 0.681 0.462 0.442 0.517 0.560 0.563 0.833 0.714 0.598
References
Andersson M (1995) Sexual Selection, Princeton University Press, Princeton.
Bouzat JL, Johnson K (2004) Genetic structure among closely spaced leks on a peripheral population of lesser prairie-chickens. Mol. Ecol., 13, 499–505.
Caizergues A, Bernard-Laurent A, Brenot JF, Ellison L, Ras-plus JY (2003a) Population genetic structure of rock ptar-migan Lagopus mutus in Northern and Western Europe. Mol. Ecol., 12, 2267–2274.
Caizergues A, Dubois S, Loiseau A, Mondor G, Rasplus JY (2001) Isolation and characterization of microsatellite loci in black grouse (Tetrao tetrix). Mol. Ecol. Notes, 1, 36–38. Caizergues A, Ratti O, Helle P, Rotelli L, Ellison L, Rasplus JY
(2003b) Population genetic structure of male black grouse (Tetrao tetrix L.) in fragmented vs. continuous landscapes. Mol. Ecol., 12, 2297–2305.
Fiske P, Rintamaki P, Karvonen E (1998) Mating success in lekking males: A meta-analysis. Behavioural Ecology, 9, 328– 338.
Frankham R, Ballou JD, Briscoe DA (2002) An Introduction to Conservation Genetics, University Press, Cambridge. Fridolfsson AK, Ellegren H (1999) A simple and universal
method for molecular sexing of non-ratite birds. J. Avian Biol., 30, 116–121.
Goodnight KF, Queller DC (1999) Computer software for performing likelihood tests of pedigree relationship using genetic markers. Mol. Ecol., 8, 1231–1234.
Goudet J (1995) FSTAT (vers. 1.2): A computer program to calculate F-statistics. J. Hered., 86, 485–486.
Hoglund J (2003) Lek-kin in birds – provoking theory and surprising new results. Ann. Zool. Fenn., 40, 249–253. Hoglund J, Alatalo RV, Lundberg A, Rintamaki PT, Lindell J
(1999) Microsatellite markers reveal the potential for kin selection on black grouse leks. Proc. R. Soc. Lond. B Biol. Sci., 266, 813–816.
Kokko H, Lindstro¨m J (1996) Kin selection and the evolution of leks: Whose success do young male maximize? Proc. R. Soc. Lond. B Biol. Sci., 263, 919–923.
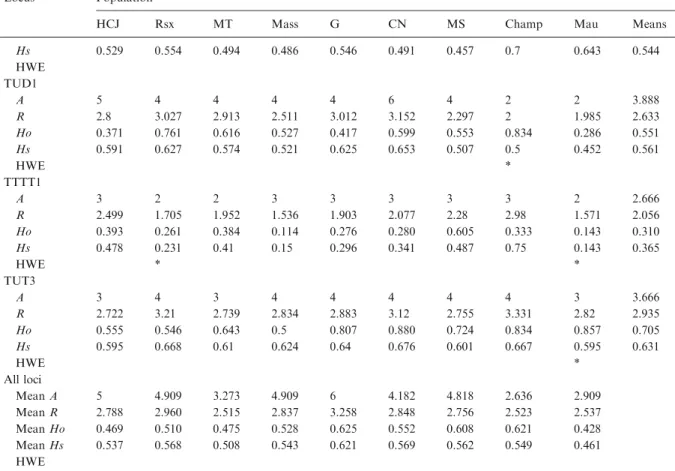
Table A.1.Continued Locus Population
HCJ Rsx MT Mass G CN MS Champ Mau Means
Hs 0.529 0.554 0.494 0.486 0.546 0.491 0.457 0.7 0.643 0.544 HWE TUD1 A 5 4 4 4 4 6 4 2 2 3.888 R 2.8 3.027 2.913 2.511 3.012 3.152 2.297 2 1.985 2.633 Ho 0.371 0.761 0.616 0.527 0.417 0.599 0.553 0.834 0.286 0.551 Hs 0.591 0.627 0.574 0.521 0.625 0.653 0.507 0.5 0.452 0.561 HWE * TTTT1 A 3 2 2 3 3 3 3 3 2 2.666 R 2.499 1.705 1.952 1.536 1.903 2.077 2.28 2.98 1.571 2.056 Ho 0.393 0.261 0.384 0.114 0.276 0.280 0.605 0.333 0.143 0.310 Hs 0.478 0.231 0.41 0.15 0.296 0.341 0.487 0.75 0.143 0.365 HWE * * TUT3 A 3 4 3 4 4 4 4 4 3 3.666 R 2.722 3.21 2.739 2.834 2.883 3.12 2.755 3.331 2.82 2.935 Ho 0.555 0.546 0.643 0.5 0.807 0.880 0.724 0.834 0.857 0.705 Hs 0.595 0.668 0.61 0.624 0.64 0.676 0.601 0.667 0.595 0.631 HWE * All loci Mean A 5 4.909 3.273 4.909 6 4.182 4.818 2.636 2.909 Mean R 2.788 2.960 2.515 2.837 3.258 2.848 2.756 2.523 2.537 Mean Ho 0.469 0.510 0.475 0.528 0.625 0.552 0.608 0.621 0.428 Mean Hs 0.537 0.568 0.508 0.543 0.621 0.569 0.562 0.549 0.461 HWE
A: allele number; R: allelic richness; Ho: observed heterozygosity; Hs: expected heterozygosity; *HWE: deviates significantly from Hardy-Weinberg equilibrium after Bonferroni adjustment (p<0.05).
Leclercq B (1987) Ecologie et dynamique des populations du grand te´tras dans le Jura francais. PhD thesis, Universite´ de Bourgogne, Dijon, France.
Leclercq B (2004) Evolution des populations du grand te´tras dans le Jura Francais, Actes des 4e`mes Rencontres Jurassi-ennes, Mijoux, France.
Møller AP (2003) Sexual selection and extinction: Why sex matters and why asexual models are insufficent. Ann. Zool. Fenn., 40, 221–230.
Petrie M, Krupa A, Burke T (1999) Peacocks lek with relatives even in the absence of social and environmental cues. Nature, 401, 155–157.
Piertney SB, McColl AD, Bacon PJ, Dallas JF (1998) Local genetic structure in the red grouse (Lagopus lagopus scoti-cus): Evidence from microsatellite markers. Mol. Ecol., 7, 1645–1654.
Queller DC, Goodnight KF (1989) Estimating relatedness using genetic markers. Evolution, 242, 258–275.
Regnaut S, Lucas FS, Fumagalli L DNA degradation in avian faecal samples and feasibility of non-invasive genetic studies of threatened capercaillie populations. Conserv. Genet., doi: 10.1007/s10592-005-9023-7.
Sachot S (2002) Viability and management of an endangered capercaillie (Tetrao urogallus) metapopulation. PhD thesis, Universite´ de Lausanne, Lausanne, Switzerland.
Sachot S, Leclercq B, Montadert M (2002) Population trends of Capercaillie (Tetrao urogallus) in the Jura mountains between 1991 and 1999. Game Wildl. Sci., 19, 41–54. Sachot S, Perrin N (2004) Capercaillie (Tetrao urogallus) in
Western Switzerland – Viability and management of an endangered grouse metapopulation. In: Species conservation and management – Case studies(eds. Akc¸akaya HR, Burg-man MA, Kindvall O, Wood CC, Sjo¨gren-Gulve P, Hatfield JS, McCarthy MA), Oxford University Press, Oxford. Saether SA (2002) Kin selection, female preferences and the
evolution of leks: Direct benefits may explain kin structur-ing. Anim. Behav., 63, 1017–1019.
Segelbacher G, Hoglund J, Storch I (2003) From connectivity to isolation: Genetic consequences of population fragmen-tation in capercaillie across Europe. Mol. Ecol., 12, 1773– 1780.
Segelbacher G, Paxton RJ, Steinbru¨ck G, Trontelj P, Storch I (2000) Characterization of microsatellites in capercaillie Tetrao urogallus(Aves). Mol. Ecol., 9, 1934–1935. Segelbacher G, Storch I (2002) Capercaillie in the Alps: Genetic
evidence of metapopulation structure and population decline. Mol. Ecol., 11, 1669–1677.
Shorey L, Piertney S, Stone J, Ho¨glund J (2000) Fine-scale genetic structuring on Manacus manacus leks. Nature, 408, 352–253.
Storch I (1995) Annual home ranges and spacing patterns of capercaillie in central Europe. J. Wildl. Manag., 59, 392– 400.
Storch I (2000) Grouse: Status Survey and Conservation Action Plan 2000–2004, IUCN Publications Services, Cambridge.
Storch I, Segelbacher G (2000) Genetic correlates of spatial population structure in central European capercaillie Tetrao urogallusand black grouse T. tetrix: A project in progress. Wildl. Biol., 6, 305–310.
Taberlet P, Griffin S, Goossens B, Questiau S, Manceau V, Escaravage N, Waits LP, Bouvet J (1996) Reliable geno-typing of samples with very low DNA quantities using PCR. Nucl. Acids Res., 24, 3189–3194.
Valie`re N, Berthier P, Mouchiroud D, Pontier D (2002) Gem-ini: Software for testing the effects of genotyping errors and multitubes approach for individual identification. Mol. Ecol. Notes, 2, 83–86.
Watson A, Moss R, Parr R, Mountford MD, Rothery P (1994) Kin landownership, differential aggression between kin and nonkin, and population fluctuations in red grouse. J. Anim. Ecol., 63, 39–50.