Design of Single-Switch Inverters for Variable
Resistance/Load Modulation Operation
The MIT Faculty has made this article openly available. Please share
how this access benefits you. Your story matters.
Citation
Roslaniec, Lukasz, Alexander S. Jurkov, Anas Al Bastami, and
David J. Perreault. “Design of Single-Switch Inverters for Variable
Resistance/Load Modulation Operation.” IEEE Trans. Power
Electron. 30, no. 6 (June 2015): 3200–3214.
As Published
http://dx.doi.org/10.1109/TPEL.2014.2331494
Publisher
Institute of Electrical and Electronics Engineers (IEEE)
Version
Author's final manuscript
Citable link
http://hdl.handle.net/1721.1/95993
Terms of Use
Creative Commons Attribution-Noncommercial-Share Alike
Design of Single-Switch Inverters for Variable
Resistance / Load Modulation Operation
Lukasz Roslaniec
Department of Electrical Engineering Warsaw University of Technology
Warsaw, Poland
Alexander S. Jurkov, Anas Al Bastami, David J. Perreault
Department of Electrical Engineering and Computer Science Massachusetts Institute of Technology
Cambridge, MA, USA
Abstract—Single-switch inverters such as the conventional class E inverter are often highly load sensitive, and maintain zero-voltage switching over only a narrow range of load resistances. This paper introduces a design methodology that enables rapid synthesis of class E and related single-switch inverters that maintain ZVS operation over a wide range of resistive loads. We treat the design of Class-E inverters for variable resistance operation and show how the proposed methodology relates to circuit transformations on traditional class E designs. We also illustrate the use of this transformation approach to realize 2 inverters for variable-resistance
operation. The proposed methodology is
demonstrated and experimentally validated at 27.12 MHz in a class E and 2 inverter designs that operate
efficiently over 12:1 load resistance range for an 8:1 and 10:1 variation in output power respectively and a 25 W peak output power.
I. INTRODUCTION
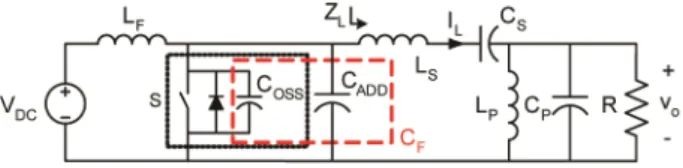
For frequencies above about 10 MHz, single-switch inverters such as the Class E inverter are often preferred. Fig. 1 shows the topology of the conventional Class E inverter, with the addition of a parallel-tuned output filter network LP–CP to improve output waveform
quality. In the traditional Class E inverter [1, 2, 3], the input inductor LF acts as a choke, while the tuned load
network (CF, LS,CS, R) is selected to both deliver power
to the load resistor R and shape the switch voltage vDS to
provide zero-voltage switching (ZVS) and zero dv/dt turn on of the switch. Operation in this way – under ZVS with a single ground-referenced switch – facilitates switching at very high frequencies.
Fig. 1. Class E inverter topology, including parallel-tuned output filter. The capacitor CF comprises the device output capacitance Coss and
additional capacitance CADD. It is also assumed that the switch has an
antiparallel diode.
Because the load network is used to shape the switch voltage trajectory, the traditional Class E inverter is highly sensitive to variations in load resistance [2, 4],
and tends to deviate substantially from zero-voltage switching for load variations of more than about a factor of two or three in resistance. In many applications – such as when the load resistance is well known, or the inverter is coupled to the load via an isolator – this load sensitivity is not problematic. In other applications, however, it would be desirable to be able to operate efficiently over a wide range of resistive loads.
One application in which the effective load resistance can vary significantly is in dc-dc converters. In this case, the equivalent resistance provided by the rectifier can vary significantly with output voltage, instantaneous power, and input voltage [4-6]. While load variations in these applications can be compensated for with techniques such as resistance compression networks [4, 40, 41], these techniques increase component count and loss.
Another application in which the effective load resistance seen by the inverter varies over a wide range is in outphasing inverter systems. In outphasing, output power is controlled by phase-shifting the switching times of multiple inverters (i.e., phase-shift control of two or more inverters). When designed with an appropriate lossless power combiner – such as a Chireix combiner or multi-way lossless combiner – the real component of the effective load impedance seen by each inverter varies with control angle (thus controlling power), while the reactive component remains small [7-18, 33, 37, 38, 42-44]. For this reason, systems controlled in this manner are said to use load modulation to vary their output power. These systems must typically operate over a load resistance ratio that is equal or greater than the desired output power ratio obtained through load modulation. Direct load modulation of inverters can also be realized through electronic tuning of matching networks, as explored in [30, 31, 32].
While Class E and related inverters have been employed in applications with variable effective load resistance (e.g., [15, 16, 19, 30, 33]), a simple, complete and effective methodology for designing inverters for such conditions has been lacking. Prior to the authors’ related conference publication on this topic [34] there has been some theoretical work on design of Class E inverters that are insensitive to load variations (e.g., [16, 20-22]). However, the results are complex, making design insight difficult, and some of these methods tend to lead to designs that have very high circulating
currents, which hurts efficiency. (With sufficiently high circulating currents, operation can be made insensitive to the load resistance, but the achievable practical efficiency of such designs is relatively poor.) Moreover, previous methods do not provide a means to effectively realize load modulation in single-switch inverter designs with higher-order tunings, such as those in [27, 28].
In this paper, we present a methodology for synthesizing single-switch resonant inverters for operation at fixed frequency with variable load resistance (i.e., with load modulation). The proposed approach can be applied to both class E inverters and to higher-order tuned converters such as the class 2
inverter [27] and similar designs [28]. To provide greater flexibility of operation, we allow for waveforms that ideally maintain ZVS switching and constant switch duty ratio, but do not necessarily maintain zero dv/dt turn-on of the transistor as load resistance varies. We focus on identifying the resonant frequencies and characteristic impedances of the key resonant networks in the circuit, and provide guidance of how circuit performance is modified by adjusting these parameters.
In section II of the paper, we introduce an equation-based version of the design methodology as applied to the Class E inverter of Fig. 1. The methodology is demonstrated in Section III and experimentally validated in Section IV. Section V shows how this design methodology is developed based on circuit transformations on classical Class E designs [1-3], and provides a means to transform existing class-E inverter designs to a form more suitable for load modulation. Section VI shows that the circuit-transformation methodology can also be employed in single-switch inverters with higher-order tunings to obtain designs maintaining good performance under load modulation. This is done in the context of an example 2 inverter
design and experimental results are provided that demonstrate the efficacy of this technique. Lastly, Section VII concludes the paper. Appendix I provides a detailed theoretical discussion of the basis for selecting key inverter design parameters.
II. DESIGN METHODOLOGY
We start by outlining a frequency-tuning-based design method for load modulated class E inverters. This method enables class E designs for load modulation to be rapidly synthesized. The proposed design method was arrived at through the circuit transformation methodology we introduce in Section V, coupled with an extensive investigation of performance across a range of design options. Details behind the selection of particular design parameters are thoroughly discussed in Appendix I.
To design the class E inverter for load modulation, one starts with a set of output specifications: output frequency fSW, rated output power Por, and a load
resistance range (from minimum rated load resistance
Rmin to a maximum load resistance Rmax). Output power
Po, load resistance R, and dc input voltage VDC are
approximately related as follows:
32 . 1 2 DC o V R P (1)
The product of power, resistance and the inverse square of voltage being held constant in design is typical in single switch converters (e.g., see [2,3]). Power being proportional to the square of dc voltage owes to the fact that this is a switched linear system with all power delivered to the output, and power being inversely proportional to resistance owes to the fact that the resistor voltage (ideally) does not change with resistance. The proportionality constant was found through numerous simulations and well represents systems designed with the proposed approach; its value is close to but slightly larger than that found theoretically by assuming that the switch voltage is a half-sine wave and the output filter perfectly extracts the fundamental component. The rms output voltage amplitude, Vo,rms, is
approximately 1.15 times the dc input voltage, and is approximately invariant to load resistance, so Rmin sets
the rated output power and Rmax sets the minimum output
power.
For the design procedure, it is assumed that transistors of appropriate characteristics (on-state resistance, voltage and current ratings, and capacitances) can be obtained. The design goals are to select input network component parameters LF and CF, and output network
component parameters (LS, CS, LP and CP). It is assumed
that the total capacitance CF includes transistor output
capacitance Coss. Moreover, we assume that all
components are linear (neglecting variations of Coss with
voltage on circuit operation, as treated in [23-26].) It is also assumed that the transistor is operated at 50% duty ratio.
A key observation we have made is that to achieve good performance under load modulation, the load network impedance ZL should remain substantially
resistive as load resistance R varies. This condition
ensures that the fundamental component of the load current IL (see Fig. 1) is in phase with the fundamental
component of the drain voltage. As Appendix I demonstrates in detail, this is a necessary condition for maintaining ZVS across load modulation. Consequently, we tune both the LS, CS network and the LP, CP network
to be resonant at the switching frequency:
SW S S P P f C L C L 2 1 1 (2)
Note that this design selection is different than those proposed previously for operation under varying load [16, 19-21].
The characteristic impedances of the LS, CS and LP, CP
networks are selected such that adequate filtering of the output voltage is achieved across the intended load modulation range. While this selection is highly application dependent, one possible selection method is to choose the parallel network to provide high filtering for the lightest load (largest resistance), and the series network to provide high filtering at the heaviest load (smallest / rated resistance), and to rely on a combination
of series and parallel filtering in the mid range (e.g., near the geometric mean of minimum and maximum resistances). Thus, one might choose:
fil P P S S Q C L R R C L max min (3)
with Qfil selected in the range of 2 to 10 for adequate
filtering over a 10:1 load resistance range. Note that although larger values for Qfil result in output voltage
waveforms with less harmonic content, they also give rise to higher circulating currents in the output tank, and hence yield higher resonating power losses. On the other hand, lower Qfil values lead to higher harmonic content
in the output, but result in less power losses due to circulating currents in the output tank. It can be shown that the ability of the inverter to maintain ZVS across load modulation improves with reducing the harmonic content of its output load current. In any case, however, selecting Qfil much larger than 10 may be impractical and
hard to realize, especially at higher RF frequencies. On the other hand, extensive circuit simulation indicates that a Qfil of less than 2 gives rise to appreciable harmonic
content in the output, which in turn results in reducing the load modulation range over which the inverter can be designed to maintain ZVS.
It should be noted that other filter structures may be selected, but should be chosen with the goal that the input impedance of the load network (ZL in Fig. 1)
remain resistive at the switching frequency as the load resistance changes. Likewise, to provide impedance transformation between the inverter and the load, one should utilize a method that maintains resistive input impedance of the load at fSW as the load varies, such as a
tuned transformer, an immittance conversion network, or a quarter-wave line [45].
The characteristic impedance of the LF, CF network is
selected based on the rated (minimum) load resistance:
min R k C
LF F f (4)
where kf is a design value typically selected between 0.2
and 1.5. As will be shortly described and discussed in detail in Appendix I, this range of kf values is a result of
the tradeoff between resonating losses and the load modulation range over which the inverter can maintain ZVS. To the extent that soft switching can be maintained, higher values of kf are preferable because
they increase characteristic impedance and reduce the resonating losses associated with the LF, CF network,
which do not reduce significantly as load resistance increases (and operating power reduces). However, lower values of kf yield higher values of CF, and hence
higher allowable values of transistor output capacitance, which forms part or all of CF. Lower values of kf also
reduce LF, enabling faster dynamic response of the
inverter to changes in operating condition. In practice, one starts with a low value of kf, and increases it as much
as possible within the constraints of maintaining ZVS (or close to it) across the load range, providing at least the
minimum amount of capacitance associated with the transistor, and achieving the needed response speed.
To achieve the desired soft-switching performance across load modulation, the input-side network LF, CF
must be tuned to resonance at an appropriate frequency depending on the characteristic impedance of the input tank and the load modulation range. As Appendix I demonstrates, there is no single resonant frequency fIN of
LF and CF that will guarantee perfect ZVS across the
entire load modulation range. In other words, for a given input tank characteristic impedance ZIN, the appropriate
fIN to ensure ideal ZVS varies with load. It can be shown
(see Appendix I) that as the inverter's minimum load resistance decreases compared to ZIN, the correct fIN for
ZVS will approach 1.29 times the switching frequency
fSW. Appendix I further demonstrates that the variation of
fIN (necessary for ZVS) with load variation decreases
with decreasing ZIN compared to the inverter's rated
(minimum) load resistance, i.e. with decreasing kf values
in (4). For example, for a 10:1 load variation and kf =
1.25, the necessary fIN for ideal ZVS varies between
1.29x and 1.5x the switching frequency. On the other hand, for kf = 0.2 and the same load modulation range,
the necessary fIN for ZVS is nearly invariant and
approximately equal to 1.29x the switching frequency. In reality however, the input tank must be tuned to resonate at only one particular frequency, and one does not have the luxury to change fIN with load variation.
Thus fIN must be selected to provide near-ZVS across
load modulation, and it is typically chosen to be 1.3 to 1.5 times the switching frequency:
IN F
FC f
L 2
1 . (5)
This aspect of the tuning is in a similar range as that selected for the designs in [16, 35], which tune the input network at 1.3 and 1.41 times the switching frequency respectively, though other aspects are different. Usually, one would tune the input tank to resonance at a frequency fIN that ensures the inverter is truly
zero-voltage switching at rated or near rated load. As shown in Appendix I, as the output power is backed-off (load resistance is increased), the fIN necessary for ideal ZVS
decreases. Since however the input tank is already tuned at a frequency which ensures ZVS at rated load, increasing its load resistance will cause a negative turn-on voltage across the switch. In the case of implementing the switch with a FET, this negative turn-on voltage will be clamped by the forward-voltage drop of the body diode. As a result, the inverter will continue to maintain near-ZVS with further increase of load resistance. It is noted that in some devices having a body diode, there may be additional reverse recovery losses if the body diode conducts. The GaN HEMT devices used in the present work do not have body diodes per se; rather, reverse conduction is through the device channel, so such reverse recovery loss is not of concern. Appendix I provides additional details on the selection of fIN for a
particular load modulation range and input tank characteristic impedance. We have found that the above methodology, used in conjunction with a circuit simulator such as SPICE, allows rapid design of
inverters that operate well over a wide range of load resistances.
III. EXAMPLE AND DEMONSTRATION
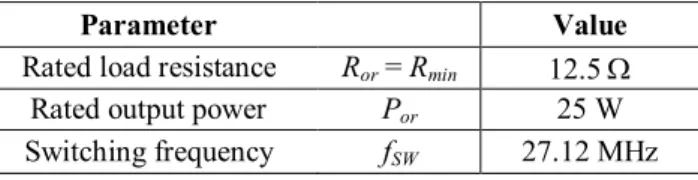
This section illustrates how the proposed class E design methodology can be applied, and presents simulation results that demonstrate its efficacy. (Experimental results are presented in the following section.) The design procedure begins with a rated load resistance, rated output power and switching frequency. Table I summarizes parameters chosen for the example we carry out here.
TABLE. I.DESIGN PROCEDURE EXAMPLE INPUT DATA.
Parameter Value
Rated load resistance Ror = Rmin 12.5
Rated output power Por 25 W
Switching frequency fSW 27.12 MHz
Based on these values, we can calculate the rms value of output voltage Vor (6), rated output rms current Ior (7)
and DC supply voltage VDC (8).
V 17.68 Ω 2.5 1 W 25 or or or P R V (6) A 1 4 1. R P I or or or (7) V 37 . 15 15 . 1 or DC V V (8)
The next step is to choose the parameters LS and CS.
As per (2), these are chosen to resonate at the switching frequency. In addition, we select a Q factor of the circuit at rated load as per (3). Here we select Qfil = Qs = 5:
5 min R C LS S (9)
This leads to the following results: pF 9 . 93 2 1 1 or S S R Q f π C (10) nH. 367 2 2 S or S S Q R C L (11)
A similar approach is applied to design the parallel resonant output filter. In this example, its quality factor is chosen to Qfil = Qp = 4.5 when the load resistance is ten
times higher than the rated resistance (the highest considered resistance): 5 . 4 10 max P P or P P L C R C L R (12) This leads to results:
nH 147 2 10 1 P or P Q f π R L (13) pF. 293 2 2 or P P P R L Q C (14)
Calculation of the LF–CF resonant circuit parameters
begins with the determination of the input tank characteristic impedance. For the present design, we select kf = 0.7. According to (4) we then have:
Ω 75 . 8 7 . 0 or charF R Z (16)
Next, we determine the resonant frequency fIN of the
input network LF–CF. SPICE simulations of the circuit
model indicate that in order to maintain soft-switching, fIN
in (5) must be selected to be approximately 1.5 times the switching frequency: MHz. 68 40 5 1. f . fIN SW (15)
LF–CF are determined from circuit resonant frequency
and characteristic impedance as follows:
pF 447 2 1 charF f F Z πf C (17) nH. 2 . 34 2 F charF F C Z L (18)
For the given parameters, the EPC 1007 transistor has been chosen. Its capacitance is simply approximated as a linear capacitance Coss = 100 pF. To provide the desired
operation, we augment Coss with an additional
capacitance CADD: pF 337 F oss ADD C C C (19)
Calculated parameters are then slightly adjusted using simulation. The nominal circuit parameters for the design (including both from the initial design pass and with adjustments based on simulation) are shown in Table II.
TABLE. II.COMPONENT AND PARAMETER VALUES FOR DESIGNED CLASS E INVERTER.
Fig. 2 shows simulated drain-source voltage waveforms for an inverter based on our proposed design methodology, while Fig. 3 shows results from a conventional class-E design (a design at Q=10 based on [3]). The simulations utilize a simple switch model with an on-resistance Rds = 0.3 and a linear output capacitance
Component Values from design procedure Adjusted values after SPICE simulation LF 34.2 nH 34.2 nH CF 447 pF 516 pF CADD 347 pF 366 pF LS 367 nH 367 nH CS 93.9 pF 93.9 pF LP 147 nH 147 nH CP 293 pF 293 pF vDC 15.37 V 16 V fSW 27.12 MHz 27.12 MHz D 50% 50%
Coss = 100 pF for the switch. Components used in the
proposed design are presented in Table II, while components for the conventional design are presented in Table III. 24ns 36ns 48ns 60ns 72ns 84ns -5V 0V 5V 10V 15V 20V 25V 30V 35V 40V 45V 50V 55V 60V V(drain)
Fig. 2. vDS waveforms of the proposed Class E inverter of Table III (for
1, 2, 5 and 10 times rated resistance of 12.5 Ω).
24ns 36ns 48ns 60ns 72ns 84ns -5V 0V 5V 10V 15V 20V 25V 30V 35V 40V 45V 50V 55V 60V V(drain)
Fig. 3. vDS waveforms of the classical Class E inverter (Q=10 Design,
[3], components in Table III) (for 1, 2, 5 and 10 times rated resistance).
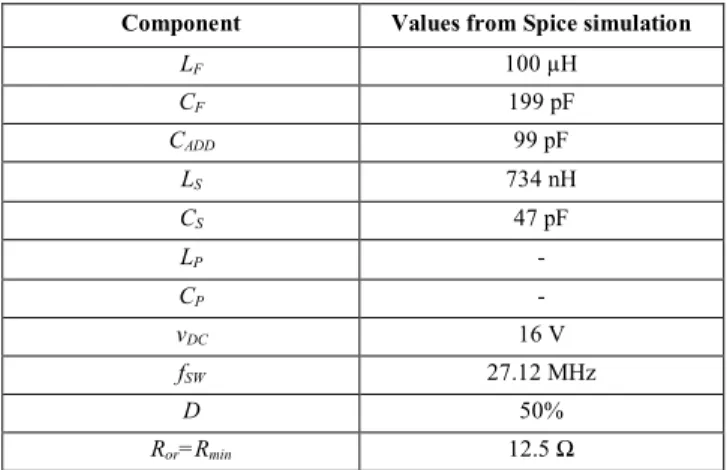
TABLE. III.COMPONENT VALUES FOR CLASSICAL CLASS E INVERTER.
Component Values from Spice simulation
LF 100 µH CF 199 pF CADD 99 pF LS 734 nH CS 47 pF LP - CP - vDC 16 V fSW 27.12 MHz D 50% Ror=Rmin 12.5 Ω
It can be seen that a class-E inverter based on the methodology proposed here achieves much better switching waveforms across load resistance (i.e., at or near ZVS) than a traditional class E design though it does not provide zero dv/dt turn-on of the switch. It is noted that the voltage stress of the converter designed for load modulation is slightly higher than that for a conventional class E inverter (~10%); this may represent a slight disadvantage in some design cases, especially if operation over a wide range of load resistances is not of interest.
IV. EXPERIMENTAL RESULTS
To further validate the proposed approach, an experimental prototype has been developed and evaluated. Fig. 4 shows the prototype, which approximately realizes the example design of the last section (components listed in Table IV.) In addition to using paralleled off-the-shelf inductors to construct LF, a
version of the converter with a custom single-turn foil inductor having a higher Q was also tested. The gate
driver comprised a parallel connection of six inverters (three NC7WZ04 integrated circuits). The inverters were controlled by a function generator. The gate driver circuit supply power never exceeded 100 mW. The inverter was constructed on a four layer PCB with 2 oz outer and 1 oz inner copper layers. The load for the inverter comprised paralleled resistors soldered directly to the PCB. The load resistors were cooled through the PCB by mounting the back of that portion of the PCB to a Dynatron P199 CPU cooler.
Fig. 4. Photograph of the prototype inverter with resistive load and load heat sink. This version of the inverter utilizes three parallel inductors to form LF (Maxi-Spring 132-09, Coilcraft Inc.). The design was also
tested with a large single-turn foil inductor that provided higher Q.
TABLE. IV. COMPONENT VALUES FOR THE PROTOTYPE CLASS E INVERTER.
Fig. 5 shows the experimental test setup. The prototype class E circuit validates the proposed design approach. Input power measurements were based on dc input current and voltage measurements using multimeters. Output power was measured by means of oscilloscope-based rms voltage measurements and knowledge of the load resistance (and thus includes the modest harmonic contributions to output power). Efficiency results across load are shown in Fig. 6. Experimental waveforms at rated load resistance and 12X rated load resistance are shown in Fig. 7 and Fig. 8 respectively.
Component Value Implementation
LF 35.6 nH
3 parallel maxi-spring inductors (132-09, Coilcraft
Inc.)
CADD 377 pF ATC 700A
LS 380 nH maxi-spring 132-17, Coilcraft Inc. CS 90 pF ATC 700A LP 169 nH maxi-spring 132-12, Coilcraft Inc. CP 203 pF ATC 700A Ro-r 12.5 Ω 4 parallel Bourns CHF1206CNT500LW resistors Rmax 150 Ω
Series connection of Bourns CHF2010CNP101RX and CHF1206CNT500LW resistors Switch Coss ~ 100 pF Ron ~ 0.03 Ω EPC 2007 vDC 16 V - fSW 27.12 MHz - D 50% -
Fig. 5. Photograph of the experimental setup. This version of the circuit incorporates the custom foil inductor.
Fig. 6. Inverter drain efficiency as a function of output power (adjusted by resistive load modulation). The efficiency is found at the
following load resistances: R = 12.53 Ω, 16.47 Ω, 24.61 Ω, 49.3 Ω, 99.3 Ω and 149.1 Ω. Efficiency is shown for both the baseline design
(with LF formed from paralleled Maxi-spring inductors) and with a
custom foil inductor for LF.
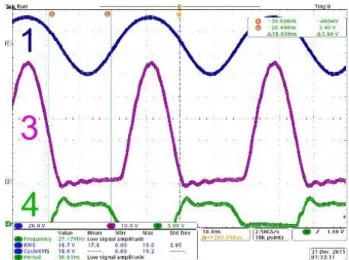
Fig. 7. Waveforms of the prototype class E inverter at rated load (Ro =
12.53 Ω) (1- vo, 3 – vds, 4 – vg).
It can be seen that near-zero-voltage switching is maintained over the 12:1 load resistance range. Unlike the simulation, however, the experimental inverter begins to lose soft switching at one end of the operating range. (It is believed that this results partly from the nonlinearity of the device capacitance, which was not modeled in the simulation.) A 12:1 variation in load resistance results in an 8.3:1 variation of output power. This indicates that the system provides an rms output voltage that is nearly (but not perfectly) invariant to the value of load resistance. Fig. 6 shows efficiency vs. output power, with power
varied by adjusting the load resistance. It can be seen that efficiency remains high over a very wide power (and load resistance) range. At very low output power levels, losses due to circulating currents in the LF-CF input
network become increasingly important and degrade system efficiency. (This underscores the benefit of using a high-Q inductor for the input resonant inductor LF, and
in keeping the characteristic impedance of the input-side tank as high as possible considering soft-switching requirements.)
Fig. 8. Waveforms at 12 times rated load resistance and 12% of rated load power (Ro = 149.1 Ω) (1- vo, 3 – vds, 4 – vg).
V. CIRCUIT TRANSFORMATION VIEW
In this section, we show how circuit transformations can be applied to existing inverter designs (such as the conventional class E inverters of [2,3]) to realize inverters having similar circuit values and properties to those developed with the methodology of Section II. The circuit transformation technique we introduce can be used to retune existing designs to better accommodate load resistance variation, and combined with other design techniques (e.g., [25]) to better account for factors such as device capacitance nonlinearity.
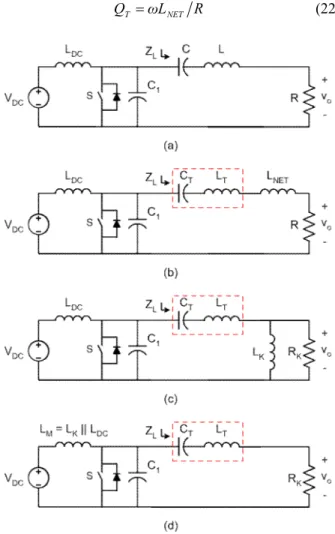
Consider the transformation steps in Fig. 9 (a)-(d). The circuit of Fig. 9(a) can represent a conventional class E design, such as a design from [3] with a high loaded Q and a large-valued dc choke inductor LDC. In such a
design, the resonant network impedance ZL is inductive at
the switching frequency. Consequently, as shown in Fig 10(b), one can split the LC tank into two portions – a series resonant network LT, CT tuned to the switching
frequency and an additional inductor LNET. If the output
tank is of sufficiently high quality factor, it carries a nearly sinusoidal current at the switching frequency. In this case, as illustrated in Fig. 9(c), series-connected components LNET and R can be replaced with a parallel
network (LK and RK) having the same impedance at the
switching frequency. The values of the transformed components may be found as [28]:
2 T NET K Q 1 1 L L (20) and
2
T K R1 Q R (21)where
R L ω
QT NET (22)
Fig. 9. Steps for transforming a class E resonant inverter for variable-resistance operation.
Considering the network of Fig. 9(c), the tank network LTCT is a short circuit (due to resonance) at the
switching frequency. At this frequency (only), inductor
LK is effectively in parallel with the input choke inductor
LDC (from an ac perspective). As our last transformation
step, illustrated in Fig. 9(d), we thus eliminate LK, and
replace LDC with a new inductor LM having a value of LK
|| LDC.
The result of the transformation illustrated in Fig. 9 yields a circuit in Fig. 9(d) that has the output network tuned on resonance at the switching frequency, which we have found to be a desirable characteristic to achieve good operation over a wide load resistance range. Moreover, the input inductor in the transformed circuit is a resonant inductor rather than a simple dc choke. The behavior of the circuit of Fig. 9(d) will not necessarily be the same as that of Fig. 9(a), since two of the transformation steps employed preserve impedance characteristics only at the switching frequency, but not at dc or harmonic frequencies. Nonetheless, this transformation yields designs that are quite close to those produced by the methodology of Section II, and which maintain desirable operation over a wide load resistance range.
As an example of this transformation approach, we start with a conventional class E inverter design from [3] with Q = 100 and a 50% switch duty ratio. From [3], the components for the circuit of Fig. 9(b) are defined by:
RC1 = 0.1851; (22)
RCT = 0.01006; (23)
LT/R = 99.4036; (24)
and
LNET/R = 1.1764 (25)
Transforming to the circuit of Fig. 9(c), we get
RK = 2.3839R (26)
and
LK = 2.027LNET = 2.3846R (27)
Finally the circuit of Fig. 9(d) results in the same values for C1, CT, LT and RK, with
LM = 2.027LNET = 2.3846R . (28)
Examining this design, we find that: ω C LM 5052 . 1 1 1 (29)
such that the input network is tuned almost exactly to 1.5 times the switching frequency, and the output network is tuned to the switching frequency, just as in the design methodology of Section II. With addition of a tuned parallel resonant tank in parallel with the load resistor for filtering (and with appropriate renaming of components) we obtain a design very close to that provided by the direct design method of Section II.
The transformation technique of Fig. 9 is thus useful for converting existing class E inverter designs into alternative designs that are suitable for load modulation. Moreover, this transformation provides an approximate way to relate conventional class E designs to those generated by the methodology developed in Section II. Furthermore, in the following subsection, we demonstrate how this approach can be effectively applied to 2
inverter designs [27] and designs similarly employing higher order tunings (e.g., [28]) to yield inverters suitable for load modulation operation.
VI. CIRCUIT TRANSFORMATION OF A 2INVERTER
In a traditional class E inverter, the peak switch voltage stress is ideally about 3.6 times the input voltage [1], [2]. However, the non-linear characteristic of the device capacitance with drain voltage may further increase the voltage stress to more than 4 times the input voltage [23]. In contrast, by employing higher-order tunings, reduced device stress is achievable. For example, using a tuned resonant input network, a 2 inverter
achieves zero-voltage switching and low device voltage stress [27]. An important feature of the 2 converter of
Fig. 10 is the LMR - CMR series branch which is tuned to
be resonant near the second harmonic of the switching frequency, thus suppressing second harmonic content in
the drain voltage and providing a quasi-trapezoidal drain voltage waveform. F2 inverters are useful in very
high-frequency dc-dc converters, for example [39, 46-49]. Fig. 10 shows a schematic of a 2 inverter driving a
load RL and having an input voltage VDC. The switch is
realized with a MOSFET having a drain-to-source capacitance COSS.
Fig. 10. Schematic of the 2 inverter with an input voltage VDC and a
load RL.
By carefully tuning the components of the inverter, the peak voltage across the switch can be minimized while maintaining switched-mode operation with near zero-voltage turn-on and turn-off at given frequency and duty ratio [27]. As this inverter is usually designed using frequency-domain tuning techniques [27, 39], and there are an infinite number of possible implementations, transformation-based methods are highly useful in realizing designs for load modulation operation.
The ringing characteristic of the drain-to-source voltage during the period when the switch is in the "off" state is determined by the impedance Zds seen looking
into the circuit port defined by the drain. By appropriately tuning the inverter components so that Zds is high at the
fundamental and third harmonics and low at the second harmonic, a quasi-trapezoidal drain-to-source voltage waveform can be obtained. Furthermore, as [27] demonstrates, in order to obtain such a drain-to-source voltage waveform, the impedance Zds at the fundamental
of the switching frequency must be 30º to 60º inductive. A detailed methodology for the design of the 2
inverter and for selection of its components is provided in [27]. According to this methodology, the 2 inverter is
designed for a particular load RL. The values of CS and LS
are selected to achieve the desired power transfer based on the voltage division from the trapezoidal drain voltage waveform resulting from the impedances of CS, LS and
RL. As a result of this design methodology, load
modulation of the inverter could significantly alter its drain impedance Zds (especially its phase). Consequently
this may distort the desired trapezoidal drain voltage waveform causing loss of zero-voltage switching and inevitable reduction of the overall inverter efficiency. Using a transformation-based approach, one can synthesize an alternative 2 design that does not have the
same constraints.
To illustrate the transformation approach in the context of the 2 inverter, consider a traditional 2
inverter designed according to the methodology outlined in [27] with LF = 110 nH, LMR = 90 nH, CMR = 95.7 pF,
CP = 100 pF, CS = 96.5 pF, LS = 430 nH. The inverter is
designed to operate at 27.12 MHz and deliver up to 25 W to a 12.5 resistive load for an input voltage VDC of 30
V. The semiconductor switch is implemented with a 100 V GaN MOSFET (EPC2007, EPC) with an on-resistance Rds,ON of approximately 30 m, and an intrinsic output
capacitance COSS of 118 pF at a drain-to-source voltage
VDS = 50 V.
The switch is operated with 30 % duty-cycle. Similarly to the class E inverter design described above, the gate driver comprises a parallel combination of six inverters (NC7WZ04, Fairchild Semiconductor). The inverters are operated with a supply voltage of 3.8V and are driven by a 27.12 MHz sine wave with amplitude of 4.2 Vpp and a DC offset of 3.22 V (generated by a function generator). Fig. 11 shows the 2 inverter board,
while Table V lists the components used in its implementation and describes their respective realization.
Fig. 11. Photograph of the traditional 2 inverter designed according to
[27] (see Fig. 13a). PCB size is 42 mm x 57mm. The transformed version of the 2 inverter (Fig. 13d) has an identical PCB layout,
although it is populated with different components.
Fig. 12 depicts the measured drain voltage waveforms for the above 2 inverter design with VDC = 30 V for 1x,
2x, 4x, and 10x its rated load resistance RL = 12.5 the
minimum load resistance for which the inverter is designed. As can be seen, when the inverter is loaded with its rated load RL its drain voltage is quasi-trapezoidal
with a peak switch voltage stress of about twice the input voltage. Under this loading condition, the MOSFET clearly exhibits zero-voltage turn-on. However as the inverter loading resistance is increased, it can be seen that the trapezoidal shape of the switch drain voltage is significantly altered, and zero-voltage switching is lost.
TABLE. V.COMPONENT VALUES FOR THE TRADITIONAL 2 INVERTER OF FIG.13A.
Component Value Implementation
LF 110 nH Coilcraft Inc. 2222SQ-111GEB LMR 90 nH Coilcraft Inc. 2222SQ-90NGEB CMR 95.7 pF ATC 100B 2R7BW in parallel with ATC 100B ATC 100B 820JW LS 430 nH Coilcraft Inc. 2929SQ-431GEB CS 96.5 pF ATC 100B 8R2CW in parallel with ATC 100B 820JW CP 100 pF ATC 100A 820JW Switch COSS ~ 118 pF Rds,ON ~ 30 m EPC 2007
Fig. 12. Drain voltage of the 2 inverter of Fig. 10 with LF = 110 nH,
LMR = 90 nH, CMR = 95.7 pF, CP = 100 pF, CS = 96.5 pF, LS = 430 nH,
and VDC = 30 V for various resistive loads. The rated (minimum) load
resistance is RL = 12.5 .
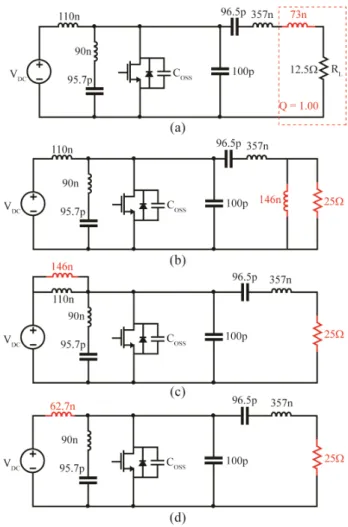
Let us now apply the circuit transformations discussed in Section V to the 2 inverter design
considered above and examine the effect of load modulation on its drain voltage waveform. Fig. 13 illustrates the steps for transforming the 2 inverter for
variable load resistance operation. The 430 nH output inductor (LS) of the original inverter design can be
thought of as a series combination of 357 nH and a 73 nH inductors (see Fig. 13a). Note that the 357 nH is in resonance with the 96.5 pF capacitor at the 27.12 MHz switching frequency.
As a next step (see Fig. 13b), the series combination of the 73 nH and the 12.5 load (Q = 1.00 at 27.12 MHz) can be converted to their parallel circuit equivalent as per (20)-(22). This series-to-parallel transformation is only valid at the inverter's switching frequency. Since at 27.12 MHz the 96.5 pF capacitor and 357 nH inductor are in resonance, the 146 nH load inductor (Fig. 13b) is effectively connected in parallel with the 110 nH input inductor. In turn, the parallel combination of the 146 nH and 110 nH inductors can be equivalently replaced by a 62.7 nH inductor (Fig. 13d). Note that the circuit transformation from Fig. 13b to Fig. 13c is strictly valid only at the inverter's switching frequency. It can be shown however that the non-validity of this transformation at higher harmonics of the switching frequency has only a minor impact on the inverter's performance. This is especially true for inverter designs with low harmonic content in their output. The above circuit transformation does have a minor effect on the drain impedance Zds at higher harmonics of the switching
frequency. Nevertheless, at the inverter's 27.12 MHz switching frequency, the phase and magnitude of the drain impedance remain unchanged; it is this impedance phase and magnitude that are of greatest significance to the shaping of the drain voltage waveform [27]. For sake of clarity, let us refer to the inverters of Fig. 13a and Fig. 13d as the traditional and transformed inverter designs respectively.
Note that although the traditional inverter (Fig. 13a) is designed for a 12.5 load, after applying the circuit transformations, the nominal load of the transformed inverter for rated power is 25 . Of course, if one still desires to employ the modified design in the original application, namely to drive a nominal 12.5 load, an additional impedance transformation stage may be included.
The PCB layout of the transformed 2 inverter is
identical to that of the traditional inverter (see Fig. 11). The components used in the implementation of the transformed inverter are listed in Table VI.
Note that due to availability of component values, the 62.7 nH input inductor in Fig. 13d is implemented as a 68 nH inductor. As a consequence, the 100 pF CP capacitor
is slightly reduced to 80 pF to preserve ZVS. For similar reason, the 357 nH output inductor LS (see Fig. 13d) is
implemented as a 360 nH inductor, and consequently, CS
is slightly reduced to 95.7 pF to maintain resonance of CS
and LS at the inverter's switching frequency.
Fig. 13. Steps for transforming a class 2 inverter for variable-load
operation.
TABLE. VI.COMPONENT VALUES FOR THE TRANSFORMED 2 INVERTER OF FIG.13D.
Component Value Implementation
LF 68 nH Coilcraft Inc. 1515SQ-68NGEB LMR 90 nH Coilcraft Inc. 2222SQ-90NGEB CMR 95.7 pF ATC 100B 3R9CW in parallel with ATC 100B 820JW LS 360 nH Coilcraft Inc. 2929SQ-361GEB CS 95.7 pF ATC 100B 5R6CW in parallel with ATC 100B 820JW CP 80 pF ATC 100A 680JW Switch COSS ~ 118 pF Rds,ON ~ 30 m EPC 2007
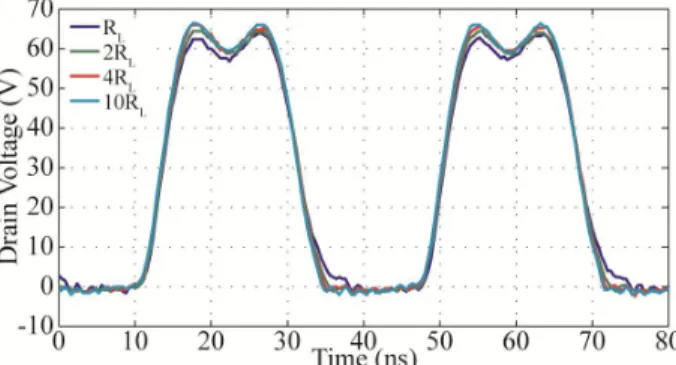
Fig. 14 shows the simulated drain voltage waveforms of the transformed 2 inverter of Fig. 13d for 1x, 2x, 4x,
and 10x its rated load resistance RL of 25. As can be
seen, load modulation by a factor of 10 has only a minor effect on the quasi-trapezoidal drain voltage waveform. It is important to note that the inverter maintains zero-voltage switching despite the modulation of its load.
Fig. 14. Drain voltage of the transformed 2 inverter of Fig. 13d for
various resistive loads. The rated load resistance is RL = 25 .
To gain an insight in the operation of the modified inverter, first consider the original design of Fig. 13a. The load voltage is a function of the voltage division formed by RL and the impedance resulting from LS and CS (see
Fig. 10). As a result, variation of the load affects the overall phase of the drain impedance, hence altering the characteristics shaping the drain voltage.
In the modified design however, LS and CS are in
resonance at the converter's switching frequency. Thus, at this frequency only, the inverter’s load resistance appears in parallel with its total drain-to-source capacitance (COSS
in parallel with CP). Thus increasing the load resistance
above its rated load value has little effect on the phase or magnitude of Zds since Zds is dominated by the
drain-to-source capacitance. This is especially true for low inverter loading, in which the load resistance is much larger than the impedance of the drain-to-source capacitance. It can be demonstrated that because of the small impedance (relative to the load) of the drain-to-source capacitance, the drain voltage waveform remains quasi-trapezoidal for much larger load variations than in the case of the traditional 2 inverter.
The measured drain efficiencies (power delivered to the load over dc supply power) versus output power for the traditional (Fig. 13a) and transformed (Fig. 13d) 2
inverter designs are shown in Fig. 15. Gate-driving power losses are excluded. Input power measurements are based on dc input current and voltage measurements using multimeters (34401A, Agilent). An oscilloscope (MSO4054, Tektronix) along with a differential probe (P6251, Tektronix) is used to measure the inverter’s output voltage. The output power measurements are based on the oscilloscope-calculated rms output voltage and knowledge of the load resistance (and thus include the harmonic contributions to output power). Each of the employed load resistances is characterized over temperature. Although both inverter designs exhibit similar efficiencies of approximately 90% at rated load, as can be seen from Fig. 15, the transformed inverter design is considerably more efficient with power back-off through load modulation. Of course, lowering the characteristic impedance of all tanks is a way to further reduce the load sensitivity of a 2 design; however, a
substantial conduction loss penalty is paid for using
lower-than-necessary characteristic impedance levels, so this approach is not desirable.
Fig. 15. Drain efficiency for the original and modified 2 inverter
designs versus output power through load modulation. The output power axis is normalized to the rated output power for which each
inverter is designed.
As a result of the circuit transformations considered above, the quality factor Q of the output series-resonant tank formed by CS, LS and RL maybe inadequate for some
applications. Even more so, the quality factor will decrease further with increase of the inverter’s load resistance. For example, in the 2 inverter considered
above (Fig. 13d), the quality factor of the output filter formed by the 96.5 pF capacitor, 357 nH inductor and 25 rated load is only 2.4. However, if the load is increased to 10x the rated load, i.e. RL = 250 , the quality factor
now becomes 0.24. Such a low Q-factor barely provides any filtering of the output. For example, Fig. 17 and Fig. 18 show the measured gate, drain and output voltage waveforms for the transformed 2 inverter design of Fig.
13d with a 25 load and a 250 load respectively. It can be seen that at rated load, the inverter’s output is nearly sinusoidal (see Fig. 17), but once the load is increased to 250 , the content of higher harmonics in the inverter’s output is obvious (see Fig. 18). In some applications where the load is sensitive to harmonic content, additional filtering must be provided.
Fig. 16. Augmented schematic of the 2 inverter of Fig. 10 including
additional output filtering. The filtering network comprises CSS, LSS,
CPP and LPP.
Fortunately, additional filtering can be provided without substantially affecting the inverter's performance. For example, Fig. 16 shows an augmented version of the 2 inverter including an additional series and parallel
resonant tank. Note that values of the output filter components are selected so that LSSCSS and LPPCPP are
series-resonant and parallel-resonant respectively at the inverter’s switching frequency. The series-resonant branch provides most of the filtering at high inverter loading (small load resistance), while the parallel-resonant branch provides most of the filtering at low inverter loading (high load resistance). Other filtering configurations may be implemented, provided that the
impedance ZOUT (see Fig. 16) remains resistive at the
inverter's switching frequency over the load modulation range.
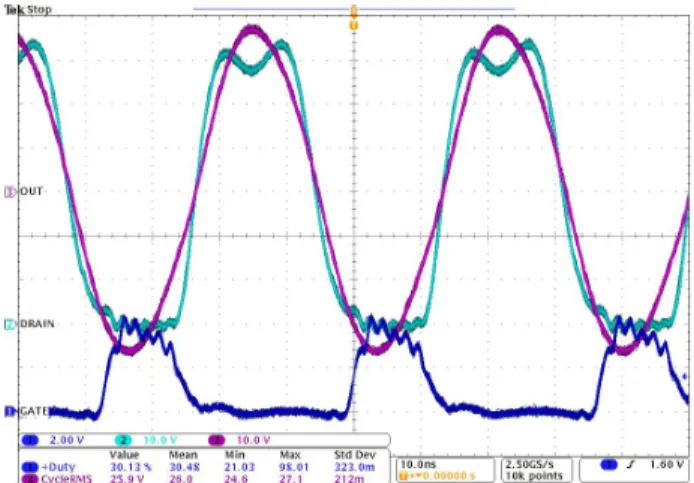
Fig. 17. Gate, drain and load voltage for the transformed 2 inverter of
Fig. 13d with LF = 68nH, LMR = 90 nH, CMR = 95.7 pF, CP = 80 pF, CS
= 95.7pF, LS = 360 nH, and VDC = 30 V for rated load RL of 25 .
Fig. 18. Gate, drain and load voltage for the transformed 2 inverter of
Fig. 13d with LF = 68nH, LMR = 90 nH, CMR = 95.7 pF, CP = 80 pF, CS
= 95.7pF, LS = 360 nH, and VDC = 30 V for 10x the rated load RL of
250 .
VII. CONCLUSION
This paper presents a methodology for synthesizing single-switch resonant inverters such as Class E inverters for operation at fixed frequency with variable load resistance (i.e., with load modulation). We present a design methodology yielding class E inverter designs that are effective across a wide load resistance range. We focus on identifying the resonant frequencies and characteristic impedances of the key resonant networks in the circuit, and provide guidance of how circuit performance is modified by adjusting these parameters. The efficacy of this approach is demonstrated in both simulation and in an experimental prototype inverter at 27.12 MHz. The inverter design developed using this approach has been successfully employed for load modulation operation in a multi-way outphasing power amplifier system [36, 37]. We also show how this design methodology relates to circuit transformations on classical class E designs, and demonstrate how the transformation-based approach can also be employed to reconfigure designs with higher-order tunings for variable-resistance operation. It is expected that the presented work will be widely useful in applications where single-switch inverters are operated under
variable-resistance-load operation, such as in dc-dc converters and outphasing power amplifiers.
VIII. APPENDIX I
Section II outlined a simple methodology for designing a class E inverter that maintains ZVS over a wide load modulation range. This Appendix provides a discussion of the theory for selecting the input network of the inverter formed by components LF and CF (see Fig.
1). Here we present a derivation of the input tank resonant frequency necessary for ensuring ZVS across load modulation, and we explain the proposed frequency tuning range proposed in Section II. Furthermore, we demonstrate that in order to guarantee ZVS across the full load range, it is necessary to tune the inverter’s output network (LS, CS, LP, CP, see Fig. 1) to be resonant at the
inverter’s switching frequency. Finally, we provide guidelines on selecting the input network characteristic impedance, and we discuss its effects on the inverter’s performance.
In order to understand the frequency to which the input resonant tank (LF and CF) of the class E inverter of
Fig. 1 should be tuned to maintain ZVS across a wide load modulation range, first consider an unloaded version of the class E inverter as shown in Fig. 19A. The circuit comprises only the input resonant tank formed by CF and
LF, a switch S, and a dc supply VDC. For sake of
simplicity, assume that LF and CF are ideal (no parasitic
components) and that the switch S behaves as a short or open circuit when respectively closed or opened. Assume that S is switched with a 50 % duty cycle for long enough time to allow the circuit to reach its periodic steady-state operation. Now suppose that at time TOFF (after the circuit
has reached steady-state operation) the switch is turned-off as part of its switching cycle and then kept turned-off for the rest of time. The resulting drain voltage waveform is shown in Fig. 19B.
Fig. 19. Schematic of the unloaded class E inverter of Fig. 1 (A), and its simulated drain voltage (B). Prior to TOFF, switch S is switched with
50% duty-cycle, while past TOFF, S is kept off. LF and CF are selected to
ensure ZVS at no load.
As can be seen from Fig. 19B, the drain voltage continues to resonate at the resonant frequency of LF and
CF. Note that from steady-state analysis the cycle average
of the drain voltage before and after TOFF must be equal
to the supply voltage VDC. Furthermore, since we have
assumed no losses in the circuit, the oscillations in drain voltage Vdrain after TOFF are undamped and sinusoidal
with some frequency fIN and amplitude AIN. Thus we can
express Vdrain as per (30):
IN
DCIN
drain A cos f t V
V 2 . (30)
Note that according to the drain voltage representation we have chosen in (30), the peak of the drain voltage corresponds to t = 0. This choice simplifies
the mathematical expressions, although the absolute phase of the drain voltage expression is irrelevant to the present discussion, and any other choice will yield identical results.
In order to ensure ZVS at no load, Vdrain must go from
0 V to its peak amplitude and then back to 0V in half of a switch period TSW (see Fig. 19B). In reference to (30), this
can be rewritten according to (31):
0 4 2 4 DC SW IN IN T drain V T f cos A V SW . (31)
Furthermore, the positive portions of Vdrain before and
after TOFF are identical, and hence, the cycle average of
Vdrain prior to TOFF can be expressed by (32):
DC SW T T AINcos fINt VDC dt V T SW SW
4 4 2 . (32)Solving (31) and (32) simultaneously for fIN and AIN
yields (33) and (34) respectively:
SW IN . f f 129 (33) DC IN . V A 227 , (34)
where fSW is the switching frequency of the inverter, fSW =
1/TSW. Thus, to ensure ZVS at no load, we can conclude
from (33) that the inverter's input network must be tuned for resonance at a frequency that is approximately 30% higher than the inverter's switching frequency.
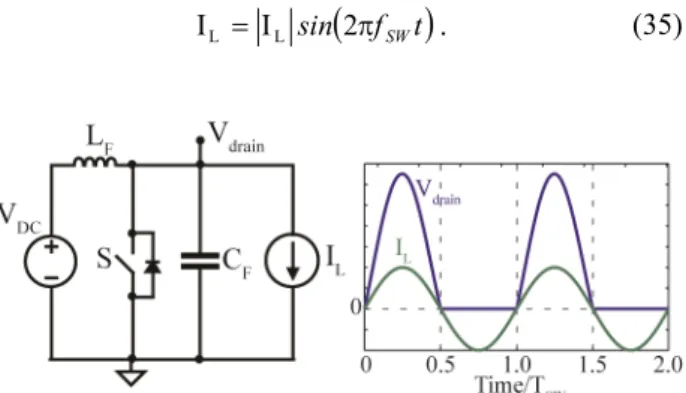
It is interesting and instructive to consider what happens to the operation of the inverter of Fig. 19A when its drain is loaded. Fig. 20 shows the inverter of Fig. 19 with a loading current source IL connected to its drain
node. Suppose that the load current is a pure sinusoid with a frequency equal to the inverter's switching frequency fSW, amplitude |IL| and such a phase so that the
load current waveform is in phase with the drain voltage, i.e. IL is positive when the switch is off, and IL is negative
when the switch is on (see Fig. 20B). Assume for the present discussion that the switch is operated at 50 % duty cycle. We can then express IL by (35):
f t
sin SW
I 2
IL L . (35)
Fig. 20. Schematic of a loaded class E inverter of Fig. 1 (A), and an example of its drain voltage waveform for a relatively small loading
current magnitude |IL| (B). The inverter load current IL is sinusoidal
with a frequency equal to the inverter's switching frequency and in phase with the drain voltage.
Again, the absolute phase of IL is irrelevant as long as
the load current is in phase with the drain voltage waveform. Let us now investigate the effect of IL on the
drain crossover voltage VX, i.e. the drain voltage value at
the moment the switch S is turned-on. Note that a
non-zero VX suggests that the CF capacitor stores some
residual charge right before switch turn-on which is lost once the switch is turned on, thus giving rise to switching loses. Indeed, this indicates non-ZVS inverter operation.
By employing linear circuit analysis, it can be shown that the drain voltage Voff during the switch off-period is
given by (36):
SW IN IN SW
SW IN L IN IN DC off f f f f t f cos t f cos I t f sin i t f cos V V 2 2 C L 2 C L 2 1 F F F F 0 . (36)where fIN is the resonant frequency of LF and CF, fSW is the
inverter's switching frequency, |IL| is the amplitude of the
load current, and i0 is the initial current in the LF inductor
at the moment the switch is turned off. Note that (36) is only valid during the period when the switch is off and only once the circuit has reached steady-state operation. For sake of simplicity of the expressions, we define t = 0 to be the moment at which the switch is turned off and the drain voltage is allowed to ring. Thus in (36), Voff is
defined only for 0 ≤ t ≤ TSW/2.
Furthermore, it can be shown that the initial current i0
in the LF inductor at switch turn-off can be expressed in
terms of the supply voltage VDC and the load current
amplitude |IL|:
k
cos
k
k sin k k cos k k sin V i DC 1 1 I 1 L C 2 L F F 0 . (37)where k is the ratio of fIN to fSW, i.e. k = fIN/fSW. As we
shortly demonstrate, to ensure ZVS operation across load modulation, k must be selected according to (33). Note that by substituting (37) into (36) and evaluating Voff at t
= TSW/2, one can obtain the crossover voltage VX (the
drain voltage at switch turn-on) in terms of the inverter's supply voltage and the load current magnitude. Through algebraic manipulations, it can be shown that irrelevant of the load current magnitude |IL|, the drain voltage is
always zero at switch turn-on (VX = 0), provided that the
load current is purely sinusoidal and in phase with the drain voltage (see Fig.19B), and LF and CF are resonant at
fIN as per (33). Thus we can conclude that as long as the
loading current is purely sinusoidal and in phase with the drain voltage, the inverter will exhibit ZVS for any load.
In reality, however, one does not have direct control of the phase or waveform shape of the inverter's load current. Instead, it is determined by the drain voltage waveform and the characteristic of the load impedance. Consider again the loaded class E inverter of Fig. 20A. Fig. 20B shows the drain voltage waveform shape for no load (|IL| = 0), or for relatively small load current
magnitudes |IL| compared to the inverter's maximum rated
loading. For such low-loading conditions, it can be shown by reference to (37) and (36) that the drain voltage waveform during the switch off-period is symmetrical about t = TSW/4. An important property of the drain
voltage waveform at low current loading is that its first harmonic is in phase with the drain voltage. In other words, if we were to plot the first harmonic (at the switching frequency) of the drain voltage at low-loading conditions, it will be entirely positive during the switch off-period and entirely negative during the switch
on-period. Thus if we terminate the inverter's output with an impedance network that is purely resistive at the switching frequency fSW while attenuating higher
harmonic frequencies, then the resulting load current can be nearly sinusoidal at the switching frequency and in phase with the drain voltage. This is indeed the reason for tuning the series (LSCS) and parallel (LPCP) tanks in Fig.
1 to resonance at the inverter's switching frequency. As long as the inverter's load current is sinusoidal and aligned with the drain voltage, the inverter is guaranteed to operate in ZVS mode and hence reduce switching losses. However, increasing the inverter's load current distorts the drain voltage waveform from the one shown in Fig. 20B, causing a certain time-shift between the drain voltage and its fundamental component. This in turn results in a change in alignment between the loading current and the drain voltage, hence leading to loss of ZVS. The degree to which higher loading currents affect the drain voltage waveform and its effect on ZVS depends on the characteristic impedance of the input network (LF and CF in Fig. 1) relative to the inverter's
rated load (minimum loading impedance).
Higher characteristic impedances of the input-side network result in larger distortions of the drain voltage waveform with increase of loading current, leading to bigger misalignment between the load current and the drain voltage and ultimately yielding an increase in the switching losses. Conversely, smaller characteristic impedances result in larger circulating reactive currents in the input network. As a consequence, increasing the inverter's loading current has less effect on the drain voltage waveform and causes less change in alignment between the loading current and the drain voltage. As a result, the inverter is able to maintain ZVS over a wider load modulation range. The latter benefit however is at the expense of larger power losses at the input network due to the higher circulating currents.
The effect of the characteristic impedance of the LFCF
input network (see Fig. 1) on the ability of the inverter to maintain ZVS across load modulation is clearly shown in Fig. 21. Fig. 21 is obtained by simulating the class E inverter of Fig. 1 and measuring the crossover voltage VX
(the drain voltage at the moment the switch is turned-on) at different inverter loads for a range of input network resonant frequencies fIN. Plots for four different
characteristic impedances of the LFCF input network are
shown. kf is the ratio of the inverter's rated load Rmin to
the input tank characteristic impedance as given by (4). Note that Fig. 21 is generated for a class E inverter with only a series-resonant output tank with a quality factor of Q = 10 (the parallel LPCP tank in Fig. 1 is not included).
Furthermore, the body diode of the transistor is also ignored in the simulation.
As can be seen from Fig. 21, as the inverter's loading resistance is increased, the inverter's loading current decreases, and it exhibits ZVS operation (VX = 0) at an
input network resonant frequency fIN ≈ 1.29fSW
irrespective of the characteristic impedance of the input tank. This is indeed the frequency derived from (31) and (32) and given by (33) for the low-loaded operation of a class E inverter. Furthermore, one can see from Fig. 21 that as input network characteristic impedance decreases, the variation of the necessary fIN for ZVS with loading
also decreases. As described earlier, this is because the lower characteristic impedance results in higher circulating currents in the input network, and so variation of the inverter's loading current has less effect on its drain
voltage waveform. For example, for kf = 0.2 (see Fig. 21),
the fIN necessary for maintaining ZVS across a 10:1 load
modulation is approximately as given by (33) for the low-loaded inverter operation.
On the other hand, as can be seen from Fig. 21 (kf =
1.25 and kf = 1.0), increasing the input network
characteristic impedance results in larger variations of the necessary fIN to maintain ZVS with load modulation. For
example, for kf = 1.25, to ensure ZVS operation at rated
load, the input tank must be tuned to resonance at approximately 1.5 times the inverter's switching frequency. In this case however, once the inverter's loading decreases significantly (load resistance increases), the inverter will lose ZVS and the drain voltage at the moment the switch is turned-on will be negative. Note that in reality however, the drain voltage is clamped via the transistor's body diode, so negative drain voltages are limited to the diode's forward voltage drop. Thus even for the above case (kf = 1.25 and fIN = 1.5fSW),
at light loads, the inverter will still exhibit nearly ZVS operation. This explains why Section II proposes a frequency range of 1.3fSW to 1.5fSW for fIN.
Fig. 21. Normalized crossover voltage VX versus normalized input tank
resonant frequency fIN for 1x, 2x, 5x, and 10x the rated inverter load
(Rmin) and for various input tank characteristic impedances
(k f LF CF Rmin) for the class E inverter of Fig. 1.
ACKNOWLEDGEMENTS
The authors would like to acknowledge the support provided for this work by the MIT Center for Integrated Circuits and Systems, the MIT/MTL GaN Energy Initiative, the MIT-SkTech program, and the Center for Advanced Studies of the Warsaw University of Technology.
REFERENCES
[1] N. Sokal and A. Sokal, “Class E—A new class of high-efficiency tuned single-ended switching power amplifiers,” IEEE Journal of
Solid-State Circuits, vol. SC-10, no. 3, pp. 168–176, Jun. 1975.
[2] N. O. Sokal, “Class-E RF power amplifiers,” in Proc. QEX, pp. 9-20, Jan./Feb. 2001.
[3] M.K. Kazimierczuk and K. Puczko, “Exact Analysis of Class E Tuned Power Amplifier at any Q and Switch Duty Cycle,” IEEE
Transactions on Circuits and Systems, Vol. CAS-34, No. 2, pp.
149-159, Feb 1987.
[4] Y. Han, O. Leitermann, D. A. Jackson, J. M. Rivas, and D. J. Perreault, “Resistance compression networks for radio-frequency power conversion,” IEEE Transactions on Power Electronics, vol. 22, no. 1, pp. 41–53, Jan. 2007.
![Fig. 11. Photograph of the traditional 2 inverter designed according to [27] (see Fig](https://thumb-eu.123doks.com/thumbv2/123doknet/14688266.560683/9.892.481.826.804.1143/fig-photograph-traditional-inverter-designed-according-fig.webp)