Deciphering eukaryotic gene-regulatory
logic with 100 million random promoters
The MIT Faculty has made this article openly available.
Please share
how this access benefits you. Your story matters.
Citation
de Boer, Carl G. et al., "Deciphering eukaryotic gene-regulatory
logic with 100 million random promoters." Nature Biotechnology 38,
1 (January 2020): p. 56–65 doi. 10.1038/s41587-019-0315-8 ©2019
Author(s)
As Published
https://dx.doi.org/10.1038/s41587-019-0315-8
Publisher
Springer Science and Business Media LLC
Version
Author's final manuscript
Citable link
https://hdl.handle.net/1721.1/125982
Terms of Use
Article is made available in accordance with the publisher's
policy and may be subject to US copyright law. Please refer to the
publisher's site for terms of use.
Deciphering eukaryotic gene-regulatory logic with 100 million
random promoters
Carl G. de Boer1,*, Eeshit Dhaval Vaishnav1,2, Ronen Sadeh3, Esteban Luis Abeyta4, Nir Friedman1,3, Aviv Regev1,2,*
1Klarman Cell Observatory, Broad Institute of MIT and Harvard, Cambridge, MA 02142, USA 2Howard Hughes Medical Institute and Koch Institute of Integrative Cancer Research, Department of Biology, Massachusetts Institute of Technology, Cambridge, MA 02140 USA
3School of Computer Science and Institute of Life Sciences, The Hebrew University of Jerusalem, Jerusalem, 9190401, Israel
4Initiative for Maximizing Student Development Program, University of New Mexico, Albuquerque, NM, USA
Abstract
How transcription factors (TFs) interpret cis-regulatory DNA sequence to control gene expression remains unclear, largely because past studies using native and engineered sequences had
insufficient scale. Here, we measure the expression output of >100 million synthetic yeast promoter sequences that are fully random. These sequences yield diverse, reproducible expression levels that can be explained by their chance inclusion of functional TF binding sites. We use machine learning to build interpretable models of transcriptional regulation that predict ~94% of the expression driven from independent test promoters and ~89% of the expression driven from native yeast promoter fragments. These models allow us to characterize each TF’s specificity, activity, and interactions with chromatin. TF activity depends on binding-site strand, position, DNA helical face and chromatin context. Notably, expression level is influenced by weak regulatory interactions, which confound designed-sequence studies. Our analyses show that massive-throughput assays of fully random DNA can provide the big data necessary to develop complex, predictive models of gene regulation.
Editorial summary
Gene expression levels in yeast are predicted using a massive dataset on promoters with random sequences.
Users may view, print, copy, and download text and data-mine the content in such documents, for the purposes of academic research, subject always to the full Conditions of use:http://www.nature.com/authors/editorial_policies/license.html#terms
*To whom correspondence should be addressed: [email protected] (AR) and [email protected] (CGD).
Author Contributions
C.G.D. and A.R. drafted the manuscript, with all authors contributing. C.G.D. analyzed the data. C.G.D., E.D.V., E.A., and R.S. performed the experiments. A.R. and N.F. supervised the research.
Declaration of Interests
HHS Public Access
Author manuscript
Nat Biotechnol
. Author manuscript; available in PMC 2020 June 02.Published in final edited form as:
Nat Biotechnol. 2020 January ; 38(1): 56–65. doi:10.1038/s41587-019-0315-8.
A
uthor Man
uscr
ipt
A
uthor Man
uscr
ipt
A
uthor Man
uscr
ipt
A
uthor Man
uscr
ipt
Control of gene expression by DNA-binding regulatory proteins, known as cis-regulatory logic, is a fundamental determinant of cell phenotype and cell-state transitions. Constructing models of cis-regulatory logic generally requires a training set of sequences and associated expression levels. Analysis of the expression of natural regulatory sequences has shown some success1,2, but their limited diversity and homology mean that models are easily overfit2, even when the sequences are diversified by mutagenesis3. This is likely to be a problem in human cells as well, where there may be ~100,000 active regulatory elements in any given cell type4–6. Alternatively, measuring the expression of synthetic promoters, as in a Massively Parallel Reporter Assay (MPRA), using either designed sequences7 or randomly arranged designed elements8, allows arbitrary hypothesis testing, but DNA synthesis is both limited in scale and costly. Consequently, TF binding sites (TFBSs) are often tested only in select affinities, contexts, positions, and orientations, leading to uncertain generalizability and limiting the hypotheses that can be tested. Overall, the space of possible regulatory sequences far exceeds what has been explored to date. For example, testing all pairwise TF-TF interaction spacings only once each would require ~107 sequences. Learning complex regulatory rules might require far more sequences than exist in the genome or have previously been assayed9. Given the limited scale of previous work, predictive models of expression level from sequence alone remain elusive.
We hypothesized that fully random DNA could be used to test regulatory sequences at a much larger scale than has been studied previously. Although many sequences in the full space of possibilities may not exist in any organism, the increased scale could allow us to learn complex models of gene regulation. Past experiments that have used random DNA to study gene regulation support our hypothesis. In vitro selection (or SELEX) can define the specificities10 and affinities11 of TFs by isolating the high-affinity TFBSs that are present by chance in a random DNA pool12. Random DNA has also been used to diversify regions of native promoters13, to explore translational regulation14, and to show that ~10% of random 100 bp sequences could serve as bacterial promoters15.
Although TF motifs are expected to occur frequently by chance in random DNA16, it is often tacitly assumed that functional TFBSs are rare: most TF motif instances are neither
evolutionarily conserved nor bound by experimental assays, and it remains unclear whether TFBSs require additional factors to function (e.g., site clustering or interactions with neighboring factors)17. Thus, it was unclear whether random DNA sequences could drive reproducible expression levels and span a sufficient dynamic range from which to uncover regulatory rules. Moreover, no in vivo experiments have been conducted on the massive scale required to learn the complexities of cis-regulatory logic that can both (1) predict expression given any arbitrary sequence; and (2) explain how that sequence generated the expression level with interpretable features reflecting mechanisms of gene regulation. Here, we test our hypothesis, by developing the Gigantic Parallel Reporter Assay (GPRA) to measure the expression level associated with each of tens or hundreds of millions of random DNA sequences per experiment, and used these to learn models of cis-regulatory logic in the yeast, Saccharomyces cerevisiae, grown in each of three well-characterized carbon sources. We validate our findings in the context of a rich body of knowledge, and show that GPRA is a powerful new approach to decipher gene regulation.
A
uthor Man
uscr
ipt
A
uthor Man
uscr
ipt
A
uthor Man
uscr
ipt
A
uthor Man
uscr
ipt
Results
Random DNA includes many TFBSs, yielding diverse expression
We first computationally predicted that random DNA sequences contain abundant yeast TFBSs. Consistent with previous models16, the information content (IC) of TF motifs can be used to quantify their expected frequency in DNA uniformly sampled from the four bases (“random DNA”), without the need to define a “match” (Fig. 1a, Methods). For example, of the 221 motifs from YeTFaSCo18 that we expect to represent true specificities of yeast TFs (Methods), 58% are expected on average to occur every 1,000 bp or less, and 92% to occur every 100,000 bp or less. Consequently, 80 bp of random DNA is expected to have, on average, ~138 partly overlapping TFBS instances, representing ~68 distinct factors. Thus, a library of 107 80 bp random promoter sequences (the minimum assayed per experiment; below) is expected to include >10,000 distinct examples of each TFBS for >90% of yeast TFs, with orders of magnitude more examples for most TFs (Fig. 1a).
Next, we experimentally demonstrated that random DNA yields diverse expression levels in a yeast promoter library. To robustly quantify promoter activity, we used a previously described7 episomal dual reporter system expressing a constitutive red fluorescent protein (RFP) and a variable yellow fluorescent protein (YFP). Log(YFP/RFP) measured using flow cytometry (Methods) reports an expression signal that is integrated over several generations and normalized for extrinsic noise (e.g., plasmid copy number and cell size)3,19,20 (Fig. 1b, Methods). We created ten synthetic promoter scaffolds and one based on the native ANP1 promoter sequence, each consisting of 50–80 bp of constant scaffold sequence flanking 80 bp of random DNA (−170 to −90, relative to the presumed TSS; Fig. 1c and Supplementary Fig. 1a, Methods). In all instances, the random 80-mer libraries yielded diverse expression levels, up to a ~50 fold expression range, while individual promoter clones yielded distinct expression levels (Fig. 1c and Supplementary Fig. 1a, left). When we also randomized the scaffold sequences (from −289 to −25 relative to the TSS; Methods), ~83% of random promoter sequences yielded measurable expression (Supplementary Fig. 1b). Thus, random DNA frequently contains functional TFBSs and can modulate a range of gene expression. A “gigantic” parallel reporter assay of random DNA
We implemented GPRA as a robust assay that quantifies the promoter activity of tens of millions of sequences per experiment. To facilitate validation, we tested rich media growth conditions with different carbon sources (glucose, galactose, and glycerol, Methods), where regulation is well studied. We created libraries of ~108 random promoters, transformed them into yeast, and sorted the cells by log(YFP/RFP) into 18 bins of equal intervals (Fig. 2a, Methods). We re-grew the yeast from each bin, and measured their expression distributions by flow cytometry, reproducing the original expression measurement (Fig. 2b, Methods). We sequenced the promoters in each bin and estimated each promoter’s expression level by its read distribution (Methods). Because the complexity of each promoter library (>108) was greater than the number of sorted cells (<108), 78% of promoter sequences appear in only one bin, often representing one observation (read) from one cell containing that promoter. While this leads to ~24% error in our promoter expression estimates, as assessed on held-out test data (Supplementary Fig. 2), the many more examples produced with this approach
A
uthor Man
uscr
ipt
A
uthor Man
uscr
ipt
A
uthor Man
uscr
ipt
A
uthor Man
uscr
ipt
outweigh this challenge, and yield highly informative data from which to learn rules of cis-regulation, as we show below.
Altogether, across five experiments, we measured the expression output of 102,371,025 promoter sequences with GPRA. These spanned two primary promoter libraries (each complexity > 108) containing a random 80-mer with either: (1) an upstream poly-T sequence and downstream poly-A sequence (pTpA; Fig. 1c); or (2) an upstream Abf1 site and a downstream TATA box (Abf1TATA; Supplementary Fig. 1a). We assayed both libraries with glucose as a carbon source, and the pTpA library also with either galactose or glycerol as alternate carbon sources. We sequenced 15–31 million unique promoter sequences per experiment (<30% of sorted cells; <21% of promoter sequences theoretically in each library) and 50–155 million reads per experiment, and did not reach saturation (Supplementary Fig. 3).
TF-specific effects were captured well by GPRA. Even though each specific promoter sequence is typically associated with a single observed read, aggregating signal across the library revealed relationships between binding strength and observed expression. For each yeast TF, we used position weight matrices (PWMs)18 to predict its occupancy of each promoter sequence21. Some TFs had a strong effect on expression, but explained only a small percentage of overall expression variation (e.g., Abf1, a relatively rare motif in random DNA, Supplementary Fig. 4a, left, Pearson’s r = 0.10). Others, including many zinc cluster monomeric motifs, correlated very strongly with expression (e.g., Rsc30 r=0.57;
Supplementary Fig. 4a, middle). Overall, the sum of the individual motif effects (348%) is much greater than what a simple linear model combining the motifs can explain (~47% of held-out training data; Pearson’s r2), suggesting that there is significant redundancy between
motifs. Moreover, cases where related motifs have distinct behaviors (e.g., Rsc30 and Ume6; Supplementary Fig. 4a) further highlight the need to jointly analyze TFs.
A highly predictive “Billboard” model of cis-regulation
As a more faithful joint model of TF activity, we pursued an interpretable “billboard model”22 that captures the independent actions of all TFs, but does not model their positions or pairwise interactions (Fig. 2c). This model linearly relates TF occupancy to
expression23,24, as well as captures interactions between TFs and nucleosomes (Fig. 2c; Methods). Since nucleosomes can prevent TF binding25, the model aims to infer promoter accessibility, which is used to scale the predicted occupancy of each TF (e.g., a good TFBS will remain unbound if inaccessible). However, some TFs can displace nucleosomes, indirectly modulating the binding of other TFs. This potentiation can be learned from cases where a TFBS alters expression only in the presence of another binding site that
“potentiates” the first. Since we assume potentiation is driven primarily by chromatin opening, we model potentiating TFs as contributing to a global “accessibility” value (Ω) for each promoter sequence. We scale TF binding with accessibility to reflect binding in the context of accessible chromatin, and calculate expression levels using these chromatin binding estimates and a linear model weighted by learned TF activities (Fig. 2c). To prevent TF functions from being apportioned amongst related motifs, we regularized the model to favor fewer and less information-rich motifs, and fewer potentiating and active TFs
A
uthor Man
uscr
ipt
A
uthor Man
uscr
ipt
A
uthor Man
uscr
ipt
A
uthor Man
uscr
ipt
(Methods). Once these parameters are learned, we also refine TF sequence specificities (Methods).
When trained on our GPRA data, these models explained up to 92.6% of expression variation in independent, high-quality test data (Fig. 2d). We learned a separate model for each of the four high-complexity promoter datasets: pTpA in glucose, galactose, and glycerol, and Abf1TATA in glucose. We tested each model’s ability to predict expression in an independent set of ~10,000 pTpA promoters, measured with high coverage in glucose. On these high-quality test data, the pTpA+glucose model predicted expression best (r2 = 0.926, Fig. 2d), but the galactose- and glycerol-trained pTpA models performed nearly as well (r2 = 0.904 and 0.843, respectively). This indicates that the primary contributors to gene expression in the context of random DNA are not regulated by carbon source. As further validation, we generated 1,000 new random sequences that were in silico predicted by the pTpA+glucose model to have a range of expression levels, synthesized these sequences, and measured their expression, showing strong agreement between prediction and measurements across a ~50-fold range (r2 = 0.897; Supplementary Fig. 4b). Overall, a remarkably high proportion of the variation in random promoter expression is explained by a billboard model. Moreover, our models trained on random DNA data from GPRA predicted over 85% of the variation in expression driven by sequence fragments derived from native yeast promoters (Fig. 2e). To this end, we segmented each yeast promoter into 80 bp fragments from −480 to the TSS, and assayed these in the pTpA promoter scaffold in glucose media. Surprisingly, random DNA included more high-expressing sequences than most of the native promoter fragments tested (Fig. 2d,e), except for sequences from the −120:−40 and −160:−80 regions (Supplementary Fig. 5). The pTpA+glucose billboard model, which was trained on random DNA, predicted the expression of these native yeast sequences with high correlation (Pearson r2=0.858, Fig. 2e). This shows the power of models trained on random DNA and indicates that non-billboard regulatory mechanisms are either not predominant in yeast promoters, or are context-dependent.
Billboard model correctly learns TF’s biochemical features
Because our models are biologically interpretable (“white box”), we could next assess mechanistic features, such as TF function or chromatin organization, that underlie their predictions. For example, our models, trained on expression levels of random DNA, also accurately predict chromatin accessibility in the libraries themselves and the yeast genome. First, the model predicted the experimentally-measured nucleosome occupancy in the libraries (MNase-seq; Methods; Spearman ρ = 0.54–0.55) comparably to the agreement between experimental replicates (Fig. 3a and Supplementary Fig. 6a,b). Moreover, the pattern of model-predicted accessibility when applied to the yeast genome sequence agrees well with previously measured in vivo nucleosome occupancy26,27 (Supplementary Fig. 6c). On average, the models accurately predict the promoter nucleosome-free region, and −1 and +1 nucleosomes (Fig. 3b; Methods). Thus, random sequences and expression measurements generated by GPRA are of sufficient quality to correctly infer how TFs regulate chromatin structure, without directly measuring chromatin.
A
uthor Man
uscr
ipt
A
uthor Man
uscr
ipt
A
uthor Man
uscr
ipt
A
uthor Man
uscr
ipt
The models also accurately captured biochemical TF activities, including chromatin remodeling and activator vs. repressor function. The General Regulatory Factors (GRFs; Abf1, Reb1, and Rap1), which can displace nucleosomes28–31, were predicted to open chromatin (positive potentiation scores) in all conditions tested (Fig. 3c,d). Moreover, the galactose-specific regulator Gal4 was correctly32,33 predicted to open chromatin only in galactose (Fig. 3c). TFs predicted to open chromatin only in glycerol included Hap4, Stb4, Cat8, Tec1, and Tye7 (Fig. 3d). These molecular roles are new predictions, but with strong physiological support: both Hap4 and Cat8 are over-expressed in glycerol compared to glucose34; Hap4 is a global regulator of non-fermentative media like glycerol35; Cat8 activates gluconeogenesis36,37 and Tye7 regulates glycolysis38, which are the two endpoints of glycerol metabolism39; Tec1 regulates pseudohyphal growth40,41, which is constitutive in glycerol42; and predicted Stb4 targets are enriched for having “oxidoreductase activity”18, consistent with non-fermentable carbon source metabolism. Furthermore, Hap4 and Tec1 physically interact with the Swi/Snf chromatin remodeler43,44, supporting their putative chromatin remodeling role. For glucose-trained models, model-predicted TF activities weakly agreed with GO-annotated activator/repressor status (Supplementary Fig. 7a; one-tailed hypergeometric P-values: 0.02 and 0.04), while there was no association for either galactose (P=0.34) or glycerol (P=0.79). The lack of distinction in GO annotations between activation by opening chromatin and activation by other means could explain this weak agreement. Consistent with open chromatin being more active, potentiation scores (model-predicted chromatin opening and closing ability) significantly distinguished GO-annotated activators and repressors for all models (Methods; one-tailed hypergeometric P-values: 10−3 to 2×10⁻⁵; Supplementary Fig. 7b). Thus, random sequences contain sufficient TFBSs to identify how TFs affect gene expression and chromatin, even for relatively rare motifs (e.g., GRF motifs).
Furthermore, we could learn the specificities and activities of TFs without any TFBS training data. By initializing with random PWMs and learning the motifs de novo, we trained a model (pTpA+glucose data) that was highly predictive (Pearson’s r2=94.6%; Methods). This model – with >120,000 parameters – learned many motifs that closely resemble those of known factors (e.g. the most potent chromatin-opening motifs closely resemble the GRFs; Supplementary Fig. 8a). However, it is more difficult to interpret this model, since the identity of the TFs recognizing each learned motif is unknown, and each TF may be represented by multiple motif variations or not at all.
Consequently, we allowed the models initialized with known motifs to optimize the TF motifs, yielding an improved model with refined motifs that better predict independent data. In particular, motif refinement (including adding more bases of specificity) improved the models’ predictive accuracy on the independent high-quality test data by 9–12 percentage points (e.g. from r2=80.3% to 92.2% for pTpA+glucose). The four models often modified the original motifs in similar ways, suggesting that the revised motifs more faithfully represent the TFs’ specificities (Supplementary Fig. 8b). Many of the refined motifs performed better than the originals in predicting, from DNA sequence alone, in vivo genomic binding of the cognate TF by ChIP45, and gene expression changes resulting from cognate TF perturbation46 (Fig. 3e, Supplementary Fig. 8c,d, Methods). Many motifs were indistinguishable from the originals, suggesting they maintained their cognate TFs. Of those
A
uthor Man
uscr
ipt
A
uthor Man
uscr
ipt
A
uthor Man
uscr
ipt
A
uthor Man
uscr
ipt
that differed, the vast majority were improved (Fig. 3e), including when predicting ChIP data, despite many of the original motifs being derived from this same ChIP data18. This suggests that the refined motifs often more closely represent their cognate TF specificities. Binding position, strand and helical face alter TF activity
We next adapted the model to capture how transcriptional activity is altered by TFBS position. Motif position and orientation can affect TF function, for instance, by modifying the TF’s ability to contact its biochemical target. We thus extended the billboard model with localized activity bias terms (Methods), allowing TFs to have different activities for every binding position and orientation (Fig. 4a). To encourage parameter parsimony, we added a regularization term that favored no positional preferences (Methods). This model had up to ~220 activity parameters per TF instead of one in the billboard model: ~110 locations (including flanking constant regions) and two DNA strands (Supplementary Fig. 9), adding ~55,000 parameters overall. Fitting such complex models with data of more traditional scale would be unreliable, but the examples in our dataset still outnumber parameters ~360:1. Sub-sampling analysis suggests that we minimally require millions of random sequences to learn these parameters without over-fitting, and additional data improves performance (Supplementary Fig. 10).
Capturing positional preferences significantly increased performance. Adding positional activities to the pTpA+glucose model decreased the error by ~20% for both the high-quality test data (94.3% vs. 92.6%) and the 80 bp native promoter sequences (88.6% vs. 85.8%; P<10−21 and 10−107, respectively, Fisher’s r to z transformation; Supplementary Fig. 11a,b). Predicted accessibility, which cannot be impacted by TFBS location (Supplementary Fig. 9), remained a dominant factor, explaining 90.8% of expression variation (high-quality test data; Pearson’s r2; Supplementary Fig. 11c). Adding positional activities decreased the prediction error 2-fold more than non-positional activities (38% vs. 19.6%), highlighting their
importance.
The parameters learned by our model indicated that many TFs have strong position, orientation, and helical-face preferences, and the similarity between different models suggested that they are robustly learned (Fig. 4b, Supplementary Fig. 12). Predicted activators are often stronger when located distally to the TSS (e.g., Abf1, Skn7, Mcm1; Fig. 4b, Supplementary Fig. 12a,b), while many predicted repressors are most repressive when located proximally (e.g. Ume6, Mot3; Supplementary Fig. 12c,d). Many TFBSs are strand-specific, often with a lower-than-expected distal activity for one motif orientation (e.g., Azf1, Mga1, Thi2; Fig. 4b, Supplementary Fig. 12e,f). Rarely, TFBSs can be both activating and repressing in different positions (e.g., Mga1 in minus vs. plus strand; Fig. 4b).
Some TFBSs showed strong periodicity along the promoter’s length (e.g., Mcm1, Thi2, poly-A, Azf1; Fig. 4b, Supplementary Fig. 12b,e,f), consistent with DNA helical face preferences. This was widespread: the correlations between a 10.5 bp sine wave and the learned positional biases were significantly higher than with randomized data for each model (rank sum p<10−120; AUROC=0.84–0.87; Fig. 4c, Supplementary Fig. 13a, Methods). Helical preferences tend to be strongest when TFBSs are proximal to the TSS (downstream of −150, relative the TSS). Since 150 bp is the approximate persistence length of dsDNA47,
A
uthor Man
uscr
ipt
A
uthor Man
uscr
ipt
A
uthor Man
uscr
ipt
A
uthor Man
uscr
ipt
this could reflect physical promoter constraints, where the rigidity of DNA prevents
interactions between proximal TFs and the adjacent transcriptional machinery, but flexibility increases with distance, relieving this effect. Models trained on different scaffolds
sometimes learned distinct positional parameters (e.g., Mga1, Skn7, poly-A, Mcm1; Fig. 4b, Supplementary Fig. 12b), suggesting that the surrounding context can modify positional preferences. Adding positional biases sometimes worsened the models’ ability to generalize between scaffolds, but always improved performance within a scaffold in another condition (Supplementary Fig. 13b). Overall, many TFs are predicted to have strong positional preferences (Fig. 4d).
Prevalent weak regulatory interactions explain expression
Finally, we leveraged our interpretable position-aware model to revisit an open question from previous studies that examined the impact of placing the same motif in different positions. A seminal study from Sharon et al.7 attempted to identify positional preferences of TFs by tiling each TFBS across one or few background sequences in an MPRA, but found that, with few exceptions, expression changes were largely inexplicable, depending on both the embedded motif and the background sequences7. We therefore replicated this by tiling each of six motifs with strong model-predicted positional preferences (Azf1, Mga1, Mot3, Skn7, Ume6, and the poly-A motif) at base-pair resolution in either orientation within three random sequences predicted to have intermediate expression levels, and measured
expression as before (Fig. 5a).
Our model predicted the measured expression levels well (Pearson r2=0.919; positional pTpA+glucose model, all motifs and background sequences; Fig. 5b, Supplementary Fig. 14), despite the fact that expression showed few obvious trends across embedding contexts, motifs, or motif positions (Fig. 5b, Supplementary Fig. 14), consistent with Sharon et al7. There was also no clear relationship between the expression level resulting from a motif’s embedded position (Fig. 5b) and the corresponding model-learned motif activity (Fig. 5a). Instead, deeper inspection revealed that, according to the model, most changes in expression result from the destruction and creation of many secondary TFBSs as each motif is tiled (Fig. 5d,e), with the effect of the tiled motif overwhelmed by these abundant secondarily perturbed TFBSs. This highlights how seemingly complex regulation can result from prevalent TFBSs and a simple cis-regulatory logic, rather than underlying complex mechanisms.
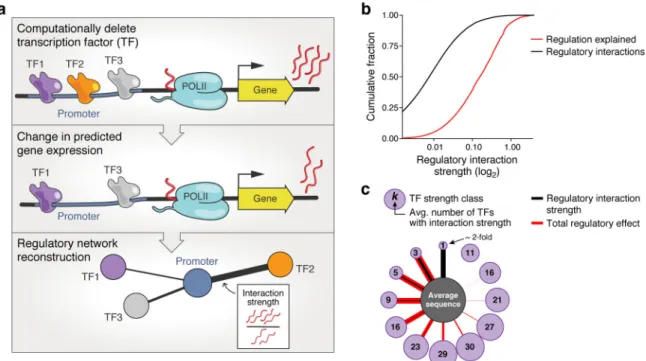
Following this observation, we queried our positional cis-regulatory model to assess how many TFs regulate a given native promoter. We quantified each TF’s contribution to the expression of each native promoter fragment by performing in silico TF “deletion” experiments, setting the concentration parameter for each TF to 0, and inspecting the predicted expression change (Fig. 6a). Although the number of regulators per promoter sequence varied, most were regulated by a surprisingly large number of factors. Strong regulatory interactions were rare: only 0.1% of possible regulatory interactions were predicted to alter expression by ≥2-fold (Fig. 6b,c – black; e.g., Supplementary Fig. 15a,b). Although these rare strong regulatory interactions explained a disproportionate amount of
A
uthor Man
uscr
ipt
A
uthor Man
uscr
ipt
A
uthor Man
uscr
ipt
A
uthor Man
uscr
ipt
expression, 94% of expression was attributed to the much more prevalent weak (< 2-fold) regulatory interactions (Fig. 6b,c – red; Supplementary Fig. 15c).
Discussion
We showed that measuring the expression output of random DNA sequences can provide data at a radically larger scale, surpassing the complexity of the human genome. This scale allows us to learn complex interpretable models with remarkable predictive power and determine the roles played by the cell’s entire complement of TFs with a simple and inexpensive experiment. Using these data, we refined models of TF specificities, and identified activators, repressors, chromatin remodeling TFs, and condition-specific
regulators. Most TFs have strand, location, and helical face preferences (Fig. 4d), which can be modified by the surrounding sequence/chromatin context (Fig. 4b), demonstrating that cis-regulatory logic can be highly complex.
Transferring the rules learned from such reporter assays to arbitrary contexts will be a subject of future studies. We expect that more will be learned from our data: for example, a deep convolutional neural net trained on GPRA data explained ~96% of expression variation of our high-quality test data (E.D.V., unpublished results), a 30% reduction in error.
Using random DNA to study cis-regulatory logic in vivo is a highly accessible approach, which facilitates assaying massive libraries at unprecedented scale, and learning complex models with many parameters. While designed sequences can be used to test specific hypotheses, random DNA is useful for analyzing anything that occurs reasonably often by chance, even if uncommon in the genome or not anticipated in advance. For instance, one could ask how G-quadruplex motifs affect expression (we saw no effect; data not shown). Further, learning an element’s effect from thousands of examples with diverse affinities, positions, orientations, and surrounding sequence contexts is likely to be more generalizable than the “designed” approach, where a few elements are introduced into several locations. In particular, we show that the common “controlled” experiment of modifying one particular cis-regulatory parameter (e.g., TFBS location) is inadvertently confounded by introducing or destroying many secondary elements whose combined effect can mask the element being studied (Fig. 5). Furthermore, any trend observed with this designed strategy could be explained by the action of another TF with a related specificity. Such inadvertently included TFBSs may also confound sequences designed for engineering purposes. In contrast, random DNA provides the diverse examples needed to learn complex regulatory logic: jointly modeling the many variables that simultaneously affect expression can separate each variable’s effect, and selecting a random DNA sequence with the desired predicted
expression level provides an alternative for promoter design.
Our results suggest that regulatory networks are more interconnected than previously assumed (Fig. 6). We showed that random DNA has diverse expression levels (Fig. 1) that can be explained by TF binding (Fig. 2), which regulate expression primarily through weak interactions (Fig. 6) that, in turn, can easily be perturbed when tiling a motif across a sequence (Fig. 5). Although low-affinity TFBSs have been shown in aggregate to alter
A
uthor Man
uscr
ipt
A
uthor Man
uscr
ipt
A
uthor Man
uscr
ipt
A
uthor Man
uscr
ipt
expression48 and the prevalence of TFBSs was predicted by biochemistry and information theory16, weak regulatory interactions have largely been ignored. Most studies focus on the strongest interactions that explain most gene expression variation. To explain expression levels we must also account for these abundant weak effects, which, individually, are likely easily masked by experimental noise and secondary effects when studying endogenous gene regulation. Regulatory variants may contribute to phenotype by cascades of regulatory changes through highly interconnected networks49,50, and abundant weak regulatory interactions suggest a mechanism for this interconnectedness. Although a highly-predictive yeast model underlies our results, the human genome encodes more similarly low
information content TFs and has more regulatory DNA (promoters and enhancers), providing more opportunity for weak interactions.
The prevalence of functional TFBSs in random DNA and its demonstrated ability to modulate expression has evolutionary implications. In some cases when genes are created, the DNA-encoded regulatory program must arise de novo. Random sequences have been shown to yield functioning bacterial promoters ~10% of the time15. In yeast, we found ~83% of promoter sequences with both random scaffold and insert expressed. Therefore, evolving regulatory sequences from previously non-regulatory DNA may be comparatively straightforward. Creating new mammalian enhancers may be similarly likely since
mammalian TFs have, on average, even less specificity than in yeast16. Over evolutionary time, further mutations can optimize the specificity and effect of these novel regulatory sequences.
When using GPRA, researchers will have to consider the scale needed for their question of interest. Since TFBSs occur with different frequencies (Fig. 1a), more data are needed for rare TFBSs. The activity and potentiation parameters for each TF converged with ~100,000 promoter examples (Supplementary Fig. 10). Conversely, millions of promoter examples were required for refining or learning new motifs, and for finding position and orientation-specific activities (Supplementary Fig. 10). Since arbitrary pairs of orientation-specific TFBSs are inherently rare in random DNA, learning all possible TF-TF interactions with GPRA, especially when considering competition (where both binding sites must be high-affinity), may require much larger datasets. Although mammalian gene regulation is more complex, GPRA could provide the “big data” that would allow learning models to explain how genetic variation affects gene expression and disease risk.
Supplementary Material
Refer to Web version on PubMed Central for supplementary material.
Acknowledgments
We thank Rani Nelken, Joshua Weinstein, Atray Dixit, Brian Cleary, Karthik Shekhar, and Umut Eser for analysis advice; Christoph Muus, Brian Cleary, Atray Dixit, Yaara Oren, Thouis Jones, Luca Mariani, Karthik Shekhar, Justin B. Kinney, David M. McCandlish, and Jeff Vierstra for feedback on the manuscript; Toni Delorey, Jenna Pfiffner, and Caleb Bashor for experimental advice; Leslie Gaffney and Anna Hupalowska for help with figures; Patricia Rogers for cell sorting; and Eran Segal for the dual reporter yeast vector. CGD was supported by a Fellowship from the Canadian Institutes for Health Research and by the NIH (K99-HG009920-01). EDV was supported by the MIT Presidential Fellowship. Work was supported by the Klarman Cell Observatory, NHGRI
A
uthor Man
uscr
ipt
A
uthor Man
uscr
ipt
A
uthor Man
uscr
ipt
A
uthor Man
uscr
ipt
Center of Excellence in Genome Science (CEGS), HHMI (AR), and the Israel Science Foundation ICORE on Chromatin and RNA in Gene Regulation (NF).
References
1. Beer MA & Tavazoie S Predicting gene expression from sequence. Cell 117, 185–198 (2004). [PubMed: 15084257]
2. Yuan Y, Guo L, Shen L & Liu JS Predicting gene expression from sequence: a reexamination. PLoS computational biology 3, e243 (2007). [PubMed: 18052544]
3. Kinney JB, Murugan A, Callan CG Jr. & Cox EC Using deep sequencing to characterize the biophysical mechanism of a transcriptional regulatory sequence. Proceedings of the National Academy of Sciences of the United States of America 107, 9158–9163 (2010). [PubMed: 20439748]
4. van Arensbergen J et al. Genome-wide mapping of autonomous promoter activity in human cells. Nature biotechnology 35, 145–153 (2017).
5. Muerdter F et al. Resolving systematic errors in widely used enhancer activity assays in human cells. Nature methods 15, 141–149 (2018). [PubMed: 29256496]
6. Wang X et al. High-resolution genome-wide functional dissection of transcriptional regulatory regions and nucleotides in human. Nature communications 9, 5380 (2018).
7. Sharon E et al. Inferring gene regulatory logic from high-throughput measurements of thousands of systematically designed promoters. Nature biotechnology 30, 521–530 (2012).
8. Gertz J, Siggia ED & Cohen BA Analysis of combinatorial cis-regulation in synthetic and genomic promoters. Nature 457, 215–218 (2009). [PubMed: 19029883]
9. Hughes TR & de Boer CG Mapping yeast transcriptional networks. Genetics 195, 9–36 (2013). [PubMed: 24018767]
10. Jolma A et al. DNA-binding specificities of human transcription factors. Cell 152, 327–339 (2013). [PubMed: 23332764]
11. Nutiu R et al. Direct measurement of DNA affinity landscapes on a high-throughput sequencing instrument. Nature biotechnology 29, 659–664 (2011).
12. Oliphant AR, Brandl CJ & Struhl K Defining the sequence specificity of DNA-binding proteins by selecting binding sites from random-sequence oligonucleotides: analysis of yeast GCN4 protein. Molecular and cellular biology 9, 2944–2949 (1989). [PubMed: 2674675]
13. Horwitz MS & Loeb LA Promoters selected from random DNA sequences. Proceedings of the National Academy of Sciences of the United States of America 83, 7405–7409 (1986). [PubMed: 3532112]
14. Cuperus JT et al. Deep learning of the regulatory grammar of yeast 5’ untranslated regions from 500,000 random sequences. Genome research (2017).
15. Yona AH, Alm EJ & Gore J Random sequences rapidly evolve into de novo promoters. Nature communications 9, 1530 (2018).
16. Wunderlich Z & Mirny LA Different gene regulation strategies revealed by analysis of binding motifs. Trends in genetics : TIG 25, 434–440 (2009). [PubMed: 19815308]
17. Arnosti DN & Kulkarni MM Transcriptional enhancers: Intelligent enhanceosomes or flexible billboards? J Cell Biochem 94, 890–898 (2005). [PubMed: 15696541]
18. de Boer CG & Hughes TR YeTFaSCo: a database of evaluated yeast transcription factor sequence specificities. Nucleic acids research 40, D169–179 (2012). [PubMed: 22102575]
19. Kosuri S et al. Composability of regulatory sequences controlling transcription and translation in Escherichia coli. Proceedings of the National Academy of Sciences of the United States of America 110, 14024–14029 (2013). [PubMed: 23924614]
20. Shalem O et al. Systematic dissection of the sequence determinants of gene 3’ end mediated expression control. PLoS genetics 11, e1005147 (2015). [PubMed: 25875337]
21. Granek JA & Clarke ND Explicit equilibrium modeling of transcription-factor binding and gene regulation. Genome biology 6, R87 (2005). [PubMed: 16207358]
A
uthor Man
uscr
ipt
A
uthor Man
uscr
ipt
A
uthor Man
uscr
ipt
A
uthor Man
uscr
ipt
22. Kulkarni MM & Arnosti DN Information display by transcriptional enhancers. Development 130, 6569–6575 (2003). [PubMed: 14660545]
23. Bussemaker HJ, Li H & Siggia ED Regulatory element detection using correlation with expression. Nature genetics 27, 167–171 (2001). [PubMed: 11175784]
24. Conlon EM, Liu XS, Lieb JD & Liu JS Integrating regulatory motif discovery and genome-wide expression analysis. Proceedings of the National Academy of Sciences of the United States of America 100, 3339–3344 (2003). [PubMed: 12626739]
25. Liu X, Lee CK, Granek JA, Clarke ND & Lieb JD Whole-genome comparison of Leu3 binding in vitro and in vivo reveals the importance of nucleosome occupancy in target site selection. Genome research 16, 1517–1528 (2006). [PubMed: 17053089]
26. Zhang Z et al. A packing mechanism for nucleosome organization reconstituted across a eukaryotic genome. Science 332, 977–980 (2011). [PubMed: 21596991]
27. Hesselberth JR et al. Global mapping of protein-DNA interactions in vivo by digital genomic footprinting. Nature methods 6, 283–289 (2009). [PubMed: 19305407]
28. Bernstein BE, Liu CL, Humphrey EL, Perlstein EO & Schreiber SL Global nucleosome occupancy in yeast. Genome biology 5, R62 (2004). [PubMed: 15345046]
29. Hartley PD & Madhani HD Mechanisms that specify promoter nucleosome location and identity. Cell 137, 445–458 (2009). [PubMed: 19410542]
30. Ganapathi M et al. Extensive role of the general regulatory factors, Abf1 and Rap1, in determining genome-wide chromatin structure in budding yeast. Nucleic acids research 39, 2032–2044 (2011). [PubMed: 21081559]
31. Levo M et al. Systematic Investigation of Transcription Factor Activity in the Context of
Chromatin Using Massively Parallel Binding and Expression Assays. Molecular cell 65, 604–617 e606 (2017). [PubMed: 28212748]
32. Axelrod JD, Reagan MS & Majors J GAL4 disrupts a repressing nucleosome during activation of GAL1 transcription in vivo. Genes & development 7, 857–869 (1993). [PubMed: 8491382] 33. Morse RH Nucleosome disruption by transcription factor binding in yeast. Science 262, 1563–
1566 (1993). [PubMed: 8248805]
34. Roberts GG & Hudson AP Transcriptome profiling of Saccharomyces cerevisiae during a transition from fermentative to glycerol-based respiratory growth reveals extensive metabolic and structural remodeling. Mol Genet Genomics 276, 170–186 (2006). [PubMed: 16741729] 35. Forsburg SL & Guarente L Identification and characterization of HAP4: a third component of the
CCAAT-bound HAP2/HAP3 heteromer. Genes & development 3, 1166–1178 (1989). [PubMed: 2676721]
36. Hedges D, Proft M & Entian KD CAT8, a new zinc cluster-encoding gene necessary for derepression of gluconeogenic enzymes in the yeast Saccharomyces cerevisiae. Molecular and cellular biology 15, 1915–1922 (1995). [PubMed: 7891685]
37. Haurie V et al. The transcriptional activator Cat8p provides a major contribution to the
reprogramming of carbon metabolism during the diauxic shift in Saccharomyces cerevisiae. The Journal of biological chemistry 276, 76–85 (2001). [PubMed: 11024040]
38. Sato T et al. The E-box DNA binding protein Sgc1p suppresses the gcr2 mutation, which is involved in transcriptional activation of glycolytic genes in Saccharomyces cerevisiae. FEBS letters 463, 307–311 (1999). [PubMed: 10606743]
39. Grauslund M & Ronnow B Carbon source-dependent transcriptional regulation of the
mitochondrial glycerol-3-phosphate dehydrogenase gene, GUT2, from Saccharomyces cerevisiae. Can J Microbiol 46, 1096–1100 (2000). [PubMed: 11142398]
40. Madhani HD & Fink GR Combinatorial control required for the specificity of yeast MAPK signaling. Science 275, 1314–1317 (1997). [PubMed: 9036858]
41. Gavrias V, Andrianopoulos A, Gimeno CJ & Timberlake WE Saccharomyces cerevisiae TEC1 is required for pseudohyphal growth. Mol Microbiol 19, 1255–1263 (1996). [PubMed: 8730867] 42. Cullen PJ & Sprague GF Jr. Glucose depletion causes haploid invasive growth in yeast.
Proceedings of the National Academy of Sciences of the United States of America 97, 13619– 13624 (2000). [PubMed: 11095711]
A
uthor Man
uscr
ipt
A
uthor Man
uscr
ipt
A
uthor Man
uscr
ipt
A
uthor Man
uscr
ipt
43. Neely KE, Hassan AH, Brown CE, Howe L & Workman JL Transcription activator interactions with multiple SWI/SNF subunits. Molecular and cellular biology 22, 1615–1625 (2002). [PubMed: 11865042]
44. Kim TS, Kim HY, Yoon JH & Kang HS Recruitment of the Swi/Snf complex by Ste12-Tec1 promotes Flo8-Mss11-mediated activation of STA1 expression. Molecular and cellular biology 24, 9542–9556 (2004). [PubMed: 15485921]
45. Harbison CT et al. Transcriptional regulatory code of a eukaryotic genome. Nature 431, 99–104 (2004). [PubMed: 15343339]
46. Hibbs MA et al. Exploring the functional landscape of gene expression: directed search of large microarray compendia. Bioinformatics 23, 2692–2699 (2007). [PubMed: 17724061]
47. Bednar J et al. Determination of DNA persistence length by cryo-electron microscopy. Separation of the static and dynamic contributions to the apparent persistence length of DNA. J Mol Biol 254, 579–594 (1995). [PubMed: 7500335]
48. Tanay A Extensive low-affinity transcriptional interactions in the yeast genome. Genome research 16, 962–972 (2006). [PubMed: 16809671]
49. Boyle EA, Li YI & Pritchard JK An Expanded View of Complex Traits: From Polygenic to Omnigenic. Cell 169, 1177–1186 (2017). [PubMed: 28622505]
50. Liu X, Li YI & Pritchard JK Trans Effects on Gene Expression Can Drive Omnigenic Inheritance. Cell 177, 1022–1034 e1026 (2019). [PubMed: 31051098]
A
uthor Man
uscr
ipt
A
uthor Man
uscr
ipt
A
uthor Man
uscr
ipt
A
uthor Man
uscr
ipt
Figure 1. GPRA.
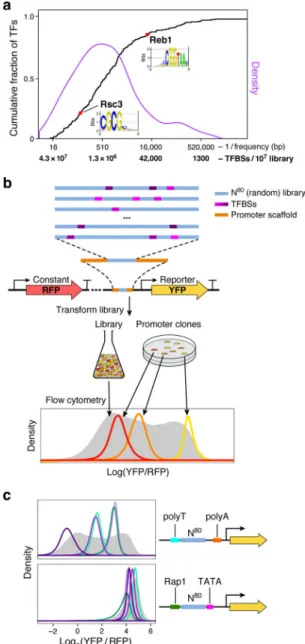
(a) TFBSs are common in random DNA. Cumulative distribution function (CDF; black) and density (purple) of the expected frequency of yeast TF motifs in random DNA. The expected number of TFBSs in a library of 107 random 80 bp promoters corresponding to each frequency is also indicated on the x axis. For instance, the relatively high information content (IC=14.59) yeast Reb1 motif is expected to occur on average once every ~12,000 bp in random DNA, while Rsc3 (IC=7.78) should occur every ~110 bp. (b) GPRA overview. From top: A library of random DNA sequences (N80 here, blue) is inserted within a promoter scaffold (orange) in front of a reporter (yellow arrow). By chance, the random sequences include many TFBSs (purple). When grown in yeast, the library would yield a broad distribution of expression levels (grey, bottom) as measured by flow cytometry, where each promoter clone would have a distinctive expression distribution (red, orange, yellow). (c) Random DNA yields diverse expression levels. For each promoter scaffold (right) shown
A
uthor Man
uscr
ipt
A
uthor Man
uscr
ipt
A
uthor Man
uscr
ipt
A
uthor Man
uscr
ipt
are the expression distributions measured by flow cytometry (left) for the entire library (gray filled curves) and for a few selected clones, each from a different single promoter from each library (colored line curves).
A
uthor Man
uscr
ipt
A
uthor Man
uscr
ipt
A
uthor Man
uscr
ipt
A
uthor Man
uscr
ipt
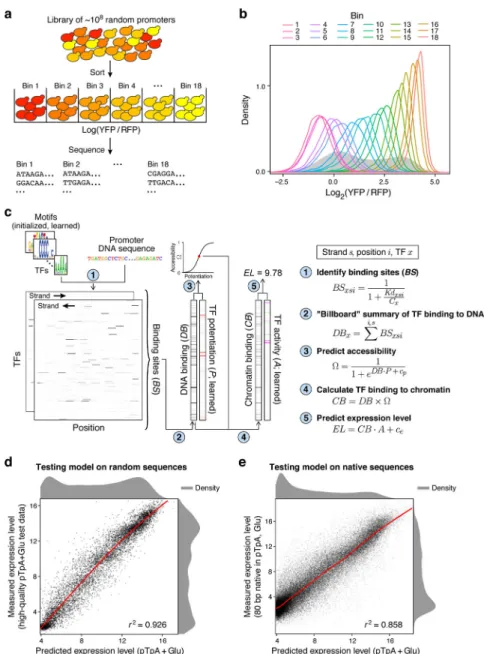
Figure 2. Expression models learned from a GPRA of 108 random promoters are highly predictive.
(a) Experimental strategy. Yeast GPRA library is sorted into 18 bins by the YFP/RFP ratio of the reporter (top) and the GPRA promoters in each bin are sequenced (bottom). (b) Reproducibility of expression levels. Expression distributions (log2(YFP/RFP)) for cells
from each bin (color code, top), after sorting as in (a), which were regrown and re-assayed by flow cytometry. Expression distribution maintains the initial bin ranking. (c)
Computational “billboard” model. Shown is a real example of the pTpA+glucose model predicting expression on a real DNA sequence (binding sites are smoothed over 8 bp for visualization purposes). Left: The model first scans each promoter DNA sequence with each PWM motif (1) to estimate a Kd for each TF at each strand and position (Kdxsi) and,
through Michaelis-Menten binding using a learned concentration parameter (Cx), it
estimates TF occupancy for every position and DNA strand. Next (2), it sums across positions and strands to estimate a single DNA binding amount per TF. Middle: The model
A
uthor Man
uscr
ipt
A
uthor Man
uscr
ipt
A
uthor Man
uscr
ipt
A
uthor Man
uscr
ipt
learns a potentiation value for each TF (3), which, by pairwise multiplication with the estimated DNA binding and addition of a bias term (cp), is used to infer the accessibility of
each DNA sequence (Ω). The DNA binding vector is re-scaled (4) by the accessibility to estimate TF binding in chromatin. Right: Chromatin binding is pairwise multiplied by learned activity parameters (5), capturing how the binding of each TF alters expression, and summed, including a bias term (ce), to yield an estimated expression level for the promoter.
(d,e) Accurate prediction of expression from new random DNA and native yeast promoter sequences. Model-predicted expression (EL; pTpA+Glu; x axis) vs. actual expression level (y axis; log(YFP/RFP) sorting bins) for (d) high-quality random 80 bp test data in the pTpA promoter scaffold, grown in glucose, and (e) native yeast promoter sequences, divided into 80 bp fragments and tested in the pTpA promoter scaffold, grown in glucose. (n = 9,982 and 70,924 promoters for (d) and (e), respectively). Pearson’s r2 shown at bottom right. Red lines: Generalized Additive Model lines of best fit.
A
uthor Man
uscr
ipt
A
uthor Man
uscr
ipt
A
uthor Man
uscr
ipt
A
uthor Man
uscr
ipt
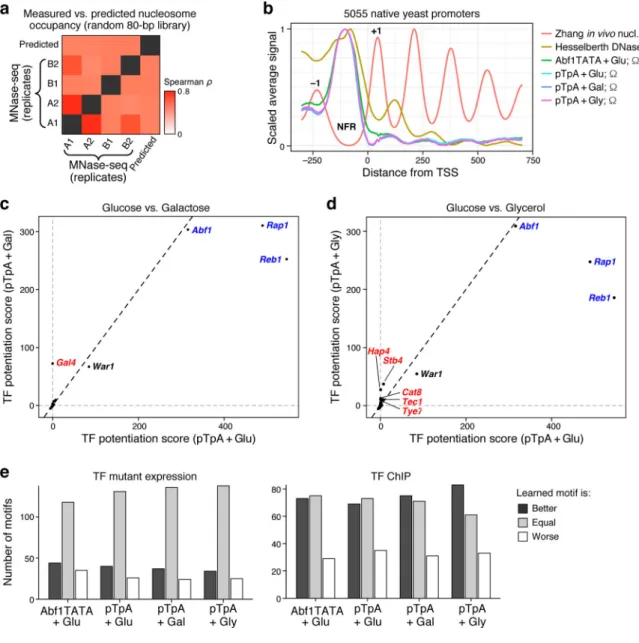
Figure 3. Billboard models learn biochemical activities of TFs.
(a,b) Model correctly predicts chromatin accessibility. (a) Pairwise Spearman correlations (color) between model-predicted nucleosome occupancy (1 - Ω) and in vivo nucleosome occupancy measured by MNase-Seq (n = 4 biological replicates of n = 2 independent library subsets). (b) Average in vivo nucleosome occupancy (Zhang), DNase I hypersensitivity (representing accessibility; Hesselberth), and model-predicted accessibility (1 - Ω) for each of the four billboard models surrounding the TSS. Each dataset is scaled. +1 and −1 nucleosome positions, and promoter Nucleosome Free Region (NFR) are indicated. (c,d) TFs with predicted chromatin-opening ability. Shown is the predicted chromatin opening (potentiation) ability for each TF (dot) for pTpA models trained in glucose (x axes) vs. either (c) galactose or (d) glycerol (y axes). Blue: GRFs with known chromatin opening ability in all conditions; red: known and putative carbon source-specific regulators. (e) Models improve TF motifs. The number of TFBS motifs (y axis) for which the model-refined motif predicted gene expression changes (TF mutant, left) or TF binding (ChIP,
A
uthor Man
uscr
ipt
A
uthor Man
uscr
ipt
A
uthor Man
uscr
ipt
A
uthor Man
uscr
ipt
right) are better (dark gray), worse (white), or equal (light gray) to the original motifs, for each of the four models (x axis), where “better” and “worse” motifs are reproducibly so in at least 95% of random subsamples of the data (Methods).
A
uthor Man
uscr
ipt
A
uthor Man
uscr
ipt
A
uthor Man
uscr
ipt
A
uthor Man
uscr
ipt
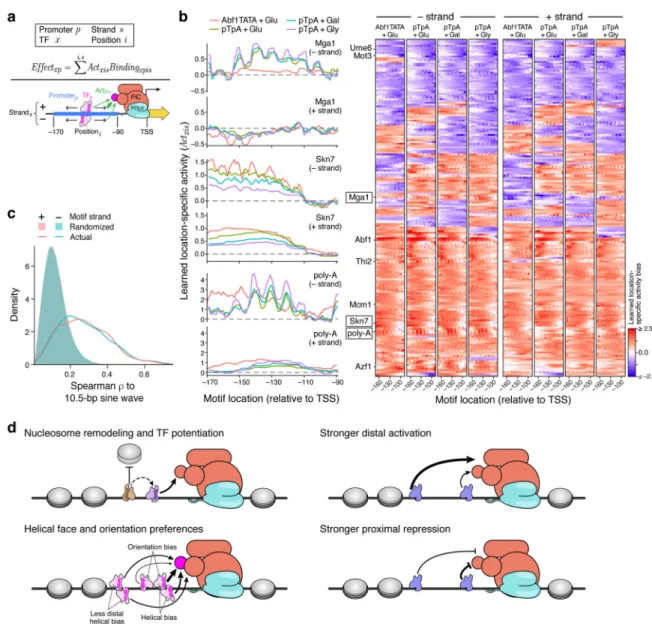
Figure 4. Position, orientation, and helical face preferences among yeast TFs.
(a) Model with position and orientation-specific activities. For each TF (x), the model learns parameters for how much binding site position (i) and strand (s) within the promoter affect transcriptional activity (Actxis). The total effect of a TF (Effectxp) is thus the sum of
products of the position-specific activities (Actxis) and TF occupancies (Bindingxpis) at the
promoter (p), across all positions and both strands. For example, this could reflect the TF’s ability to contact the transcriptional pre-initiation complex (PIC). (b) Motif position and orientation effects on expression. Left: Each plot shows the learned activity parameter values (y axis) for motifs in each position (x axis) and strand orientation (upper and lower panels) for each model (colors). Right: Position-specific activity biases (color) for each TF (rows) at each position (columns) for minus (left half) and plus (right half) strand orientations for each of the four models (four subpanels). Only TFs for which all models retained the motif are shown. (c) Helical face preferences. Distribution of Spearman ρ between a 10.5 bp sine wave and the learned position-specific activity weights (as in Supplementary Fig. 13a) for plus strand (pink line) and minus strand (blue line) or with corresponding randomized data
A
uthor Man
uscr
ipt
A
uthor Man
uscr
ipt
A
uthor Man
uscr
ipt
A
uthor Man
uscr
ipt
(pink and blue shaded areas) for all four models. (d) Model of cis-regulatory logic. TFs display a variety of activity types. Some TFs potentiate the activity of other TFs by modulating nucleosome occupancy (upper left). Activators tend to have a greater effect on transcription when bound distally within the promoter (upper right), while repressors have the greatest effect when bound proximally (lower right). Many TFs show differential activity depending on the helical face or orientation of the TFBS, presumably through interaction with other factors bound nearby (lower left).
A
uthor Man
uscr
ipt
A
uthor Man
uscr
ipt
A
uthor Man
uscr
ipt
A
uthor Man
uscr
ipt
Figure 5. Inadvertent perturbation of abundant secondary TFBSs confounds TFBS tiling experiments.
(a–e) Mga1 motifs were inserted into a common background sequence at every possible position (common x axis) for both the - strand (left) or + strand (right). (a) Position-specific activity parameters (y axis) learned for the Mga1 motif by the pTpA+glucose model (i.e., how the Mga1 motif alters expression based on the location of its binding site). (b) Model correctly predicts expression despite little correspondence to the position-specific activity of the Mga1 motif. Measured (black) and predicted (red) expression levels for Mga1 motif-tiling sequences. (c) Most expression differences between sequences are attributed to changes in accessibility. Predicted accessibility (Ω; y axis) for Mga1 motif-tiling sequences. (d,e) Expression changes are explained by perturbation of prevalent TFBSs when tiling the motif. Changes in potentiation score (d) and expression (e) attributable to perturbed TF binding for numerous diverse factors (rows) when tiling the Mga1 motif at each position (x axis). The dissimilarity between the rows indicates minimal redundancy between factors.
A
uthor Man
uscr
ipt
A
uthor Man
uscr
ipt
A
uthor Man
uscr
ipt
A
uthor Man
uscr
ipt
Figure 6. Abundant weak regulatory interactions explain most of expression level.
(a) Analysis overview. A computational “TF knock-out experiment” is performed with the learned cis-regulatory model for each TF: we use the complete model (pTpA+Glu
positional; top) and that model with that TF “deleted” (setting its concentration parameter to 0; middle) to predict expression for each 80 bp fragment of native yeast promoter DNA. Bottom: The resulting difference in predicted expression is used to define a regulatory interaction strength (edge) between that TF and DNA sequence; these are used to build regulatory networks for all sequences and TFs. (b,c) Aggregation of weak regulatory effects contributes more to expression than strong interactions. (b) Cumulative distributions (y axis) of the number of regulatory interactions (black) and fraction of regulation explained (i.e. fraction of the cumulative sum of all interaction strengths; red) for each regulatory interaction strength (x axis). The magnitude (and not the sign) of the interaction strength is considered. Because the y axis is scaled to 1, this is equivalent to the average distribution across all native sequence fragments. (c) Regulatory interaction network summary for an “average” sequence. Regulatory interactions were grouped by the strength of the regulatory interaction (thickness of black edges) into different strength classes (purple nodes), with the average number of TFs in that class indicated in the circle. The overall effect on expression, accounting for all TFs in each regulatory interaction strength class, is indicated in red (thickness of red edges). Although there are >2-fold regulatory interactions, these are too rare to be shown here (<1 per sequence).