aPresent address: ETH Zürich, Computer Vision Laboratory, Sternwartstrasse 7, CH-8092 Zürich, Switzerland.
*Corresponding author: Marjan Sedighi Gilani, Empa, Swiss Federal Laboratories for Materials Science and Technology, Applied Wood Laboratory, Überlandstrasse 129, CH-8600 Dübendorf, Switzerland, e-mail: [email protected]
Markus Heeb and Francis Willis Mathew Robert Schwarze: Empa, Swiss Federal Laboratories for Materials Science and Technology, Applied Wood Laboratory, Überlandstrasse 129, CH-8600 Dübendorf, Switzerland
Jürg Neuenschwander, Roman Furrer and Sergio J. Sanabria: Empa, Swiss Federal Laboratories for Materials Science and Technology, Reliability Science and Technology Laboratory, Überlandstrasse 129, CH-8600 Dübendorf, Switzerland
Berend C. Stoel: Division of Image Processing, Department of Radiology, Leiden University Medical Center, Leiden, The Netherlands
Marjan Sedighi Gilani*, Jürg Neuenschwander, Markus Heeb, Roman Furrer,
Sergio J. Sanabria
a, Berend C. Stoel and Francis Willis Mathew Robert Schwarze
Influence of incubation time on the vibration
and mechanic properties of mycowood
DOI 10.1515/hf-2015-0128
Received June 4, 2015; accepted October 20, 2015; previously published online November 19, 2015
Abstract: The goal of the current study was to investigate the physical and mechanical properties of mycowood as a high quality tone-wood, obtained from Norway spruce by treatment of the white rot fungus Physisporinus vitreus as a function of the treatment time. In focus was the stiffness to weight ratio, which is often considered a main criterion for tone-wood selection. The vibro-mechanical properties were tested by non-destructive methods. The change of color and density were also measured after 4–12 months of fungal incubation. Density decreased up to 5% after 12 months of fungal treatment. Sound velocity was meas-ured in small size specimens by means of the free-free vibration approach, while in large specimens the air-cou-pled ultrasound method was applied. The two techniques gave similar results and indicated that the sound velocity decreased in mycowood. Internal damping was increased in mycowood to a higher extent than the reduction in the specific modulus of elasticity (E/ρ) and thus the sound velocity in the material. The sound velocity was decreas-ing with increasdecreas-ing incubation times and scatterdecreas-ing of data with this regard was larger in the transversal than in the longitudinal direction. The sound radiation coef-ficient and the characteristic impedance were enhanced
in mycowood and its color was more brownish and richer in tone.
Keywords: air-coupled ultrasonics, colorimetery, internal damping (tanδ), mycowood, non-contact vibration, specific modulus of elasticity (E/ρ), tonal index, X-ray densitometry
Introduction
The exceptional position of wood in instrument making is due to its specific vibrational, mechanical, and esthetic properties. High sound velocity, which is related to the stiffness to density ratio, and also a small internal damping (tanδ) are the most important criteria for high quality tone-wood. The link between these criteria and the acoustics and sound quality of a music instrument have been discussed in different textbooks and review papers for many years (Bucur 1987; Wegst 2006) but several points are still discussed controversially. Despite the find-ings that low damping of wood is required for better sound quality, there are luthiers and tone-wood retailers who believe that a high damping results in a more mellow and warm sound of the instrument. “Haselfichte”, a special resonance wood obtained from Norway spruce wood, has an exclusive place in violin craftsmanship, and it is known to have a significantly lower sound velocity than other sources of Norway spruce tone-wood (Bucur 1987).
The wood components, cellulose, hemicelluloses, and lignin, and their close 3D networking define the physical, hygro-thermal, mechanical, and vibrational properties. Thus, a controlled alteration of the wood supramolecular structure influences these properties. Modification by heat (Pfriem et al. 2007; Ganne-Chédeville et al. 2012; Hill et al. 2012) or chemical treatments (Yano et al. 1994) result in the change or removal of some parts of the cell walls. It was demonstrated that treatment of Norway spruce wood with the white rot fungus Physisporinus (P) vitreus improves its tonal properties for violin making, by reducing the density at a higher rate than the stiffness, while the damping factor is also elevated by this treatment (Schwarze et al. 2008; Schwarze and Schubert 2011). In a blind test in 2009,
Matthew Trusler, a British violinist, played modern violins made from untreated and fungal treated wood and also a Stradivarius made in 1711. A jury of experts, and also most of the audience, thought that one of the violins made of mycowood was the Stradivarius (Anon 2009).
The objective of the present article was to study the impact of P. vitreus on the vibro-mechanical behavior of Norway spruce wood as a function of incubation time and the size of the treated specimens. Wood specimens were selected from both high quality tone-wood and also normal wood, which served for comparison, while the incubation with P. vitreus lasted for 4–12 months. The sound velocity in thin wood plates was measured by an ultrasonic sound velocity setup and the data compared with that obtained on small beam elements in free-free vibration tests. The density distributions and color properties of the samples were also considered as relevant parameters. The expecta-tion is that the relaexpecta-tionship between the incubaexpecta-tion time and vibro-mechanical properties of mycowood can be more reliably estimated than hitherto.
Materials and methods
Sample preparation and fungal treatment: Specimens were excised from normal Norway spruce wood (NW), which was used for laboratory
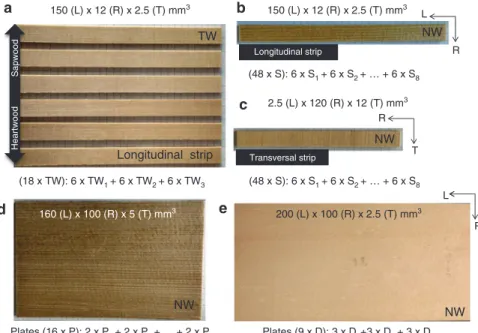
tests (from 4 different trees), and master grade tone-wood (TW) from a tree felled in 2009, in Sufers, Switzerland. One hundred and fourteen specimens with dimensions of 150 (L) × 12 (R) × 2.5 (T) mm3, i.e.
longi-tudinal strips (48 from NW and 18 from TW) and of 2.5 (L) × 120 (R) × 12 (T) mm3, i.e. transversal strips (48 from NW) were prepared for
free-free vibration tests of beam elements at the first natural frequency. Sixteen plates were also prepared from NW with dimensions of 160 (L) × 100 (R) × 5 (T) mm3 for air-coupled sound velocity measurements
and 9 plates of 200 (L) × 100 (R) × 2.5 (T) mm3 for X-ray densitometry.
Specimens were sterilized with ethylene oxide, and then incubated with P. vitreus colonized “feeder” blocks of beech (Fagus sylvatica). The specimens from different tone-wood planks (TW1,2,3) were
incu-bated for 6, 9, and 12 months. The other strip specimens (S) and plates for ultrasonic tests (P) were divided in eight groups (S and P1, 2, …, 8)
and incubated for 4, 5, …, 9, 10 and 12 months. In addition, plates for X-ray densitometry (D) were divided in three groups (D1,2,3) and
incu-bated for 6, 8, and 12 months. Figure 1 shows the dimensions, number, and the abbreviations of the specimens. At the end of each incubation period, specimens were cleaned with a brush, sterilized with ethyl-ene oxide and dried at 50°C for 1 week, in order to reach an equilib-rium in desorption. Afterward, they were stored in a climatic chamber (65% RH at 20°C), while their masses were measured frequently until they reached equilibrium (4 weeks approximately). For simplicity, all measurements were performed in the climatic chamber, assuming that the quantity of bound water in both modified and control wood is similar. However, fungal treatment changes the moisture adsorption because of the capillary voids developed in mycowood (Sedighi Gilani and Schwarze 2015); i.e. mycowood retains more moisture under the same humidity conditions. This means, the absolute mass loss (ML) and density reduction, can be more significant at RH < 65%.
Experiments were repeated before and after fungal treatment, while the time between these two measurement campaigns was
Sapwood Heartwood (18 x TW): 6 x TW1 + 6 x TW2 + 6 x TW3 Longitudinal strip Transversal strip (48 x S): 6 x S1 + 6 x S2 + … + 6 x S8 (48 x S): 6 x S1 + 6 x S2 + … + 6 x S8 Plates (16 x P): 2 x P1 + 2 x P2 + … + 2 x P8 Plates (9 x D): 3 x D1+3 x D2 + 3 x D3 Longitudinal strip R L T R R L TW NW NW NW NW 160 (L) x 100 (R) x 5 (T) mm3 150 (L) x 12 (R) x 2.5 (T) mm3 150 (L) x 12 (R) x 2.5 (T) mm3 2.5 (L) x 120 (R) x 12 (T) mm3 200 (L) x 100 (R) x 2.5 (T) mm3 a b c e d
Figure 1: Dimensions of the specimens, the number of experiments and abbreviations, (a) tone-wood (TW) samples, (b) the S longitudi-nal specimens from NW and (c) transversal specimens from NW. On a, b, and specimens free-free vibration tests were performed at the first natural frequency, (d) plate specimens for air-coupled ultrasonic sound velocity measurements and (e) plate specimens for X-ray densitometry.
16 months (4 months after stopping the incubation of the 12 months treatment series). A one-tailed statistical significance test was per-formed for each group of measurements.
Color spectrophotometry is based on the CIE-L*a*b* system. A
tristimulus photoelectric colorimeter (Konica Minolta, Osaka, Japan) was applied (360–740 nm). The color index was calculated by:
2 2 2
E∗= ( L ) ( a ) ( b )∗ + ∗ + ∗ (1)
where L* is the lightness from 0 (black) to 100 (white), a* determines
the ratio of red (positive) to green (negative) and b* specifies the ratio
of yellow (positive) to blue (negative).
Densitometric analysis with X-ray radiography was performed by a medical CT scanner (Toshiba Aquilion 64, Nasu, Japan) at the Leiden University Medical Center, The Netherlands combined with an image analysis algorithm MatLab (Stoel et al. 2012). The algorithm produces 2D “density map” images of the specimens, in which each pixel represents the local density in kg m-3. The median is defined
as the value that divides the total Gaussian density distribution in half, as an alternative method based average density comparisons. For control, measurements were repeated 3 times for the untreated specimens at two measurement campaigns. Density differences of the same specimens at two different times in 16 months intervals were up to 1.7%. The data calibration is based on the density differ-ences of the twin controls woods.
Vibrational testing of small strip specimens: The first resonance fre-quency (fR) and internal damping (tanδ) of the strip specimens were
determined by a custom developed free-free resonance flexural vibra-tion test (Ono and Norimoto 1983; Obataya et al. 2000). The specimen was supported by cotton threads located at the position of the vibration nodes of the fundamental frequency. It was subjected to forced bend-ing vibration by an electromagnet facbend-ing a metallic plate of < 20 mg weight mass, glued to the end of the specimen. Vibration was emitted by means of an electric magnet device and displacements at anti-node of the first vibration mode were measured by a laser triangulation dis-placement sensor. A broadband frequency scan was used to detect the first resonance frequency, while a second, narrow-band scan allowed the determination of the quality factor, Q (bandwidth at half-power), and thus the tanδ in frequency domain, Q-1. Then, the excitation (fixed
at fR) was stopped and the logarithmic decrement (λ) of amplitudes
was recorded to obtain the tanδ in the time domain as tanδ≈λ/π. The difference between tanδ obtained by both methods was < 5%.
Given the high aspect ratio of the specimens, the influence of shear and rotary inertia can be ignored. Thus, the specific modulus of elasticity (E/ρ) was calculated from the first natural frequency of the specimens, according to the Euler-Bernouilli equation (avg. of three measurements with StD < 0.1%). But based on reliability studies it can stated that theoretical uncertainties and measurement errors can be up to 5% (Brancheriau et al. 2010; Brémaud 2012). The sound velocity (c), sound radiation coefficient (R) and characteristic impedance (z) along the fibers (L) and perpendicular (⊥) to the fibers (R) were calculated as:
E c E E
c= ρ(2); R= =ρ ρ3 (3); z c= ρ= ρ (2) Air-coupled ultrasonic sound velocity measurements: This tech-nique allows the sound velocity (c) determination in specimens with a larger geometry. The measurements in thin wood plates were performed before and after fungal treatment. Two air-coupled transducers, transmitter, and receiver were aligned on the sides of a
specimen. Commercial 200 kHz broadband planar Gas Matrix Piezo-electric Composites transducers were applied (Ultran NCG200-D25, The Ultran Group Inc., State College, PA, USA) with an active diame-ter of 25 mm together with an electronic pulsed equipment (Sanabria et al. 2011a,b). Insonification was perpendicular (⊥), to the surfaces.
The transmitter was excited with a single 300 kHz sinusoidal pulse windowed with a Gaussian function at 600 Vpp amplitude and the waveform sensed at the receiver was ultimately digitized. To obtain c along the L direction (cL), samples were transmitted through
the long side (dL = 160 mm) and at a fixed position (35 mm below the
top). Because sound waves travel faster through wood than air, there is a transmission peak at a time interval Δt before the direct transmis-sion through air without sample. Thus cL was calculated as follows:
L
air L
1 c =1/c t /d
−∆ (3)
where cair is the sound velocity in air (Rokhlin and Wang 1992;
Sana-bria et al. 2013). Noise reduction was obtained by averaging 500 measurements. The uncertainty of cL, due to temperature variation,
air turbulence and thickness measurement was estimated to be ca. 1%. Also cL was measured for four control specimens in two
measure-ment campaigns, which resulted in a difference < 0.7%.
Results and discussion
Mass gravimetry
Table 1 shows the densities before and after treatment, their standard deviation (StDs) and the ML within each batches. Change in the density of different specimen batches was sta-tistically significant at a confidence level (CL) of 95%. ML in TW and D specimens was higher than the S and P batches. This observation correlates with the initial densities of the specimens before incubation (in TW and D specimens was significantly smaller compared to S and P specimens). There was no significant relation between ML and incubation time, while it is likely that the initial densities played a more important role. Another observation is that the specimens of batch P8 show a mass gain, which is most probably due to the increased sorption capacity of wood after prolonged exposure to P. vitreus (Sedighi Gilani and Schwarze 2015).
Chromaticity
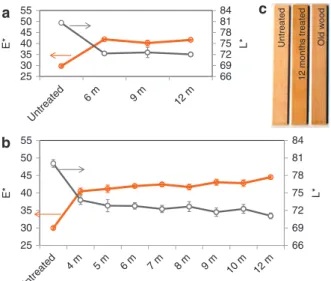
In Figure 2, the color index (E*) and lightness (L*) of the
samples after 4–12 months incubation are presented. Before
treatment, E* was 29.9 (±0.8) in both TW and NW. The color
index is increased at higher incubation time, while lightness is reduced. After 12 months treatment, color indices 41.6 (±0.6) and 44.5 (±1.2) were found for TW and NW, respec-tively. Incipient decay of P. vitreus is light reddish-brown due to oxidation of phenolic compounds and accumulation
of manganese oxide that results in wood darkening (Hietala et al. 2009; Clearly et al. 2011). Similar indices were also measured for two old wood specimens from an interior beam section of a historic house in Switzerland (dated from 1756). The color index of the old wood was 37.2 with a
lightness of 73.7. Darkening of old wood is often attributed to the UV induced darkening of lignin and/or extractives via
oxidation. In Figure 2c, an image of untreated, TW12m, and
of an old wood specimen is presented for comparison. It is evident that the fungal treatment results in a more brown-ish color, similar to that of old wood. This darkening is ben-eficial from an esthetical point of view, because the violin makers often darken natural wood by dyes or UV treatment.
Density reduction
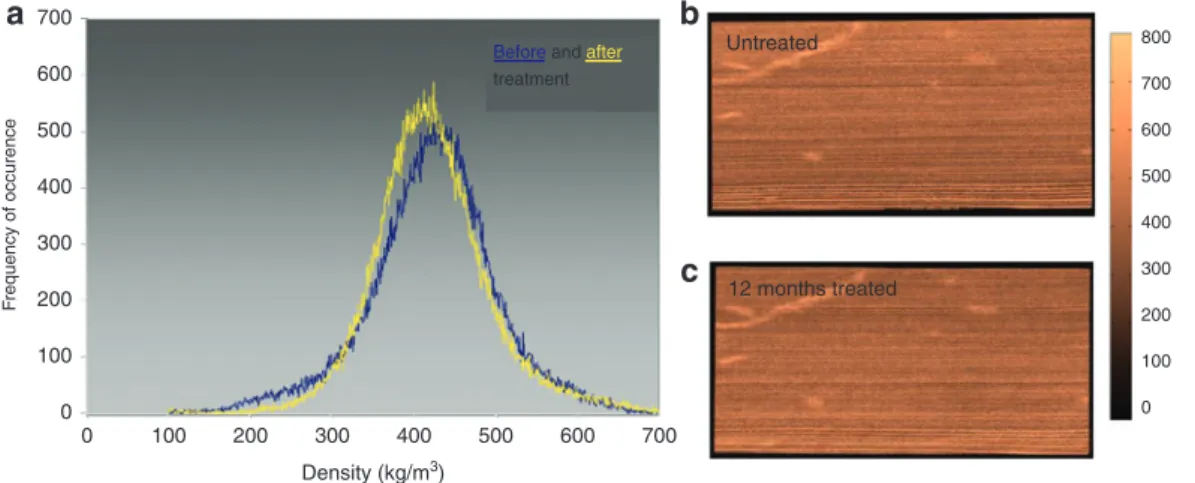
Figure 3 shows the density distribution and also the derived maps of local densities obtained by X-ray image analysis of NW, before and after 12 months incubation with P. vitreus.
The color bars shows a range from 0 to 800 kg m-3 with dark
colors indicating lower densities. The gravimetric density of
the presented specimen was 426 kg m-3 before and 418 kg m-3
after treatment. The peak of the Gaussian distribution indi-cates a clear density reduction in all treated specimens, while the reduction of the median densities and their StDs were 2.1% (±0.18), 2.6% (±0.73), and 2.3% (±0.81) after 6, 8, and 12 months, respectively. As the treated wood retains a larger quantity of moisture compared to the untreated one (see Material and methods), it is expected that the absolute
Untreated 12 months treated Old wood 66 69 72 75 78 81 84 25 30 35 40 45 50 55 L* E* 66 69 72 75 78 81 84 25 30 35 40 45 50 55 L* E* Untreated Untreated 6 m 6 m 7 m 8 m 4 m 5 m 9 m 9 m 10 m 12 m 12 m a b c
Figure 2: Changes in the color index (orange) and lightness (gray) in untreated and fungally treated wood for different incubation periods for TW (a), NW (b). (c) Photograph of untreated, treated and old wood.
Table 1: Densities (kg/m3, average and StD) and their differences at 65% RH, in different specimen batches before and after incubation
with Physisporinus vitreus.
Sample/property
Time of incubation (month)4 5 6 7 8 9 10 12
TW1 TW2 TW3 Strips TW ρini 397(±12) 393(±9) 388(±6) TW ρfini 393(±6) 389(±8) 380(±10) TW Δρ 1.01% (CL=87) 1.02% (CL=98) 2.06% (CL=99) S1 S2 S3 S4 S5 S6 S7 S8 NW ρini 486(±17) 478(±21) 486(±24) 481(±19) 475(±16) 481(±16) 480(±20) 485(±18) NW ρfini 478(±18) 476(±20) 481(±22) 478(±21) 473(±15) 476(±20) 478(±21) 476(±20) NW Δρ 1.65% (CL=92) 0.42% (CL=92) 1.03% (CL=97) 0.62% (CL=80) 0.42% (CL=81) 1.04% (CL=92) 0.42% (CL=94) 1.86% (CL=99) Plates P1 P2 P3 P4 P5 P6 P7 P8 NW ρini 462(±24) 448(±10) 474(±14) 448(±11) 449(±10) 449(±9) 472(±18) 475(±12) NW ρfini 451(±26) 445.5(±12) 469(±15) 446.5(±12) 445(±13) 444(±14) 467(±17) 483(±9) NW Δρ 2.38% 0.56% 1.05% 0.33% 0.89% 1.11% 1.06% –1.68% D1 D2 D3 NW ρini 390(±21) 367(±25) 395(±28) NW ρfini 381(±22) 357(±21) 385(±23) NW Δρ 2.31% (CL=99) 2.72% (CL=94) 2.53% (CL=91) Confident level for plate specimens is not available due to the small sampling size.
23 28 33 38 a E/ ρL (MPa m 3 kg
-1) Before and after treatment
1.4% 3.2% 4.3% b 0.0045 0.0058 0.0071 0.0084 tan δL 4.1% 4% 6.4% c 10 000 11 300 12 600 13 900 R (m 4 skg -1) 1.2% 0.3% 0.8% d 1800 2300 2800 3300 0 m 6 m 0 m 9 m 0 m 12 m TW1 TW2 TW3 z (kg m -2 s -1) 0.5% 2.8% 3.6%
Figure 4: Box-and-whisker plots of (a) specific modulus of elas-ticity, (b) damping coefficient, (c) sound radiation ratio and (d) characteristic impedance in tonewood at 65% RH, before and after modification for 6, 9 and 12 months. The arrows indicate changes in the mean value.
800 700 600 500 400 300 200 100 0 Untreated 12 months treated 0 100 200 300 400 500 600 700
a
b
c
0 100 200 300 400 500 600 700 Density (kg/m3)Before and after treatment
Frequency of occurence
Figure 3: (a) Gaussian distribution of density in a plate of Norway spruce wood, before and after 12 months incubation with P. vitreus, (b) density map before and (c) density map after fungal treatment in kg/m3.
ML of the dry wood and the density reduction at low RH conditions will be more significant than the reported values at 65% RH. The presence of water might influence the attenuation of X-ray beam and the quantified density map. However, this effect is probaly minor in the RH range of this study, while it becomes important, when the equivalent water layer in the material is thick, e.g. in presence of liquid water within the material (Zillig 2009). Alternation of dark and bright colors in the local density maps shows density differences between earlywood and latewood layers. Also, the similar distribution of dark and bright colors for the given spatial scale indicates that density reduction occurred homogeneously across the plate, i.e. a uniform fungal wood modification was apparent.
Vibrational properties of TW
Figure 4a and b shows that after 6, 9, and 12 months of fungal incubation, the E/ρ of the wood strips was reduced by 1.4, 3.2, and 4.3%, respectively, whereas the tanδ, was increased by 4.1, 4 and 6.4%, respectively. E/ρ decrement and tanδ increment are statistically significant after 9 and 12 months treatment (CL 99%), while after 6 month the CL was in the range of only 80–87%. In Figure 4c and d, the sound radia-tion coefficient and the characteristic impedance of the same specimens, calculated from Eq. 2, are presented. The former shows a slight increase of 0.3% after 9 month and 0.8% after 12 months. The characteristic impedance was reduced by 0.5, 2.8, and 3.6% after 6, 9, and 12 months of incubation, respectively. The CL for change of the sound radiation coefficient was only 70%, while the change of the characteristic impedance was significant (CL 99%).
Vibrational properties of NW
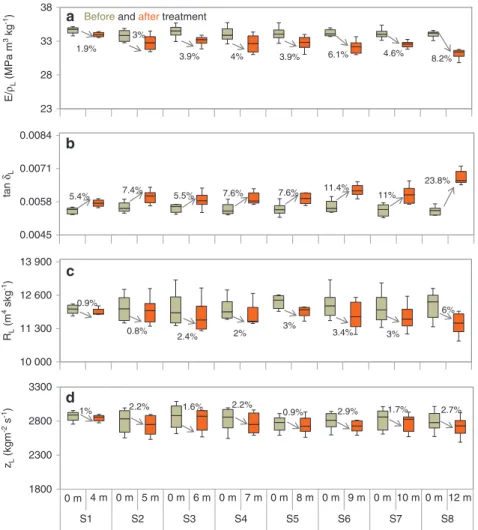
In Figure 5, the E/ρ, tanδ, sound radiation coefficients, and characteristic impedances in longitudinal direction (L) of NW specimens, before and after fungal treatment for 4, 5, …, 10 and 12 months are compared. Also, Figure 6 shows
the same parameters in transversal direction (R). The E/ρL
of untreated NW was 34.2 (±0.8) MPa m3 kg-1, which exceeds
the 27.5 (±1.1) MPa m3 kg-1 value recorded for TW. This means
that the sound velocity, which is calculated based on E /ρ
is higher in NW. Moreover, the tanδL in NW was 0.0052
(±0.0002) and smaller than the 0.0069 (±0.0005) value
recorded for TW. The E/ρR of untreated wood was 1.75 (±0.6)
MPa m3 kg-1 and the tanδ
R was 0.0214 (±0.0028). This large
anisotropy in the vibrational properties is attributed to the architecture and orientation of wood cells at the micro-scale (Bodig and Jayne 1982; Bucur 1987). In fact, wood growth rings act as curtail for sound waves in the transversal
direc-tion, causing a higher tanδR, i.e. in perpendicular in grain
direction. The results above show that the classification criteria of luthiers and instrument wood retailers do not always correlate with the traditionally expected vibrational properties such as a high sound velocity and low tanδ. This is in good agreement with the fact that the specific Norway spruce wood category of “Haselfichte” has a special place in violin craftsmanship, despite a significantly lower sound velocity. Moreover, some violin makers look for wood that has both a high stiffness and tanδ as they associate these properties with a warm and mellow sound of the instrument.
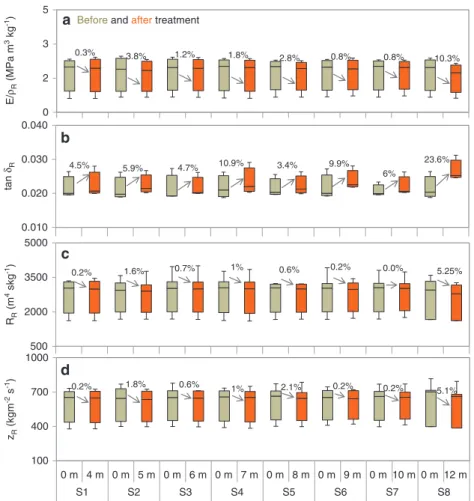
As Figures 5 and 6 show, fungal treatment reduces the E/ρ (CL 95–99%), at a higher rate and at longer incubation
periods. While the reducing trend of the “E/ρL vs. incubation
time” is clear, changes of E/ρR vs. time’ is not significant (CL
60–98%) and less dependent on the incubation time. After 12 months of incubation, the E/ρ shows a drastic reduction of 8.2% and 10.3% in L and R direction, respectively. Also, an increase of tanδ (CL 95%) with increasing incubation time up to 23.8% after 12 months was recorded (Figure 5). 23
28 33 38
1.9%
Before and after treatment
3% 4% 3.9% 6.1% 4.6% 8.2% 3.9% 0.0045 0.0058 0.0071 0.0084 5.4% 7.4% 5.5% 7.6% 7.6% 11.4% 11% 23.8% 10 000 11 300 12 600 13 900 0.9% 0.8% 2.4% 2% 3% 3.4% 3% 6% 1800 2300 2800 3300 0 m 4 m 0 m 5 m 0 m 6 m 0 m 7 m 0 m 8 m 0 m 9 m 0 m 10 m 0 m 12 m S1 S2 S3 S4 S5 S6 S7 S8 1% 2.2% 1.6% 2.2% 0.9% 2.9% 1.7% 2.7% a b c d E/ ρL (MPa m 3 kg -1) tan δL RL (m 4 skg -1) zL (kg m -2 s -1)
Figure 5: Box-and-whisker plots of (a) specific modulus of elasticity, (b) damping coefficient, (c) sound radiation ratio and (d) characteristic impedance of normal wood in longitudinal direction at 65% RH, before and after fungal treatment for 4, 5, …, 10 and 12 months. The arrows indicate changes in the mean values.
The characteristic impedances is decreased after incu-bation (CL 99 and 90% in L and R directions, respectively), which is associated with a simultaneous reduction in stiff-ness and density (see Eq. 2). As this index is related to the transmission of vibratory energy from wood to the air, its reduction improves the ease of vibration in the instru-ment. On the other hand, the sound radiation coefficient, which is linked with the loudness of an instrument, was reduced after incubation (CL 92 and 50% in L and R direc-tions, respectively). Sound radiation reduction in NW can be explained by its definition as square root of stiffness to density ratio (Eq. 2). The reduction of sound radiation in NW, contrary to 9 and 12 months treated TW, indicates that the degradation of stiffness occurred at a lower rate in the latter. Differences in microstructure may explain the dif-ferent impact of P. vitreus on the stiffness of the two wood categories. TW is usually harvested from the forests at higher altitudes and colder climate. Such wood has a finer structure than NW harvested at lower altitudes, in terms of annual ring width, porosity, and density of earlywood
and latewood tracheids, which are responsible for their distinct vibrational and acoustical properties.
Sound velocity in the thin wood plates
In Figure 7a, the average ultrasonic sound velocity of the untreated and treated thin plates in the fiber direction and in Figure 7b, the differences between the measured data by ultrasound (gray markers) before and after treatment and the data for small wood small strips, calculated based on the free-free vibration test results (white markers) are presented. The obtained results agree well for the air-cou-pled ultrasonic sound velocity and that obtained by free-free vibration. Accordingly, the fungal treatment reduces the sound velocity, incrementally with an increase of incubation period up to 4.5%. CL for the result from free-free vibration test was above 95%, while statistical sig-nificance test for the air-coupled ultrasonic test was not possible due to the small sampling size. However, the 0 2 3 5 0.3% 3.8% 1.2% 1.8% 2.8% 0.8% 0.8% 10.3% 0.010 0.020 0.030 0.040 4.5% 5.9% 4.7% 10.9% 3.4% 9.9% 6% 23.6% 500 2000 3500 5000 0.2% 1.6% 1% 0.6% 0.2% 0.0% 5.25% 100 400 700 1000 0 m 4 m 0 m 5 m 0 m 6 m 0 m 7 m 0 m 8 m 0 m 9 m 0 m 10 m 0 m 12 m S1 S2 S3 S4 S5 S6 S7 S8 1.8% 2.1% 0.2% 0.2% 0.2% 0.6% 1% 0.7% 5.1% E/ ρR (MPa m 3 kg -1) tan δR RR (m 4 skg -1) zR (kg m -2 s -1)
Before and after treatment a
b
c
d
Figure 6: Box-and-whisker plots of (a) specific modulus of elasticity, (b) damping coefficient, (c) sound radiation ratio and (d) character-istic impedance of normal wood in radial direction at 65% RH, before and after fungal treatment for 4, 5, …, 10 and 12 months. The arrows indicate changes in the mean values.
agreement between the results for different specimen sizes, strips vs. plates, indicates that P. vitreus degraded the wood homogeneously and at a similar rate for both selected specimen size scales.
Conclusions
The interrelation between the vibro-mechanical properties of wood, empirical criteria for selecting wood by crafts-man, and the resulting sound of each crafted instrument was in focus. It was demonstrated that wood incubated with P. vitreus increases the tanδ and reduces the E/ρ of wood at higher rates with longer incubation periods. The repeatability of the tests was verified for both master grade tone-wood (TW) and normal wood (NW) tested in the laboratory on small and large specimens. Fungal treatment improved the sound radiation ratio in TW and reduced the acoustic impedance in both NW and TW. It also reduced the density and enriched the color indices towards a brownish and older looking wood; two quali-ties which are highly appreciated by luthiers for violin making. It is important to note that the presented results are more descriptive, as the number of tested specimens in each incubation period was too small for more detailed statistical analyses. However, a one tailed statistical sig-nificance test shows the validity of most observations, e.g. change in the densities, specific moduli of elasticity and impedances, due to fungal incubation. However, as
one major purpose of the soundboard is to convert the energy of vibration of the strings to radiated sound, it is safe to assume that the improvement of sound radiation and acoustic impedance in the fungally treated TW plays an important role for the sound quality of the instrument. Acknowledgments: We would like to acknowledge the financial support of the Walter Fischli Foundation and contribution of team members of the Biotech-violin pro-ject, especially Javier Ribera-Regal for treatment of wood samples and Dr. Erwin Hack and Dr. René Steiger for insightful discussions. We also acknowledge the support of Daniel Heer for rigorous sample preparation at Empa wood workshop, Anja Huch and Eric Marty for microscopy and colorimetry and Dr. Iris Brémaud for making it pos-sible to use her developed vibrational testing hard- and software.
References
Anon (2009) The biotech Stradivarius. Nature Biotechnology News 28:6.
Brémaud, I. (2012) Acoustical properties of wood in string instru-ments soundboards and tuned idiophones: biological and cultural diversity. J. Acoust. Soc. Am. 131:807–818.
Brancheriau, L., Kouchade, C., Brémaud, I. (2010) Internal friction measurement of tropical species by various acoustic methods. J. Wood Sci. 56:371–379.
Bucur, V. Acoustics of wood. Springer-Verlag Berlin, Germany, 1987.
Bodig, J., Jayne B.A. Mechanics of Wood and Wood Composites, Van Nostrand Reinhold Publishing, Scarborough, Ontario, Canada, 1982.
Cleary, M., Sturrock, R., Hodge, J. (2011) Southern Interior Forest Region: Laminated root disease Stand Establishment Decision Aid. BC J. Ecosystems and Management 12:17–20.
Ganne-Chédeville, C., Jääskelänen, A.S., Froidevaux, J., Hughes, M., Navi, P. (2012) Natural and artificial ageing of spruce wood as observed by FTIR-ATR and UVRR spectroscopy. Holzforschung 66:163–170.
Hietala A.M., Nagy N.E., Steffenrem A., Fossdal C.G., Kvaalen H., Solheim H. (2009) Spatial patterns in hyphal growth and wood degradation within Norway spruce stems colonized by the pathogenic white-rot fungus Heterobasidion parviporum. Appl. Environ. Microbiol. 75:4069–4078.
Hill, C.A.S., Ramsay, R., Keating, B., Laine, K., Rautkari, L., Hughes, M., Constant, B., (2012) The water vapour sorption properties of thermally modified and densified wood. J. Mater. Sci. 47:3191–3197.
Obataya, E., Ono, T., Norimoto, M. (2000) Vibrational properties of wood along the grain. J. Mater. Sci. 35:2993–3001.
Ono, T., Norimoto, M. (1983) Study on Young’s modulus and internal friction of wood in relation to the evaluation of wood for musi-cal instruments. Jpn. J. Appl. Phys. 22:611–614.
5400 5600 5800 6000 6200 CL (m/s) ∆ CL/CL (% )
Before and after treatment a b -6 -4 -2 0 2 3 5 7 9 11 13 Time (months) Ultrasonic_P Vibration test_S
Figure 7: (a) Average ultrasonic sound velocity along fibers direc-tion in the thin plates, before and after treatment and (b) comparing the change in the sound velocity in fungally treated wood plates measured by air-coupled ultrasonics (gray markers) and small strips measured by natural frequency of beam element in free-free vibra-tion (white markers).
Pfriem, A., Eichelberger, K., Wagenführ, A. (2007) Acoustic proper-ties of thermally modified spruce for use of violins. J. Violin Soc. Am. 21:102–111.
Rokhlin, S.I., Wang, W. (1992) Double through-transmission bulk wave method for ultrasonic phase velocity measurement and determination of elastic constants of composite materials. J. Acoust. Soc. Am. 91:3303–3312.
Sanabria, S.J., Hilbers, U., Neuenschwander, J., Niemz, P., Sennhauser, U. (2013) Modeling and prediction of density distribution and microstructure in particleboards from acoustic properties by correlation of non-contact high-resolution pulsed air-coupled ultrasound and X-ray images. Ultrasonics 53:157–170. Sanabria, S.J., Müller, C., Neuenschwander, J., Niemz, P.,
Sennhauser, U. (2011a) Air-coupled ultrasound as an accurate and reproducible method for bonding assessment of glued timber. Wood Sci. Technol. 45:645–659.
Sanabria, S.J., Furrer, R., Neuenschwander, J., Niemz, P., Sen-nhauser, U. (2011b) Air-coupled ultrasound inspection of glued laminated timber. Holzforschung 65:377–387.
Schwarze, F.W.M.R., Spycher, M., Fink, S. (2008) Superior wood for violins – wood decay fungi as a substitute for cold climate. New Phytol. 179:1095–1104.
Schwarze, F.W.M.R., Schubert, M. (2011) Physisporinus vitreus: a versatile white-rot fungus for engineering value added wood products. Appl. Microbiol. Biotechnol. 92:431–440. Sedighi Gilani, M., Schwarze, F.W.M.R. (2015) Hygric properties of
Norway spruce and sycamore after incubation with two white rot fungi. Holzforschung 69:77–86.
Stoel, B.C., Borman, T.M., de Jongh, R. (2012) Wood Densitometry in 17th and 18th Century Dutch, German, Austrian and French Violins, Compared to Classical Cremonese and Modern Violins. PLoS One 7:e46629.
Wegst, U.G.K. (2006) Wood for sound. Am. J. Bot. 93:1439–1448. Yano, H., Kajita, H., Minato, K. (1994) Chemical treatment of wood
for musical instruments. J. Acoust. Soc. Am. 96:3380–3391. Zillig, W. (2009) Moisture transport in wood using a multiscale
approach. Ph.D. thesis (Eng.), Building Physics Laboratory, Katholieke Universiteit Leuven.