HAL Id: inserm-00183729
https://www.hal.inserm.fr/inserm-00183729
Submitted on 30 Oct 2007
HAL is a multi-disciplinary open access
archive for the deposit and dissemination of sci-entific research documents, whether they are pub-lished or not. The documents may come from teaching and research institutions in France or abroad, or from public or private research centers.
L’archive ouverte pluridisciplinaire HAL, est destinée au dépôt et à la diffusion de documents scientifiques de niveau recherche, publiés ou non, émanant des établissements d’enseignement et de recherche français ou étrangers, des laboratoires publics ou privés.
Temporal Tracking of Coronaries in MSCTA by Means
of 3D Geometrical Moments.
Soizic Laguitton, Cezary Boldak, Alexandre Bousse, Guanyu Yang, Christine
Toumoulin
To cite this version:
Soizic Laguitton, Cezary Boldak, Alexandre Bousse, Guanyu Yang, Christine Toumoulin. Temporal Tracking of Coronaries in MSCTA by Means of 3D Geometrical Moments.. Conference proceedings : .. Annual International Conference of the IEEE Engineering in Medicine and Biology Society. IEEE En-gineering in Medicine and Biology Society. Annual Conference, Institute of Electrical and Electronics Engineers (IEEE), 2006, 1, pp.924-7. �10.1109/IEMBS.2006.260670�. �inserm-00183729�
TEMPORAL TRACKING OF CORONARIES IN MSCTA BY MEANS OF
3D GEOMETRICAL MOMENTS
Abstract— An algorithm is proposed that perform a temporal
tracking of the vessel central axis in a 3-D dynamic sequence in multi-slice computed tomography (MSCT). The approach is based on geometric moments and a local cylindrical approximation. The local characteristics of the vessel are estimated on the first volume of the sequence (position on the vessel central axis, local diameter, intravascular and background intensities), then used to track the vessel along the sequence. The correspondence between two volumes is solved through a region matching based on a criterion of minimal distance combining moment-based descriptors with intensity information. Preliminary results are presented on two sequences.
Keywords— MSCTA, Coronary Extraction, 3D Sequence
Tracking, 3D Geometric Moments
I. INTRODUCTION
OINT tracking over an image sequence is an essential problem which is common to several domains such as computer vision and biomedical imaging and is involved in many high level tasks such as motion estimation, 3-D reconstruction, surveillance or robot vision. Point trajectory along a given image sequence when non-linear motion is involved, is a pretty-quite difficult task. Unlike structured shape tracking, no shape priors can be imposed and the only possibility is to rely on local characteristics of the point. In addition, tracking a given point over time assumes the invariance of some local features along the trajectory. Another difficulty is often related to the setting of a prior dynamic model of the point motion when no prior knowledge on the evolution of the surrounding of the objects is available. Hence methods reported in the literature often rely on local techniques based on geometric and luminance invariants. One of the most popular is based on correlation techniques [1] but they turn out to be quickly inadequate in the case of large motion, intensity variation or occlusions. Optical flow methods [2], based on assumption of the conservation of intensity properties throughout their temporal evolution are considered well performing for small motion velocities. The brightness constancy constraint equation often requires some averaging in the neighbourhood to reduce the variance of the motion vector estimate. The feature-based optical flow estimation matches small patches over images but its performances may be also limited when the image background is locally highly
structured or when dealing with strong non-transactional motions and deformations of the 3-D objects. Techniques using block matching (based on a similarity measure) operate better for larger displacements [3].
The application, we are dealing with, concerns the 3-D temporal tracking of coronaries in multi-slices computed tomography angiography (MSCTA) and is related to the real time observation of the catheter trajectory in interventional surgery. The subject copes with dynamic volume sequence analysis and makes use of a voxel tracking strategy to locally obtain the displacement of a vessel on a cardiac cycle. The proposed method is based on a region matching with a distance criterion that combines geometric moment-based descriptors with intensity information: It is described section II. Preliminary results on simulated and real data are then presented section III. A discussion is finally provided section IV with some perspectives on the work in progress.
II. VOXEL TRACKING PROCESS
The movement of coronaries is directly related to the cardiac beating which induces non-linear motion and deformations of the structures. Because geometric moments are integral-based features and are therefore robust against noise, we used them in association with local intensity information to track a voxel in the sequence. We first locally modeled the vessel by a cylinder of center of gravity
Pi, diameter di and orientation αi and βi in the 3-D space.
Analytical expressions of these parameters were obtained from the 3-D geometric moments of up to order 2 [4]. Central moments were computed on an isotropic grid using a spherical window. Each pixel inside this window was weighted according to its memberships to the sphere, by considering a sub-pixel decomposition. This way, the computation was reduced to mask convolutions.
Thus the tracking process was performed into three steps: 1. Estimation of the local characteristics of the vessel
around the considered voxel at time t
2. Region matching based on a distance combining geometric moment descriptors with vessel and background intensities to recover the vessel at time t+1. 3. Adjustment of the position of the voxel inside the
vessel using a spatial tracking. S. Laguitton1, C. Boldak2, A. Bousse1, G. Yang1,3, C. Toumoulin1 1 Laboratoire LTSI - INSERM U642 -Université de Rennes I, Rennes, France
2 Computer Science Department, Institute of Bialystok, Bialystok, Poland 3 Laboratory of Image Science and Technology (LIST), Southeast University,China
P
HAL author manuscript inserm-00183729, version 1
Conf Proc IEEE Eng Med Biol Soc 2006;1:924-7
This material is presented to ensure timely dissemination of scholarly and technical work. Copyright and all rights therein are retained by authors or by other copyright holders.
All persons copying this information are expected to adhere to the terms and constraints invoked by each author's copyright. In most cases, these works may not be reposted without the explicit permission of the copyright holder.
A. Initialization of the tracking process and local feature analysis
The tracking process was initiated from a voxel Pi,t
interactively selected on (or the nearest to) the central axis of a vessel, in a volume t. As the analytical diameter formulation depends directly on the window size as well as the precision of the localisation of the vessel centre Pi,t, the
position of this voxel was refined through an iterative process to make it converge towards the central axis. This convergence was achieved when the distance between the centre of gravity of the spherical window and the centre of this window (on which the centre of gravity is computed) was less than a voxel or run through a minima.
The local vessel diameter was then expressed in terms of the zero order moment, the radius of the spherical window
R and the vessel and background intensities Iv and Ib. The
background intensity (Ib) was updated to the mean value
computed outside the vessel in the normal plane to the currently estimated vessel orientation and outside the vessel. The local orientation of the vessel was computed from the second order moments and the mean intensity of the background by investigating eight 1-D profiles along equally spaced directions. The vessel intensity Iv was also
assessed to the mean intensity computed along the estimated vessel direction. Optimal parameters are achieved when the spherical window is centered on the vessel axis and its size exactly fits the vessel size. The diameter was thus estimated through a multiresolution moment computation [4] i.e. it was iteratively computed for different sizes of the spherical window and the vessel parameters re-estimated until the window dimension matches the width of the vessel.
B. Temporal tracking with region matching
Let us consider a given point Pi,t in the volume t. The
problem of tracking this feature in a sequence can be defined as estimating the position of the point Pi,t in the
volume t+1. We considered that no knowledge on the dynamic of the surrounding object was available. We tried thus to solve the correspondence through a region matching based on a criterion of minimal distance associating both geometric and density information: the central moments up to order 2 and the intensities of the vessel and background, computed for each candidate voxel Pr,t+1. The maximum
displacement magnitude that was observed on a coronary branch, has been evaluated to about 1 cm between two temporal instants, in two recent studies [5-6]. We designed thus a spherical search space of radius Rs = 1 cm, centered on the position of the projected voxel Pi,t, in the volume t+1.
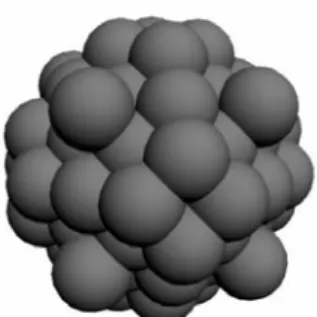
This space was then split into N overlapping regions whose center positions were chosen to optimize the covered volume by a set of spheres of radius R equal to the estimated diameter of the vessel at time t (Fig. 1).
Fig. 1: Search space for a vessel diameter estimated to R = 8 . This space includes 81 spheres
For each spherical region r of radius R, centered at location
Pr,t+1, r = 1 …N, we applied the multiresolution moment
algorithm to make the center of the window converge towards the brightest structures (cardiac cavities, myocardium, arteries) located in the surrounding of Pr,t+1.
We assumed then that at least one of the spheres was attracted by the vessel we were looking for. The central moments as the vessel and background intensities were then computed for each sphere. We evaluated then the distance between the point Pi,t and the set of points PrG,t+1 ,
characterizing the center of gravity of each sphere (located at the center of the sphere) to select the point likely to belong to the same vessel, in the volume t+1:
(
)
(
)
1 2 2 2 , , , , 0 2 , 2 , 1 , , 1 2 2 , , 1 ( ) ( ) ( ) ( ) ( ) ( ) G p q l pql i t p q l pql r t p q l i r G t t v i t v r t G b i t b r t P P D I P I P I P I P + + + + + = + + + 1 ⎡⎛ ⎞ ⎤ ⎢⎜ α μ −α μ ⎟ ⎥ ⎢⎝ ⎠ ⎥ ⎢ ⎥ ⎢ ⎥ = +β × − ⎢ ⎥ ⎢+γ × − ⎥ ⎢ ⎥ ⎢ ⎥ ⎣ ⎦∑
(1) where and μpql r t, 1+ (p,q,l = 1,2; t = 1,2, …,10; r = 1,2, …, N) represent the 3-D central moments computed at the voxel P(PG )
i,t in the volume t and , 1 the center of
gravity of each candidate sphere r in the volume
t+1.;respectively. The region
G r t
P
+that provided the minimal value , was retained and its center of gravity
was assimilated to the position of the voxel P
r i t t D, 1 ,+ G t r P,+1 i,t in the volume t+1:
{
, 1}
, , 1 , 1 1...ˆ
|
arg min
r t G i t t t r NP
+P
+r
D
+ ==
=
i r (2) C. Position refinementThe estimated pointPˆi,t+1was assumed to be located on the
right vessel but not necessarily at the exact position. Indeed the sphere may have been caught at another level of the same vessel having close characteristics. When the estimated point was associated with a significant distance , a spatial tracking process was thus applied on the vessel to refine the position of the point , 1. This
tracking was performed from the point , 1on a distance of
40 voxels along the vessel, in each opposite direction. It
1 , ˆ + t i P r i t t D, 1 ,+ ˆ + t i P ˆ + t i P
aimed to extract a set of points located on the vessel central axis, around the estimated point , and choose the one associated with the minimal value of (j refers to the studied region for an incremental displacement equal to 1: –40 ≤ j ≤ 40). The spatial tracking made use of the estimated direction of the vessel to search for the next point on the central axis. This direction was computed from the moments of order 2. 1 , ˆ + t i P j i t t D, 1 ,+ III. RESULTS
The algorithm was tested on two dynamic cardiac sequences. One was acquired on a Siemens Somatom volume zoom 4 detectors rings and the other on a GE LightSpeed system with 16 detectors rings. These sequences included 10 volumes reconstructed from slices acquired every 10% of the cardiac cycle and on several cycles. The dimension of each volume was 512x512x219 and 512x512x300 slices with a voxel resolution of 0.35x0.35x 0.5 mm3 and 0.47x0.47x0.6 mm3 respectively. A
preliminary interpolation was performed to make the datasets isotropic in each direction.
The arteries were divided into proximal, middle and distal segments. Three points were selected on the right coronary: RCA origine, RCAPM (the point of intersection between the
proximal and middle thirds) and RCMMD (the point of
intersection between the middle and distal thirds). In the same way, we identified seven points on the left coronary: one on the Left main coronary (LMC), three on the proximal, middle and distal left anterior descending artery (LAD) respectively, one on the left circumflex artery (LCx), one on the second Diagonal (SDA) and one on the Obtuse Marginal artery (PMA).
A first stage aimed at evaluating the behavior of the algorithm with a simulated displacement of the structures. We applied thus a spatial translation of growing magnitude up to 12 mm, on several of the volumes of each sequence. We used then a greedy algorithm to evaluate the tracking results for different values of the weighting coefficients including in the computation of the distance . We obtained the best results for
r i t t D, 1 ,+ 7 , 0 , 1 1 2 0= α = α = α and 7 , 1 = = γ
β . We computed each time the mean position error on the set of the 10 tracked points. Fig. 2 illustrates the steps of the tracking process for a spatial translation of magnitude 10 mm, i.e. 16 voxels in each direction x,y and z, on one of the volumes of one sequence. Results are shown on MIP images (Maximum Intensity Projections) computed in the axial plane.
The mean position error, computed for a given translation of a volume for each of the sequence, is given Fig. 3. The first stage allows the right vessel to be localized. Nevertheless, if the local characteristics of the vessel, at the estimated point , are relatively far from those measured at the point , the spatial tracking, inside the vessel, aimed
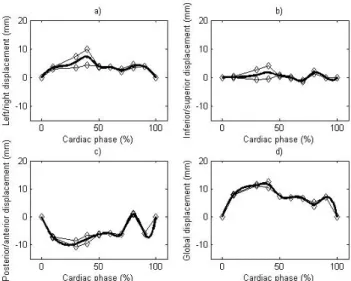
to refine this position. We have then applied the algorithm to search for the trajectory of the 10 points on the two dynamic volume sequences. We computed also this trajectory on two neighbors located up and down each point to derive a mean trajectory (in order to deal with the noise and motion artifacts). We traced then the mean displacement of each vascular segment (Fig 4). Fig 5 illustrates a result of the tracking on the origin of the RCA.
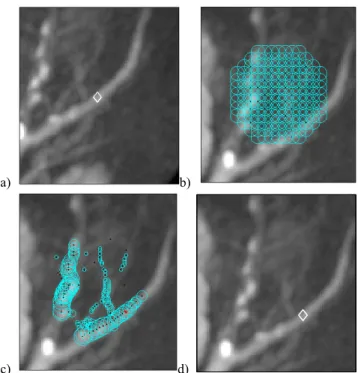
1 , ˆ + t i P t i P, a) b) c) d)
Fig.2: Tracking process applied on the second diagonal artery. a) A lozenge shows the position of a voxel Pi,t in the volume t. b) Projection of
the voxel Pi,t in the volume t+1 and search space centered on the projected
voxel Pi,t+1. The spherical space includes 683 spheres of radius R = 4. c)
Positions of the centers of the spheres after the temporal region matching. The selected point Pi,t+1 appears in red. d) The lozenge depicts the final
position of the estimated point Pi,t+1. Spatial tracking was not useful there
since the estimated point was found very close in the sense of the criterion.
Fig. 3: Mean displacement error for a simulated displacement on a volume of each sequence (Siemens and GE): This error has been computed for the
10 points located on the different branches
Fig. 4: Mean displacement of the RCA origin during a cardiac cycle. The plot shows results on two points situated at the origin of the RCA (thin lines) and the mean displacement (thick line). a-c) decomposition of the displacement into three 1-D displacements: left/right, post/anterior and inferior/superior. d) 3-D displacement 40% 100 150 200 250 150 200 250 300 50% 100 150 200 250 150 200 250 300 60% 100 150 200 250 150 200 250 300 70% 100 150 200 250 150 200 250 300 80% 100 150 200 250 150 200 250 300 90% 100 150 200 250 150 200 250 300
Fig 5: Temporal tracking of a voxel located at the origin of the RCA. Results are shown on MIP images. The lozenge indicates the estimated position at time t+1 and the star, the position of the point at time t.
IV. DISCUSSION
The performances of the algorithm depend on both the characteristics of the images and the structural complexity of the scene. The images are spatially anisotropic (a linear interpolation between slices need to be applied), not corrected during the reconstruction in term of motion artefacts and the vessel contrast evolves in time. The scene includes different structures such as the myocardium, the cavities and the venous and arterial trees, which are very close together and have a similar contrast. The size of a coronary branch evolves from the proximal to the distal segment and the shape can vary (due to the pathology). The errors in the estimation of the displacement include two components: the motion of the coronaries but also a spatial translation along the vessel because the matching may not be exact between the two estimated models. Background information and the local orientation have been exploited to
differentiate the vessels having similar characteristics. The first temporal process always allows finding the right vessel. Nevertheless, the estimated point is not always well positioned. The second process which corresponds to a tracking process inside the vessel aims at refining the position of the point. Tests on simulated motion have provided a mean error less than 2 mm. This simulation doesn’t include change of contrast with time, the deformation of the structures and motion artefact that were often present in real data. Thus the next stage will be to take into account these parameters to better analyse the limit of the algorithm. Preliminary results on real data appear consistent with two studies reported in the literature [5][6] on the coronary motion. The computation time to track a point between two volumes takes less than 2 seconds.
V. CONCLUSION
We have proposed a method to track coronaries in dynamic volume sequences in MSCTA. The results on data with linear simulated motion showed that the method works despite the complexity of the structures inside the volume. The first results on real data confirmed these promising results.
ACKNOWLEDGMENT
We are grateful to Brigitte Le Bruno from Siemens France for having provided the datasets. This work is done in the frame of a contract with the Brittany region.
REFERENCES
[1] Aschwanden P. et al., "Experimental results from comparative study on correlation-type registration algorithms", Robust. Comp. Vis., pp 268-289, 1992.
[2] Horn B. et al.,"Determining optical flow", Artificial intelligence, 17, 1981, pp 185-203.
[3] Sclaroff S. et al., "Active blobs: region-based deformable appearance models", Computer Vision and Image Understanding, 89, 2003, pp 197-225.
[4] Bołdak C et al., "An improved model-based vessel tracking algorithm with application to Computed Tomography Angiography"; J. of
"Biocybernetics and Biomédical Engineering", vol 3 (1), 2003,
41:64.
[5] Achenbach S. et al.,"In Plane coronary arterial motion velocity: measurement with Electron-Beam CT", J. of Radiology, vol (216), 2000, 457:463
[6] Shechter G. et al.,"Displacement and velocity of the coronary arteries: Cardiac and respiratory motion", IEEE Transactions on Medical
Imaging, vol. 25(3), 2006, 369:375.