HAL Id: inserm-02904850
https://www.hal.inserm.fr/inserm-02904850
Submitted on 22 Jul 2020
HAL is a multi-disciplinary open access
archive for the deposit and dissemination of
sci-entific research documents, whether they are
pub-lished or not. The documents may come from
teaching and research institutions in France or
abroad, or from public or private research centers.
L’archive ouverte pluridisciplinaire HAL, est
destinée au dépôt et à la diffusion de documents
scientifiques de niveau recherche, publiés ou non,
émanant des établissements d’enseignement et de
recherche français ou étrangers, des laboratoires
publics ou privés.
diffusion in the brain extracellular space through
hyaluronan remodeling
Federico Soria, Chiara Paviolo, Evelyne Doudnikoff, Marie-Laure Arotcarena,
Antony Lee, Noémie Danné, Amit Kumar Mandal, Philippe Gosset, Benjamin
Dehay, Laurent Groc, et al.
To cite this version:
Federico Soria, Chiara Paviolo, Evelyne Doudnikoff, Marie-Laure Arotcarena, Antony Lee, et al..
Synucleinopathy alters nanoscale organization and diffusion in the brain extracellular space through
hyaluronan remodeling. Nature Communications, Nature Publishing Group, 2020, 11 (1), pp.3440.
�10.1038/s41467-020-17328-9�. �inserm-02904850�
Synucleinopathy alters nanoscale organization and
diffusion in the brain extracellular space through
hyaluronan remodeling
Federico N. Soria
1,2,3
, Chiara Paviolo
4,5
, Evelyne Doudnikoff
1,2
, Marie-Laure Arotcarena
1,2
,
Antony Lee
4,5
, Noémie Danné
4,5
, Amit Kumar Mandal
4,5
, Philippe Gosset
1,2
, Benjamin Dehay
1,2
,
Laurent Groc
6,7
, Laurent Cognet
4,5
✉
& Erwan Bezard
1,2
✉
In recent years, exploration of the brain extracellular space (ECS) has made remarkable
progress, including nanoscopic characterizations. However, whether ECS precise
conforma-tion is altered during brain pathology remains unknown. Here we study the nanoscale
organization of pathological ECS in adult mice under degenerative conditions. Using electron
microscopy in cryo
fixed tissue and single nanotube tracking in live brain slices combined with
super-resolution imaging analysis, we
find enlarged ECS dimensions and increased nanoscale
diffusion after
α-synuclein-induced neurodegeneration. These animals display a degraded
hyaluronan matrix in areas close to reactive microglia. Furthermore, experimental hyaluronan
depletion in vivo reduces dopaminergic cell loss and
α-synuclein load, induces microgliosis
and increases ECS diffusivity, highlighting hyaluronan as diffusional barrier and local tissue
organizer. These
findings demonstrate the interplay of ECS, extracellular matrix and glia in
pathology, unraveling ECS features relevant for the
α-synuclein propagation hypothesis and
suggesting matrix manipulation as a disease-modifying strategy.
https://doi.org/10.1038/s41467-020-17328-9OPEN
1Université de Bordeaux, Institut des Maladies Neurodégénératives, UMR 5293, 33076 Bordeaux, France.2Centre National de la Recherche Scientifique,
IMN, UMR 5293, 33076 Bordeaux, France.3Achucarro Basque Center for Neuroscience, Universidad del País Vasco (UPV/EHU), 48940 Leioa, Spain.
4Université de Bordeaux, Laboratoire Photonique Numérique et Nanosciences, UMR 5298, 33400 Talence, France.5Institut d’Optique & Centre National de
la Recherche Scientifique, LP2N, UMR 5298, 33400 Talence, France.6Université de Bordeaux, Interdisciplinary Institute for Neuroscience, UMR 5297,
33076 Bordeaux, France.7Centre National de la Recherche Scientifique, IINS, UMR 5297, 33076 Bordeaux, France. ✉email:[email protected];
123456789
T
he brain extracellular microenvironment is the active
milieu surrounding cellular membranes in the central
nervous system (CNS). It is composed by a dynamic
compartment, the extracellular space (ECS), which contains the
interstitial
fluid and a plastic scaffold known as the extracellular
matrix (ECM). The ECS provides a reservoir of ions to support
membrane and action potentials, playing a fundamental role in
the diffusion of chemical signals and intercellular
communica-tion
1–3. Additionally, the ECS is thought to be implicated in the
large-scale advection of molecules by determining the bulk
flow
of interstitial
fluid
4,5, possibly through convective or local
flow
6.
With a width down to the nanometer range, the ECS has
remained a black box in neuroscience until very recently
7, and
imaging the adult brain ECS is still a challenging endeavor.
The main structural component of the brain ECS is the
ECM, a dense network of macromolecules secreted by glia and
neurons
8. Unlike the ECM from connective tissue, where
collagen is the main unit, the neural interstitial matrix mainly
consists of long chains of the glycan polymer hyaluronan
9.
Other ECM components bind to large hyaluronan molecules
forming a self-assembled matrix that functions as
cell-attaching scaffold and maintains the patency of the ECS,
influencing its organization at a multilevel scale
7.
Interestingly, hyaluronan has also manifold signaling
proper-ties depending on its size
10. High-molecular
weight-hyalur-onan
(HMW-HA)
elicits
inflammatory and
anti-proliferative responses, whereas short hyaluronan fragments
activate pro-inflammatory pathways in specific cells such as
microglia
11. Although the function of ECM during CNS
development and plasticity is well documented, major
ques-tions remain about its involvement in the pathophysiology of
the mature brain
12.
The implications of this complex extracellular system on the
etiology
and
progression
of
brain
disorders
remain
largely underexplored. While limited information on ECM
dynamics exists in selected neuropathologies such as multiple
sclerosis and stroke, data on Parkinson’s disease (PD) or other
proteinopathies is scarce
12,13. Furthermore, as we enter the
realm of super-resolved ECS exploration
14, our data on the
pathological brain ECS is incomplete. In healthy tissue, ECS
nanoscale topology has been described both in cryofixed
15–17and live samples
18. Moreover, we have recently reported the
ECS local nanoscale organization and diffusivity on young
2and adult live brain
19using single-walled carbon nanotubes
(SWCNTs) as super-resolution imaging probes. Whether these
parameters change during disease states and whether an
interplay exists between the ECS and the pathological process
is still unknown.
Here we report on the dynamics and organization of the
brain extracellular microenvironment in a PD pathological
context, using a combination of state-of-the-art imaging
approaches and an established in vivo model of
α-synuclein
(α-syn)-induced dopaminergic neurodegeneration
20,21, a proxy of
synucleinopathy leading to PD. We describe profound
altera-tions in ECS morphological and diffusional parameters in the
substantia nigra of parkinsonian mice at nanometer resolution.
We further characterize the pathological ECS by exploring the
status of the hyaluronan network in vivo, its relation with
reactive microglia and inflammation, and dopaminergic cell
loss and ECS parameters after acute and chronic hyaluronan
depletion. Our results reveal an interplay between ECS, ECM,
and neurodegeneration, shedding light upon a neglected
compartment for the diffusion of aggregated
α-synuclein seeds.
This integrative study explores the pathological extracellular
microenvironment as a whole in adult brain tissue, and paves
the way to explore the ECS in other models of proteinopathies.
Results
α-syn-induced neuronal loss enlarges the extracellular space.
To investigate the ECS in a context of neurodegeneration, we
employed a unique paradigm of
α-syn-induced dopaminergic
neuronal loss by unilateral inoculation of Lewy body (LB)
frac-tions derived from PD patients into the substantia nigra (SN) of
adult mice
20,21. Control animals received fractions containing
only soluble
α-syn (noLB), while the LB fractions contained α-syn
seeds in its aggregated form. Stereological cell counts of tyrosine
hydroxylase (TH) immunostaining confirmed 47% nigral
dopa-minergic degeneration (ipsi/contra TH-positive cell ratio: 0.96 ±
0.05 noLB, 0.53 ± 0.05 LB) 4 months after LB inoculation (Fig.
1
a,
b and Supplementary Fig. 1), a similar rate to the
histopatholo-gical features of this model, that have been extensively described
elsewhere
20,21.
Electron microscopy (EM) has been historically used to study
the topology of brain tissue at sub-micron resolution. However,
ultrastructural analysis of the ECS has proven difficult to
implement due to dehydration during
fixation and sample
processing, which shrinks the ECS and underestimates its size.
While isotonic membrane-impermeant buffers have been used to
overcome this artifact with relative success
22,23, cryofixation
studies have shown effective ECS preservation in cerebellum
15and mouse neocortex
16,17. We, therefore, used cryofixation of
brain tissue rapidly removed from LB-inoculated mice to reveal
the ECS in the SN. High-pressure cryofixation prevents formation
of ice crystals and membrane rupture and freeze-substitution
resin embedding retains molecules in their hydrated positions,
effectively preserving the extracellular space when compared to
classical aldehyde
fixation (Fig.
1
c). The result is a more accurate
representation of the ECS, where key elements of the neuropil
retain their physiological dimensions (Supplementary Fig. 2a).
This preparation was able to preserve ECS heterogeneity as we
could discern, for instance, compact intermembrane gaps at the
synaptic cleft as well as large perisynaptic spaces surrounding
them (Supplementary Fig. 2b, c). Details were sufficiently clear to
delineate the ECS and resolve extracellular gaps of 20 nm width
(Supplementary Fig. 2d).
With this tool in hand, we quantitatively analyzed the ECS
dimensions in the SN of control and LB-inoculated mice. After
the manual segmentation of EM ultramicrographs, we calculated
the relative ECS area (Fig.
1
d). This estimation of ECS volume
fraction (defined as α in previous studies) showed variations in
the SN between 15% and 24%, in accordance with previously
reported
α values for other brain regions in mice
1. There was a
clear tendency for larger ECS volume fractions in the SN of
LB-inoculated mice (16.8 ± 1.1% noLB, 20.0 ± 1.0% LB; Fig.
1
e)
although the difference regarding control nearly achieved
statistical significance (P = 0.064). Since volume fraction is a
global parameter that takes into account the region sampled as a
whole, to take advantage of the nanometric resolution achieved
by EM we next explored local geometric variations by analyzing
individual 2D compartments in binary images of the ECS
(Fig.
1
d). Skeletonization revealed heterogeneous lengths,
detect-ing significantly longer ECS compartments in parkinsonian mice
when compared to control (0.52 ± 0.05 µm noLB, 0.70 ± 0.12 µm
LB; Fig.
1
f). Analysis of 2D-local thickness identified larger ECS
widths in the SN of LB-inoculated mice when compared to
control (112 ± 7 nm noLB, 140 ± 6 nm LB; Fig.
1
g). Mapping local
ECS widths yielded diverse geometries, where large pools with
diameters around 200 nm are connected by narrow channels of
less than 100 nm width (Fig.
1
h). The distribution of ECS widths
was positively skewed, with ~50% values under 100 nm (Fig.
1
i).
Differences were greater in the larger dimensions (>200 nm), as
the SN of LB-inoculated mice displayed twice the number of large
Thus, neurodegeneration would affect how the ECS volume
fraction is spatially distributed, rather than the volume fraction
per se.
Synucleinopathy increases extracellular space diffusivity.
Molecular mobility through the ECS is key to important
phy-siological events, such as signal transmission or ion
concentra-tion
24. Hence, determining live ECS local diffusive environment is
as essential as knowing its dimension. We have recently used
single-molecule tracking of
fluorescent SWCNTs to quantitatively
visualize nanoscale dimensions and diffusivity in the adult mouse
ECS by near-infrared (NIR) imaging
19. Here, we used acute slices
of LB-inoculated mice (i.e., 4 months post-inoculation) 1 h after
in vivo injection of SWCNTs to explore local ECS parameters in a
neurodegenerative context (Fig.
2
a, b). As non-internalizable ECS
fluorescent probes of large aspect-ratio
2, Brownian motion of
SWCNTs is effectively constrained by brain ECS geometry and
composition with respect to free medium (Supplementary
Movie 1). SWCNTs exceptional photostability enables long-term
acquisitions with negligible decrease in
fluorescence
(Supple-mentary Movie 2). However, since they rarely remain confined to
a specific area, individual acquisitions of 5–10 min were
per-formed. Single-molecule localization allowed for sub-wavelength
(~50 nm) tracking of SWCNTs and provided super-resolution
analysis of ECS dimensions. In addition, iterative analysis of
finite
time-windows rendered instantaneous relative diffusivity (D
inst/
D
ref) maps of the nigral ECS with nanoscale precision
(Supple-mentary Fig. 3).
Local instantaneous diffusivity maps revealed a diverse ECS in
both healthy and degenerative SN, where diffusional patterns
change drastically within few nanometers (Fig.
2
c and
Supple-mentary Fig. 4). SWCNT tracks revealed two different
Channels Small pools Large pools 0 nm 200 nm 400 nm noLB LBHigh-pressure cryofixation Glutaraldehyde fixation
Contra Ipsi (4 months) P70 P190 Cryofixation (ECS preservation) LB or noLB fractions into SNc of mice Segmentation 2D local thickness (local width) Skeleton length (local lenght) Binary image High-pressure cryofixation Freeze-substitution embedding Electron microscopy P < 0.001 ECS widths Compartment lengths Volume fraction
a
b
c
d
e
f
g
h
i
j
6000 P = 0.55 P = 0.004 TH + neurons in SN 4000 2000 0 noLB LB 25 1.0 0.8 0.6 0.4 Sk eleton length ( μ m) 0.2 0.0 0 1 2 μm 3 4 0 100 200nm 300 400 0 100 Local width (nm) 200 300 400 500 100 200 150 100 ECS widths (nm) 50 0 75 50 25 Cum ulativ e frequency (%) 0 12 10 8 6 Relativ e frequency (%) 0 2 4 100 75 50 25 Cum ulativ e frequency (%) 0 100 75 50 % 25 0 P = 0.064 P = 0.031 P = 0.0009 P < 0.0001 P = 0.010 20 15 ECS % 10noLB LB noLB LB noLB LB
noLB LB LB noLB LB noLB LB noLB
Fig. 1α-syn-induced neurodegeneration enlarges the extracellular space locally. a Experimental timeline of the mouse model of Lewy body (LB)-induced
neurodegeneration.b TH stereological cell counts confirmed 40% dopaminergic cell loss typically observed in the SN of LB-inoculated mice (paired
two-tailed Student’s t test, n = 6 mice). c Ultramicrographs of cryofixed (left) vs chemically fixed (right) brain tissue (ECS is pseudo-colored). Classic
glutaraldehydefixation artefactually reduces ECS size, whereas high-pressure cryofixation represents more accurately ECS dimensions. Scale bar, 1 µm.
d Schematic diagram of cryofixation, freeze-substitution, EM and image analysis protocol. e ECS volume fraction in the SN of LB and noLB-mice (two-tailed
Student’s t test, n = 6 SNs). f, g Mean and cumulative distribution of ECS compartment lengths (f) and local widths (g) in the SN after LB-induced
neurodegeneration (Two-tailed Student’s t test and Kolmogorov–Smirnov test, n = 6 SNs). h ECS local width maps from Ctrl and LB-inoculated mice
display the characteristic channels-and-pools configuration of the ECS, revealing increased dimensions in the degenerated SN. Scale bar, 1 µm. i Distribution
of ECS local widths from all maps generated in the study.j Proportions of ECS compartments categorized by width (Large pools, >200 nm; small pools,
100–200 nm; channels, <100 nm) expressed as % of ECS (Chi-square test) showing that LB-induced neurodegeneration affects how the ECS is spatially
configurations: long explorations spanning several µm, with ECS
channels connected by pools in a similar fashion to EM images
(Supplementary Fig. 4a), and spatially restricted compartments
where SWCNTs move within the same domain (Supplementary
Fig. 4b). Quantitative analysis detected a highly constrained ECS
in the control SN, where SWCNT movement was hindered more
than 10-fold respect to free medium (D
inst/D
refmedian
= 0.026,
IQR
= 0.017-0.038; Fig.
2
d, e). On the contrary, in LB-inoculated
mice we observed increased local diffusivity respect to control,
with a significant proportion of values falling within the 0.1–0.2
range (median
= 0.042, IQR = 0.021−0.080; Fig.
2
d, e).
Further-more, in LB-exposed animals, SWCNTs exploration covered a
significantly broader ECS area within the same time-frame (6.2 ±
1.4 µm
2noLB, 16.2 ± 4.0 µm
2LB; Supplementary Fig. 4c and
Supplementary Movie 3). These results indicate increased ECS
nanoscale diffusion after LB-induced neurodegeneration.
In a similar fashion to traditional ECS diffusional studies
25,
single SWCNT trajectories can reveal the nanoscale geometry of
the compartment explored by applying a super-resolution
microscopy methodology. Dimensional maps in the live brain
(Fig.
2
f) confirmed the nanoscale channels-and-pools ECS
configuration, whereas quantitative analysis corroborated EM
results, revealing increased local ECS widths after LB-induced
neurodegeneration (median
= 114 nm, IQR = 76–170 nm noLB,
median
= 119 nm, IQR = 75–187 nm LB; Fig.
2
g, h).
Interest-ingly, we found weak correlation between ECS dimensions and
Image analysis noLB LB 0.25 0.2 0.1 0.05 0.15 0.01 Dinst/Dref ECS instantaneous relative diffusivity50 nm 100 nm 200 nm 300 nm 400 nm 500 nm noLB LB ECS dimensions SWCNTs into lateral ventricle of live mice 300 μm λ/4 Polarizing beamsplitter 845 nm laser Bright light T ° probe aCSF out LPF Sample aCSF in 986 nm EM-CCD 1 h Oxygenated aCSF NIR imaging (4 months) P70 P190 Single-nanotube tracking in live brain LB or noLB fractions into SNc of mice i j k i j k noLB LB
a
b
c
d
e
f
g
h
i
j
k
l
60× 30 noLB P < 0.0001 P < 0.0001 LB noLB LB noLB LB noLB LB 20 10 Relative frequency (%) 0 15 10 5 Relative frequency (%) 0 100 75 25 50 Cumulative frequency (%) 0 100 75 25 50 Cumulative frequency (%) 0 0.00 0 100 ECS width (nm) 200 300 400 0 100 nm 200 300 400 0 0.0 0.1 0.2 0.3 ECS width (nm) 600 200 400 500 0.05 0.10 Relative diffusivity (Dinst/Dref)Relative diffusivity ( Dinst /Dref ) Dinst/Dref 0.15 0.20 0.0 0.1 0.2
Fig. 2 Single-nanotube tracking reveals increased ECS nanoscale diffusivity and width after synucleinopathy. a Experimental timeline. b Schematic diagram of SWCNT imaging and tracking setup. Fluorescent SWCNTs are administered in vivo into the lateral ventricle of adult mice and allowed to diffuse
into the brain for 1 h. Acute brain slices are imaged at 37 °C using a NIRfluorescence microscope equipped with an EM-CCD camera. c ECS instantaneous
relative diffusivity maps reveal a heterogeneous ECS in the SN, with increased nanoscale diffusion after LB-induced neurodegeneration. Scale bar, 2µm.
d, e Frequency (d) and cumulative (e) distributions of local relative diffusivity values (Dinst/Dref) in the nigral ECS indicate augmented nanoscale diffusion in
the parkinsonian SN (Kolmogorov–Smirnov test, n = 4 mice). f Maps of local ECS dimensions in the SN of noLB and LB-inoculated mice, corroborating in
live brain the channels-and-pools configuration observed in cryofixed tissue. Scale bar, 2 µm. g, h Frequency (g) and cumulative (h) distributions of local
ECS dimensions show increased ECS width in LB-inoculated mice (Kolmogorov–Smirnov test, n = 4 mice). i–k Insets from (c, f). Increased diffusion is not
always correlated to enlarged dimensions, suggesting that inhomogeneous diffusion is not only dependent on environmental geometry.l Scatter plot of all
diffusivity (Pearson’s r = 0.195 noLB, 0.353 LB; Fig.
2
i–l),
suggesting that spatial constriction is not necessarily the central
determinant of ECS diffusion inhomogeneities at the nanoscale.
Synucleinopathy induces degradation of the hyaluronan
matrix. The main diffusional barrier in the brain ECS is the
neural interstitial matrix
1,24. As its main scaffolding molecule,
changes in hyaluronan (HA) content can dramatically alter other
ECM components
26and consequently ECS parameters
2,27. We,
therefore, analyzed the status of the HA network in the mouse SN
after LB-induced neurodegeneration by confocal microscopy.
Hyaluronic acid-binding protein (HABP) staining in the murine
SN was more intense than in surrounding regions, but the
staining pattern differed between subareas (Supplementary
Fig. 5a). The substantia nigra pars compacta (SNc), which harbors
packed dopaminergic neurons projecting mainly to the striatum,
presented a dense interstitial HA matrix (Supplementary Fig. 5b).
In the substantia nigra pars reticulata (SNr), which contains
dendrites radiating from the SNc and scattered GABAergic
neurons, HA staining was more disperse but especially intense in
the perineuronal nets (PNNs; Supplementary Fig. 5b).
This precise organization was substantially altered after
LB-induced neurodegeneration. The interstitial matrix appeared
more diffuse, and the HA cable-like structures often described
in literature
28were limited to dispersed dots (Fig.
3
a, b). Despite
neurodegeneration and HA disruption, chondroitin-sulfate
pro-teoglycans (CSPGs) appeared unaffected as observed by the
archetypical staining of PNNs by Wisteria Floribunda Agglutinin
(WFA; Fig.
3
c), as reported by others
29–31. Quantification
detected decreased HA immunostaining in the SN of
LB-inoculated mice compared to control (3.3 ± 0.4% vs 6.3 ± 1.2%;
Fig.
3
d). Morphological analysis revealed shorter HA cables in
LB-inoculated mice (median
= 0.48 µm noLB, 0.34 µm LB;
Fig.
3
e). Despite HA being a linear polysaccharide, it appears as
an interconnected network thanks to cross-linking by hyalectans
and tenascins, forming supramolecular complexes of varying
stability
32. Measuring HA cross-linking provide, thus, an
estimation of matrix interconnectivity and organization. We,
therefore, quantified HA network complexity by fractal analysis
(D
b)
33and detected lower values in LB-inoculated mice (1.53 ±
0.04% noLB, 1.35 ± 0.05% LB; Fig.
3
f), indicating decreased HA
network complexity in the degenerated SN.
To investigate the basis for HA disruption, we next analyzed
mRNA expression of genes related to HA synthesis/catabolism in
ventral midbrain homogenates from control and LB-inoculated
mice. We detected no differences in mRNA expression of HA
synthases (Has) or hyaluronidases (Hyal). Since HA catabolism
also depends on receptor-mediated endocytosis
34, we examined
mRNA levels of HA receptors. We found increased expression of
CD44 (2.6 ± 0.4-fold; Fig.
3
g), the main HA receptor, expressed
mostly in glia and associated with inflammation in the CNS
10,35.
Additionally, we tested several glia and inflammation-related
genes (Fig.
3
h), detecting a significant increase in mRNA levels of
microglia/macrophage activation marker CD68 (1.6 ± 0.1-fold
change) and pro-inflammatory cytokine TNF-α (5.7 ± 1.8-fold
change), indicate ongoing inflammation in the SN after
LB-induced neurodegeneration.
Reactive microglia engulf hyaluronan after synucleinopathy.
Whereas reactive microglia has been described in several PD
animal models, experimental data on non-transgenic
α-synuclein-based PD models is scarce
36. We, therefore, characterized the
microglial phenotype after LB-induced neurodegeneration by
immunohistochemistry. In control mice, Iba1 immunostaining
was restricted mostly to the SNr, with few microglial somas in the
SNc (Fig.
4
a, b), as described in literature
37. This pattern was
substantially altered in LB-inoculated mice, with more than
twofold microglial cells (132 ± 14 noLB, 267 ± 29 LB; Fig.
4
c) and
a
b
c
d
e
f
g
h
HABP staining Binary Skeleton noLB noLB LB LB noLB LB 255 0 noLB LB WFA staining SNr (LB) SNc (LB) SNc SNr 12 100 75 50 Cum u lativ e frequency (%) 25 0 1.8 Hyaluronan-related genes 3 4 2 F o ld change 1 0 Has1 Has2 n.d. n.d. Has3 Hy al1 Hy al2 Hy al3 Cd44 Hmmr Icam1 1.6 1.4 F ractal dimension (D b ) 1.2 1.0 0 Skeleton length (μm) 1 2 3 P = 0.046 P < 0.0001 P = 0.033 P = 0.015 P = 0.030 Inflammation-related genes 8 10 4 6 F o ld change 2 0 Itgam Gf ap n.d. n.d. n.d. Cd3e Ptprc Cd68 Tnf a Tlr2 Tlr4 T rem2 II1b II6 P = 0.045 10 8 6 HA area (% of SN) 4 2 0 noLB LB noLB LBFig. 3 The hyaluronan matrix is degraded after synucleinopathy. a Confocal micrographs from the SN of noLB and LB-inoculated mice, showing a
widespread disruption of the matrix in the degenerated SN and fewer cable-like HA structures. Scale bar, 50µm. b Binary and skeletonized images of the
HA network used to quantify HA matrix disruption. Note the dotted, degraded pattern of HA in the degenerated SN. Scale bar, 50µm. c WFA staining in
the SN of LB-inoculated mice reveals no disruption of CSPGs. Scale bar, 50µm. Color bar represents fluorescence intensity. d HA levels are decreased in
the SN of LB-inoculated mice (two-tailed Student’s t test, n = 6 mice). e Cumulative distributions of HA skeleton lengths indicate shorter cable-like
structures after LB-induced neurodegeneration (Kolmogorov–Smirnov test, n = 6 mice). f Fractal dimension analysis of the HA network shows disrupted
matrix interconnectivity in the parkinsonian SN (two-tailed Student’s t test, n = 6 mice,). g, h mRNA expression analysis of HA-related genes (g) and
inflammation-related genes (h) in ventral midbrain homogenates of LB and noLB-inoculated mice (two-tailed Student’s t test, n = 4 mice). Error bars
Iba1 staining (1.4 ± 0.3% noLB, 3.2 ± 0.5% LB; Fig.
4
c) in the SNc.
Microgliosis was evident in SNc areas depleted of TH-positive
cells, but also in regions where dopaminergic cell loss was milder
(Supplementary Fig. 6a, b).
We next examined the activation status and phagocytic activity
of microglia in a context of nigral matrix degradation by multiple
immunostaining. We detected HA particles engulfed by microglia
in both noLB and LB-inoculated mice (Fig.
4
d). HABP staining
inside Iba1-positive cells co-localized with lysosomal marker
CD68 (Fig.
4
d, e). Although not all CD68-positive pouches were
positive for HA, both HA-positive and HA-negative pouches
were found in the same cell (Supplementary Fig. 6c, d). Despite
these results suggesting a physiological role of microglia in HA
turnover, the number of microglial cells with HA inclusions was
significantly increased after LB-induced neurodegeneration (23.5
± 3.8% noLB, 66.1 ± 7.2% LB; Fig.
4
f), often displaying more than
one HA-positive pouch per cell (Fig.
4
d, arrowheads). Finally,
CD68 staining was significantly higher in LB-inoculated mice
(0.43 ± 0.07% vs. 0.10 ± 0.02%; Fig.
4
g), confirming qPCR data
and indicating microglial activation in the lesioned SN. Taken
together, these results suggest an involvement of reactive
microglia in HA matrix degradation after LB-induced
dopami-nergic cell loss.
Hyaluronan breakdown is neuroprotective in LB-injected mice.
Having described the consequences of neurodegeneration on the
brain extracellular microenvironment, we next enquired whether
modification of ECS/ECM would alter the pathological process.
Degradation of the HA matrix by intracerebral injection of
hya-luronidase (Hyase) has proven a useful tool to explore ECM
modification in vivo
30,38, and we have previously reported its
effect by observing increased ECS nanoscale diffusion in the
rodent brain
2. We, therefore, inoculated LB fractions concomitant
with Hyase (or PBS as control) in the murine SN (Fig.
5
a). Hyase
did not alter the aggregation status of LB fractions, as observed by
unchanged thioflavin T fluorescence profiles (Supplementary
Fig. 7a). Four months post-inoculation, LB
+ PBS group
dis-played 40% neurodegeneration (Fig.
5
b–d), similar to the classical
LB-inoculation protocol. In contrast, stereological cell counts
revealed only 20% dopaminergic cell loss in LB
+
Hyase-inocu-lated mice (2736 ± 257 cells LB
+ PBS, 3957 ± 318 LB + Hyase;
Fig.
5
c, d). We noticed fewer Proteinase K (PK)-resistant
α-syn
aggregates in LB
+ Hyase-treated mice (Supplementary Fig. 7b),
although the low number of aggregates rendered any
quantifi-cation futile. To evaluate whether the neuroprotective effect of
Hyase was exclusively related to HA, we co-inoculated LB with
chondroitinase (ChABC) to degrade CSPGs, another ECM
component associated to structural HA. ChABC injection in vivo
effectively removed PNNs in the SN (Supplementary Fig. 8), but
did not alter the typical 0.6 ipsi/contra ratio triggered by LB
(Fig.
5
c, d), indicating that Hyase effect is connected to HA
degradation rather than to ECM disorganization. Co-injection of
LB with high-molecular weight HA (HMW-HA) also failed to
reduce LB-induced neurodegeneration (Fig.
5
c, d). However,
concomitant injection of LB with low-molecular weight HA
(LMW-HA) ameliorated dopaminergic cell loss to a similar extent
than Hyase treatment (3560 ± 144 cells; Fig.
5
c, d), suggesting that
HA breakdown into small fragments is responsible for the
neu-roprotective effect, instead of merely a modification of HA
content.
Hyase effect in the rodent brain lasts only a few days, due to the
high replenishing ratio of HA in vivo which reappears as isolated
patches 3–5 days after injection
38. Furthermore, proteopathic
seeding from exogenous
α-syn typically occurs within 24 h after
inoculation of LB fractions
20. We, therefore, investigated the early
events (72 h) after LB
+ Hyase inoculation (Fig.
5
e). Human
2 1
noLB LB
Orthogonal projections Iba1 CD68HABP DAPI Engulfed hyaluronan
noLB LB
TH Iba1 Single z -plane
SNc
SNr
noLB LB
SNc SNr
Iba1 staining only
a
b
c
d
e
f
g
400 P = 0.002 P = 0.010 P = 0.0003 P = 0.002 300 200 Iba1 + cells/mm 2 (SNc) 100 0 100 0.8 0.6 0.4 0.2 0.0 80 Iba1 + cells with HA inclusions (%) CD68 area (% of SN) 60 40 0 20 6 1.0 0.5 0.0 0 5 10 1.0 0.5 0.0 0 μm 15 5 10 4 2 Iba1 + staining (% of SNc) 0noLB LB noLB LB noLB LB noLB LB
Profile 2 Profile 1
Relative fluorescence
Fig. 4 Reactive microglia populate the SNc and phagocytes hyaluronan afterα-syn-induced neurodegeneration. a, b Confocal images showing
distribution of microglia (Iba1) in the SN of mice. In control animals, microglia populate mostly the SNr and is scarce in the SNc, packed with TH-positive
neurons. This pattern is disrupted in LB-inoculated mice. Scale bars, 50µm. c Quantification of Iba1-positive cells and Iba1 area in the SNc show microgliosis
in this region after LB-induced neurodegeneration (two-tailed Student’s t test, n = 6 mice). d Orthogonal projections showing HA phagocytosis by
microglia in the murine SN. Engulfed HA co-localizes with lysosomal marker CD68 (arrowheads), although some CD68 dots are negative for HABP (arrows). Microglia from LB-inoculated mice display more HA inclusions, as seen in this micrograph where up to 4 pouches of engulfed HA can be
observed. Scale bar, 10µm. e Fluorescence intensity profiles from (d). f Quantification of microglia with HA inclusions in the SN of LB and noLB-mice
(two-tailed Student’s t test, n = 6 mice). g Quantification of CD68 levels indicate microglial activation in the SN of LB-inoculated mice (two-tailed Student’s
α-syn staining was significantly lower in the SN after LB + Hyase
injection in comparison to LB
+ PBS (0.08 ± 0.03% vs. 0.21 ±
0.03%; Fig.
5
f), indicating reduced patient-derived
α-syn load in
Hyase-treated animals. This decrease in
α-syn inoculum was
partially reproduced by LMW-HA co-injection, but not by
ChABC treatment (Fig.
5
f). Human
α-syn staining in the
contralateral side was absent (Fig.
5
f), demonstrating antibody
specificity. We did not find human α-syn engulfed by microglia,
although we did observe human
α-syn-positive cells surrounded
by multiple Iba1-positive somas (Fig.
5
g), suggesting microglia
can somehow sense damaged or infected cells, a hypothesis
recently demonstrated in experimental stroke
39. Moreover,
Iba1 staining showed early microglial invasion into the LB
+
PBS-treated SNc, as previously seen for 4-month animals
(Fig.
5
h), suggesting that microglial activation takes place shortly
after LB inoculation. Interestingly, LB
+ Hyase-treated animals
displayed several-fold higher microglial activation in the
ipsilateral SN compared to LB
+ PBS, as indicated by
Iba1-positive cell count (1036 ± 261 cells vs. 377 ± 56; Fig.
5
i),
Iba1 staining (22.6 ± 5.4% vs. 9.1 ± 1.3%; Fig.
5
j) and CD68
stain-ing (6.3 ± 2.6% vs. 0.4 ± 0.1%; Fig.
5
k). Microgliosis was partially
reproduced in the LB
+ LMW-HA group, but not in the LB +
ChABC group (Fig.
5
i), suggesting that HA small fragments
might be driving neuroinflammation. In fact, HABP labeling
LB+PBSLB+Hyaluronidase
Contralateral Ipsilateral
Iba1 CD68 Hyaluronan 72 h post injection
LB+PBS LB+Hyase SNc SNr (72 h) P70 P73 Euthanasia LB + Hyaluronidase into SNc of mice HA depletion (4 months) P70 P190 Euthanasia LB + Hyaluronidase into SNc of mice Hyaluronan depletion 5 days
a
b
c
d
e
f
g
h
i
j
k
l
m
6000 1.0 0.8 0.6 0.4 Ratio (Ipsi/Contr a ) 0.2 0.0 P = 0.015 P = 0.003 P = 0.025 P = 0.007 P = 0.029 P = 0.009 P = 0.005 P = 0.023 P = 0.031 P = 0.021 ContraIba1human α-syn MIP
Ipsi Contra Ipsi 4000 2000 TH +Neurons in Sn 0 LB+PBS LB+Hy ase LB+LMW -HA LB+ChABCLB+HMW -HA LB+PBS LB+Hy ase LB+LMW -HA LB+ChABC LB+PBSLB+Hy ase LB+LMW -HA LB+ChABC LB+PBS LB+PBS LB+Hy ase LB+Hy ase LB+PBSLB+Hy ase LB+PBSLB+Hy ase LB+PBSLB+Hy ase LB+LMW -HA LB+ChABC LB+HMW -HA LB+PBS
72 h post injection 72 h post injection
Ipsilater al Contr alater al Human α-syn
LB+Hyase LB+LMW-HA LB+ChABC
0.3 Human α -syn (% of SN) 0.2 0.1 0.0 2000 40 30 20 10 0 1500 1000 Iba1 + cells/mm 2 Iba1 area (%) 15 10 5 0 CD68 area (%) 15 10 5 0 2.0 1.2 1.8 1.6 1.4 Hy aluronan fr actal dimension (Db) 1.0 HABP area (%) 500 0 255 0
Fig. 5 Hyaluronan fragmentation ameliorates LB-induced neurodegeneration by reducing toxic-α-syn load. a Experimental timeline for (b–d).
Hyaluronidase (Hyase) effect lasts only a few days post-injection, since HA is rapidly replenished in vivo.b TH staining shows partial neuroprotection in
the ipsilateral SN 4 months after LB+ Hyase inoculation. Scale bar, 200 µm. c, d Stereology revealed a reduction (from 40% to 20%) in dopaminergic cell
loss when LB were co-injected with Hyase or low-molecular weight HA (LMW-HA), but not with chondroitinase ABC (ChABC), suggesting an effect
mediated by HA breakdown. Graphs show TH-positive cell count (c) and ipsilateral/contralateral TH-positive cell ratio (d) (One-way ANOVA with Tukey’s
post-hoc test,n = 4–6 mice). e Experimental timeline for (f–m). Animals were euthanized at the peak of Hyase effect. f Confocal micrographs and
quantification of human α-syn staining in the SN 72 h after LB + Hyase injection show decreased exogenous α-syn load. Scale bar, 50 µm. Color bar
representsfluorescence intensity. g Microglial cells surround a human α-syn-positive cell. Scale bar, 10 µm. h Substantial microglial activation in LB +
Hyase-treated SN shortly after injection, suggesting an early effect of HA cleavage. Scale bar, 100µm. i–l Quantification of Iba1-positive cells, Iba1, CD68
and HABP levels 72 h after LB inoculation co-injected with various ECM-modification molecules (two-way ANOVA with Holm–Sidak’s post-hoc test, n = 4
mice).m Fractal analysis of HABP staining confirms HA matrix disruption by Hyase (two-way ANOVA with Holm–Sidak’s post-hoc test, n = 4 mice). Data
confirmed HA depletion (10.1 ± 0.7% LB + PBS
contra, 2.3 ± 0.3%
LB
+ Hyase
ipsi; Fig.
5
l) whereas fractal analysis detected heavy
HA network disruption 72 h after Hyase injection (Fig.
5
m).
Taken together, these results indicate that acute HA depletion,
most certainly via HA fragmentation, exacerbates the early (72 h)
microglial activation observed after LB inoculation and reduces
proteopathic seeds load. These events ultimately result in
long-term neuroprotection (i.e., 4 months).
Hyaluronan depletion affects mostly ECS diffusivity. We next
explored the effect of chronic HA modification on ECS parameters
and on the pathological process. Long-term HA depletion was
achieved by chronic treatment with 4-methylumbelliferone (4MU,
Fig.
6
a), a Has inhibitor extensively used in vivo
40. HA depletion
was confirmed in blood samples by ELISA and by
immunohis-tochemistry in different brain regions (Fig.
6
b, c and
Supple-mentary Fig. 9). First, we checked whether chronic HA depletion
alters ECS local diffusion in the SN of LB-inoculated mice by
SWCNT tracking in acute slices. We observed increased relative
diffusivity in 4MU-treated animals with respect to normal diet, an
increase slightly exacerbated after neurodegeneration (median
=
0.025 Ctrl, 0.040 4MU, 0.049 4MU-LB; Fig.
6
d, f, g and
Supple-mentary Movie 4). ECS widths were also increased in both 4MU
and 4MU
+ LB groups. However, ECS enlargement was much
more pronounced with the additional presence of LB (median
=
135 nm Ctrl, 154 nm 4MU, 195 nm 4MU-LB; Fig.
6
e, h, i),
sug-gesting that neurodegeneration has more impact on ECS
mor-phology (widths), while ECS diffusivity depends mostly on HA
fluctuation (Fig.
6
f vs.
6
h). Finally, we examined nigral
neurode-generation at 4 months post-LB inoculation, and we detected a
non-significant trend for neuroprotection in the 4MU-treated
animals with respect to normal diet (35.9 ± 7.6% 4MU-LB, 45.1 ±
6.8% Ctrl-LB; Supplementary Fig. 10a, b), indicating that chronic
HA depletion has milder effects on dopaminergic cell loss than
acute depletion with Hyase, probably due to compensatory
mechanisms. Widespread microgliosis was observed after 1 month
of 4MU-dependent HA depletion (Supplementary Fig. 10c), as
evidenced by increased Iba1 staining and Iba1-positive somas in
4MU (hyaluronan depletion)
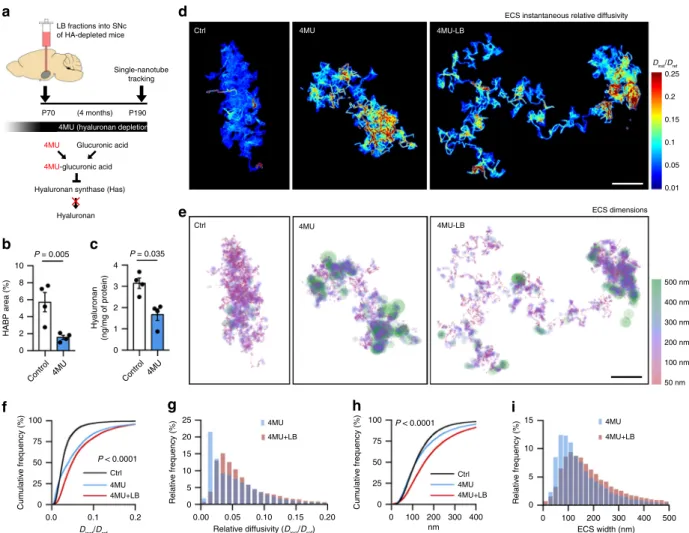
(4 months) P70 P190 Single-nanotube tracking LB fractions into SNc of HA-depleted mice
Hyaluronan synthase (Has)
Hyaluronan
4MU-glucuronic acid
Glucuronic acid 4MU Ctrl 4MU 4MU-LB 50 nm 100 nm 200 nm 300 nm 400 nm 500 nm ECS dimensions 0.25 0.2 0.1 0.05 0.15 0.01 Dinst/Dref ECS instantaneous relative diffusivity
Ctrl 4MU 4MU-LB
a
b
c
d
e
f
g
h
i
10 P = 0.005 P = 0.035 P < 0.0001 P < 0.0001 8 6 4 HABP area (%) 2 0 100 75 50 25 Cum u lativ e frequency (%) 0 100 75 50 25 Cum u lativ e frequency (%) 0 25 20 5 15 10 Relativ e frequency (%) Relativ e frequency (%) 0 0.00 0.05 0.10 0.15 0.20 0 100 200 nm 300 400 0 0 5 10 15 100 ECS width (nm) 200 300 400 500 0.0 0.1Dinst/Dref Relative diffusivity (Dinst/Dref) 0.2 Ctrl 4MU 4MU+LB Ctrl 4MU 4MU+LB 4MU 4MU+LB 4MU 4MU+LB 4 3 2 1 Hy aluronan (ng/mg of protein) 0
Control 4MU Control 4MU
Fig. 6 Hyaluronan depletion increases ECS nanoscale diffusivity more profoundly than ECS width. a Experimental timeline. 4-methylumbelliferone (4MU) inhibits HA synthesis in vivo. 4MU-based diet started 4 weeks prior to LB-inoculation to deplete HA chronically before the onset of pathology.
b, c Quantification of HA staining in SN of mice (b) or HA content in mouse plasma (c) after 1 month of 4MU or normal diet (two-tailed Student’s t test,
n = 4 mice). d, e ECS relative diffusivity (d) and spatial (e) maps of the nigral ECS in control mice and mice with experimental matrix disruption (4MU) and
experimental+ pathological degradation of the HA matrix (4MU-LB). Scale bars, 2 µm. f Cumulative distributions of ECS relative diffusivities show
increased nanoscale diffusion in the SN of 4MU-treated mice and 4MU-mice after LB-induced neurodegeneration (Kolmogorov–Smirnov test of 4MU vs
4MU-LB,n = 4 mice). g Frequency distributions of nigral ECS Dinst/Drefobtained from 4MU and 4MU-LB-treated mice.h Cumulative distributions of ECS
dimensions show increased ECS width in the SN of 4MU-mice, an effect augmented in 4MU-treated mice injected with LBs (Kolmogorov–Smirnov test of
4MU vs 4MU-LB,n = 4 mice), suggesting that neurodegeneration impacts ECS width, while HA depletion influences mostly ECS diffusivity. i Frequency
distributions of ECS widths show an increased ECS enlargement in the degenerated (LB) and HA-depleted (4MU) SN, with most dimensions exceeding
both ipsi and contralateral sides 72hs post LB-injection
(Supple-mentary Fig. 10d). Chronic neuroinflammation, rather than acute,
may complicate even further the neuropathological outcome, and
hence it might explain the lack of neuroprotection in the 4MU
model. Taken together, these results indicate that experimental
chronic HA depletion increases ECS width and in particularly
diffusivity, in a similar fashion to pathological (LB-induced) HA
degradation. This confirms that ECS local parameters, and
espe-cially nanoscale diffusion, are inversely related to HA.
Discussion
Unravelling the ECS structure and function represents a
techno-logical challenge due to its nanometric dimensions, and despite
recent remarkable advances
2,3,17–19, its precise morphological and
diffusional parameters are still unknown in brain pathology. Here
we explored the ECS nanoscale organization in the SN of adult
mice after LB-induced neurodegeneration, a model of
synuclei-nopathy for PD. Using state-of-the-art technologies, we revealed a
highly heterogeneous ECS displaying localized areas of increased
diffusivity and enlarged dimensions in the degenerated SN. We
have also demonstrated a link between ECS nanoscale parameters,
ECM content and glia. These mice display a degraded hyaluronan
matrix in a context of reactive microglia, while experimental
matrix disruption modified the pathology and increased ECS
width and diffusion. Our results reveal a disorganization of the
brain extracellular microenvironment associated to hyaluronan
remodeling and microglial activation in the parkinsonian SN.
It has been long established that the ECS volume fraction in the
brain ranges between 15 and 20%
1,7, and ECS volume changes
have been reported in pathological states
1. However, estimating
its exact width has proven more difficult due to experimental
limitations
14. Here we provide nanoscale ECS dimensions in
adult parkinsonian SN analyzed by two different methods:
cryofixation-EM and single-nanotube tracking. Both techniques
rendered similar distributions of ECS widths (Figs.
1
i and
2
g),
with most values falling around the 100 nm mark and an
insig-nificant proportion of widths over 500 nm. These values are in
accordance to a recent report on cryofixed adult mouse cortex
17.
Using STED microscopy, Tønnesen et al. described slightly higher
ECS dimensions in organotypic brains slices
18, a preparation that
has been shown to display a looser, wider ECS than its adult
counterpart
19. Mapping ECS local width revealed a characteristic
channels-and-pools topology, analogous to the interconnected
network of sheets-and-tunnels reported by others using
3D-reconstruction models of the ECS
6,41. We observed a clear trend
for larger ECS volume fractions in the parkinsonian SN.
Unu-sually high ECS volume fractions have been reported in the SN of
other species
42, thus an alternative method such as real-time
iontophoresis with tetramethylammonium (RTI-TMA) should
validate these results. Nonetheless, volume fraction is a global
parameter that affects -and it is quantified- over an entire region.
Local width, on the contrary, provides ECS information at
nan-ometer resolution, a scale more in accordance with biological
processes
43. In this context, we detected increased local
dimen-sions in the parkinsonian ECS. This increase, found both in
cryofixed and live SN, is at odds with decreased HA levels,
con-sidering that this hygroscopic polymer has been proposed as a
determinant of ECS volume
29. We argue that the changes we
observe in ECS dimensions are probably due to the loss of cellular
tissue by neurodegeneration, but also the consequence of
dis-rupted cell attachments associated to matrix degradation. Further
characterization of cell-ECM interactions conducted at the
molecular level are needed to elucidate this phenomenon.
Diffusional parameters are equally augmented in the
parkin-sonian ECS, although they are not spatially correlated to local
changes in ECS width. Diffusion in the brain ECS has been
proposed to be affected by geometry and viscosity
3,44, the latter
being mostly determined by macromolecular obstacles. Whether
geometric tortuosity or diffusion barriers have differential weight
influencing molecular diffusion through the ECS, is still a matter
of debate
14. According to the restricted diffusion theory,
SWCNTs in LB-inoculated mice should display reduced
geo-metric hindrance due to increased ECS width. Nonetheless, we
present evidence here that regulation of nanoscale diffusivity
might not be exclusively imposed by variations of geometric
constraints. The comparison between 4MU vs 4MU-LB, with
similarly increased diffusion despite larger ECS widths in the
latter, suggests that hyaluronan-mediated hindrance plays a
major role determining ECS diffusivity. We and others have
reported augmented diffusion after ECM removal
2,45. Here we
focus on its most abundant component, HA, a viscous polymer
that scaffolds ECM assemblies. Either pathologically-induced
(LB) HA degradation as well as chemically-induced (4MU) HA
depletion rendered similar increase in nanoscale diffusivity. Thus,
we propose HA as a dynamic ECS organizer that determines
diffusivity locally. This concept has profound implications:
first,
spatial regulation of HA, either by removal or overproduction,
might establish or modify concentration gradients by locally
altering diffusion (i.e., channeling movement of molecules at a
nanoscale) either transiently or in a long-lasting manner. This
would have repercussions in the specificity of extrasynaptic
communication, which is based on local nanoscopic diffusion
through the ECS
1,24. Second, most mathematical models focused
on diffusion or bulk
flow address the ECS as an empty space. We
believe that future ECS models would benefit from including
diffusional barriers in addition to topology.
From the vast array of molecules forming the ECM, HA is
probably its most versatile component, given its structural and
signaling properties
46. We demonstrate extensive HA degradation
in the SN after neurodegeneration. This occurs without affecting
CSPGs, as reported in human neurodegeneration
31or HA loss
in vivo
29. We propose that pathological HA disruption impacts
not only diffusion, but also inflammation. Low-MW-HA is a
pro-inflammatory molecule
11, and HA breakdown in the SN might
trigger the release of additional damage-associated molecular
patterns (DAMPs), since matrix metalloproteinases (MMP)
activity is increased by fragmented HA
47. We did not
find
changes in mRNA levels of neither HA-synthases nor
hyalur-onidases, but detected increased HA phagocytosis by activated
microglia. The significant proportion of HA inclusions found in
control mice suggests that microglia might participate in
phy-siological HA turnover. Nonetheless, this balance seems altered in
the parkinsonian SN, suggesting the existence of a positive
feedback loop microglia-HA. HA internalization is mostly
dependent on CD44 receptor
35,48, and its expression is elevated in
LB-inoculated mice, similarly to microglial CD44 upregulation in
other brain disorders
35, In pathological states, HA can also be
degraded non-specifically by reactive oxygen species (ROS)
49, a
common feature of neurodegeneration, and we cannot exclude
this possibility in our model. The decrease in HA fractal
dimension, which we interpret as a loss of interconnectivity,
might be due not only to HA degradation but also to proteolysis
of HA cross-linkers
32such as tenascins.
Seed-based models such as the LB-inoculated mouse offer the
possibility to study the pathological process at an early stage
50.
While the detailed description of the ECS we provide here is
presented as the pathological ECS, our
findings have implications
to specific mechanisms of PD and other proteinopathies. The
obvious hypothesis is that increased ECS diffusion might have a
role in the spreading of toxic conformers of
α-syn or other
in vivo (i.e. Hyase) reduces
α-syn inoculum load. This could be
due to increased clearance of the inoculum through the ECS,
reducing its chance to be internalized by cells, although a
quan-titative model would better clarify this phenomenon. Degradation
of another ECM component (CSPGs) had no effect, ruling out
Hyase-mediated indirect ECM disruption as the mechanism. A
recent report in C. elegans showed that hyaluronidase TMEM2
ameliorates intracellular ER stress modulating pathology
51,
sug-gesting another mechanism for HA breakdown-mediated
neu-roprotection. In addition, our results suggest that HA
modification could play a role via modulation of inflammation.
HA fragmentation by Hyase, occurring at the moment of
LB-inoculation, is neuroprotective in our model, triggering a
sub-stantial microglial activation and reducing proteopathic-seeds
load. A plausible explanation is that overstimulation of microglia
by HA breakdown exerts a beneficial pro-inflammatory state that
impairs seeding. In fact, LMW-HA partially reproduced
Hyase-mediated effects in neuroinflammation and α-syn load, and
protected from dopaminergic cell loss. Despite we found no
evidence that activated microglia engulfs
α-syn, we detected
Iba1-positive cells surrounding human-α-syn-Iba1-positive neurons in the
murine SN, suggesting that these cells can sense either aggregated
α-syn
52,53or neuronal damage
39. It is possible that
toxic-α-syn-positive cells release injury-related factors such as ATP, which
attracts microglia
54. This would also explain microglia invading
the degenerated SNc. Aggregated
α-syn can activate microglia
55,
upregulate CD44 and enhance migration
56. In accordance, we
observed early inflammation triggered by LB inoculation alone,
but to a much lesser extent than in the HA-modified brain,
suggesting that HA fragmentation amplifies this phenomenon.
Either at the synaptic cleft, intracellular calcium microdomains,
or neurotransmitter receptors, there is an increasing need in
neu-roscience to refine probing of biological compartments
57. Studying
local changes at the nanoscale, as opposed to global parameters
spanning entire regions, is a paradigm shift in neurobiology that
finds its latest bastion in the ECS. This is the first study exploring
ECS, ECM and glia in an integrative approach within a pathological
context, and provides evidence of a dynamic interplay between
these players. Rephrasing a 50-years-old hypothesis by ECS research
pioneers Schmitt and Sampson
58, we propose the term
“brain
extracellular microenvironment” to encompass these factors under
one unifying concept to facilitate discussions. Finally, the possibility
to combine nanoscale ECS exploration with ECM, cellular and
subcellular labeling will open new avenues to further understand
brain physiology in health and disease.
Methods
Animals and surgical procedures. LB and noLB fractions were purified from
fresh frozen post-mortem samples of sporadic PD-patients obtained from brains collected as part of the Brain Donation Program of the Brain Bank GIE NeuroCEB, run by a consortium of Patients Associations: ARSEP (multiple sclerosis), CSC (cerebellar ataxias), France Alzheimer and France Parkinson. The consent docu-ments were signed by the patients themselves or their next of kin in their name, in accordance with the French Bioethical Laws. The Brain Bank GIE NeuroCEB (Bioresource Research Impact Factor number BB-0033-00011) has been declared at the Ministry of Higher Education and Research and has received approval to distribute samples (agreement AC-2013-1887). Human SNpc was dissected and homogenized before a sucrose step gradient20and sonicated for 5 min prior to
in vivo inoculation to disruptα-synuclein aggregates into oligomeric and fibrillary fragments. Male 10-weeks-old C57BL/6J mice (Charles River) were unilaterally injected into the substantia nigra with 2 µl of either Lewy-body (LB) fractions, containing toxicfibrillary α-synuclein, or noLB fractions, with soluble non-aggregatedα-synuclein. Intranigral inoculations were achieved by stereotactic surgery (coordinates from bregma:−2.9 mm anteroposterior, 1.3 lateral, and −4.5 dorsoventral) under deep isoflurane anesthesia at a flow rate of 0.4 µl/min with a 30-gauge Hamilton syringe coupled to a microinjection pump (World Precision Instruments). The needle was left in place for 10 min to avoid leakage. Some animals were co-injected with 2 µl of LB fractions and either 1 µl (3U) of hyalur-onidase (Hyase) from Streptomyces hyalurolyticus (Sigma-Aldrich), 0.025U of chondroitinase ABC (Sigma-Aldrich), low-molecular weight (200 mg/ml) or
high-molecular weight hyaluronan (15 mg/ml, Sigma-Aldrich) or sterile PBS. The Institutional Animal Care and Use Committee of Bordeaux (CE50) approved experiments under license #5520-2016052514328805.
4-MU treatment. 6-week-old C57BL/6J mice (Charles River) were fed with normal mouse chow or mixed with 5% (w/w) 4-methylumbelliferone (4MU, Sigma-Aldrich), a concentration reported to effectively inhibit hyaluronan production in vivo systemically59and in CNS60. The mixture was prepared fresh daily,
including water and 33% of cacao to enhance the palatability of the drug. Animals were fed with 4-MU for 4 weeks prior to LB inoculation, and kept on this diet until
euthanasia (4 months). Animals were weighted daily during thefirst month, and
weekly afterwards. Despite initial weight loss in the 4MU-treated animals, mice recovered after 2 weeks. Animals showed no sign of stress or particular phenotype, other than weakness of the skin during surgery suture. The Institutional Animal Care and Use Committee of Bordeaux (CE50) approved experiments under license #10721-2017071213284522.
High-pressure cryofixation and electron microscopy. Bilaterally LB-inoculated
mice were euthanized by cervical dislocation and brains quickly removed and sliced (180 µm thickness) in a VT1200S vibratome (Leica Microsystems) in ice-cold aCSF (see below“acute brain slice preparation” for details). Tissue discs (5 mm diameter) of substantia nigra (SN) were immediately transferred to a 200 µm-thick aluminum
sample holder (6 mm diameter). Medium was cleared with afilter paper and the
cavityfilled with 1-hexadecene. The sample was sandwiched with a flat aluminum
top plate and high-pressure frozen in a HPM100 device (Leica Microsystems). No more than 10 min elapsed from euthanasia to cryofixation. Samples were kept in liquid nitrogen until further processing. Since the pathology develops in each hemisphere independently, SNs were treated separately as individual samples. Freeze-substitution resin embedding was carried out in an AFS2 unit (Leica Microsystems). Frozen samples were incubated for 40 h using 0.1% tannic acid in
anhydrous acetone at−90 °C, followed by 12 h of 2% OsO4in anhydrous acetone
at−90 °C. The temperature was then raised to −30 °C with periodic temperature
transition gradients of 1 °C/h and to−10 °C by 3 °C/h. Samples were then immersed in Epon resin/anhydrous acetone over 9 h (1/3, 1/1 and 3/1, 3 h each) whilst temperature increased to 20 °C. Finally, samples were added to 100% Epon resin at room temperature for 2 h prior to polymerization at 60 °C for 48 h.
Artifact-free tissue was selected in semi-thin (0.5 mm thick) sections stained with toluidine blue. Ultra-thin sections of selected regions were post-stained with uranyl acetate (1%) and lead citrate and imaged in a transmission electron microscope (H7650, Hitachi) equipped with a SC1000 Orius camera (Gatan).
Estimation of ECS dimensions from cryofixation-EM images. ECS was manually
segmented from cryofixed-EM images where membranes were easily discernible
(Supplementary Fig. 2), using an interactive pen tablet (Wacom) and the TrakEM2 plugin in Fiji/ImageJ (NIH)61. Segmented images were binarized, resulting in
individual ECS compartments (Fig.1d). The ECS volume fraction was estimated by dividing the area of ECS compartments by the total area of the image.
To estimate the length of ECS compartments, binary images were skeletonized and the longest shortest path was calculated in ImageJ62. ECS local widths were
calculated by measuring iteratively the diameter of the largest circlefitting each portion of the ECS compartment, using a 2D implementation of the Local Thickness plugin (ImageJ). The distribution of pixel values obtained from the histograms of ECS local thickness maps was converted to dimensional values using the image pixel size (1.42 nm).
SWCNTs injection and acute brain slice preparation. 1 mg of HiPco-synthesized carbon nanotubes (from Rice University) was suspended with 50 mg of mono-functional phospholipid-polyethylene glycol (#mPEG-DSPE-5000, Laysan Bio) in 10 ml of deuterium oxide (Sigma Aldrich). After homogenization for 15 min at 19,000 rpm with a dispersing instrument (IKA T-10 Basic), SWCNTs were further dispersed via tip sonication (20 W for 8 min) and then centrifuged at 800 × g for 60 min to remove nanotube bundles and impurities.
Four months after LB or noLB inoculation, animals underwent a similar stereotactic surgery where 6 µl of SWCNT solution was injected into the cerebral lateral ventricle (coordinates from bregma:−0.5 mm anteroposterior, 1 mm mediolateral,−2.4 dorsoventral). The needle was left in place for 10 min to avoid leakage. Animals received buprenorphine (0.1 mg/kg) as analgesic and returned to their cages. 1 h after SWCNT injection, mice were euthanized by cervical dislocation. Brains were extracted and coronal sections (300 µm thick) were prepared in a Leica VT1200S vibratome. Slicing was performed in ice-cold low-Na+low-Ca2+high-Mg2 +artificial cerebrospinal fluid (aCSF) solution containing 180 mM sucrose, 2.5 mM
KCl, 1.2 mM NaH2PO4, 13 mM glucose, 20 mM HEPES, 10 mM MgSO4and 0.5 mM
CaCl2. Slices were then transferred to oxygenated aCSF (gassed with 95% O2, 5%
CO2, pH= 7.4) containing 124 mM NaCl, 2.5 mM KCl, 1.2 mM NaH2PO4, 24 mM
NaHCO3, 13 mM glucose, 3 mM sodium pyruvate, 2 mM MgSO4and 2 mM CaCl2