HAL Id: inserm-00903755
https://www.hal.inserm.fr/inserm-00903755
Submitted on 13 Nov 2013HAL is a multi-disciplinary open access archive for the deposit and dissemination of sci-entific research documents, whether they are pub-lished or not. The documents may come from teaching and research institutions in France or abroad, or from public or private research centers.
L’archive ouverte pluridisciplinaire HAL, est destinée au dépôt et à la diffusion de documents scientifiques de niveau recherche, publiés ou non, émanant des établissements d’enseignement et de recherche français ou étrangers, des laboratoires publics ou privés.
Small molecule activators of the Nrf2-HO-1 antioxidant
axis modulate heme metabolism and inflammation in
BV2 microglia cells.
Roberta Foresti, Sandip Bains, Tamil Selvi Pitchumony, Lisandra de Castro
Brás, Filippo Drago, Jean-Luc Dubois-Randé, Claudio Bucolo, Roberto
Motterlini
To cite this version:
Roberta Foresti, Sandip Bains, Tamil Selvi Pitchumony, Lisandra de Castro Brás, Filippo Drago, et al.. Small molecule activators of the Nrf2-HO-1 antioxidant axis modulate heme metabolism and inflammation in BV2 microglia cells.. Pharmacological Research, Elsevier, 2013, 76, pp.132-48. �10.1016/j.phrs.2013.07.010�. �inserm-00903755�
1
Small molecules activators of the Nrf2-HO-1 antioxidant axis
modulate heme metabolism and inflammation in BV2 microglia cells
Roberta Forestia,b,*, Sandip K. Bainsc, Tamil Selvi Pitchumonyc, Lisandra E. de Castro Brásc,§ , Filippo Dragod, Jean-Luc Dubois-Randéa,e,
Claudio Bucolod and Roberto Motterlinia,b,*
a
Université Paris-Est, UMR_S955, UPEC, F-94000, Créteil, France b
Inserm U955, Equipe 3, F-94000, Créteil, France c
Department of Drug Discovery and Development, Italian Institute of Technology, 16163 Genova, Italy
d
Department of Clinical and Molecular Biomedicine, Section of Pharmacology and Biochemistry, University of Catania, 95125 Catania, Italy
e
AP-HP, Hôpital Henri Mondor, Service de Cardiologie 1, F-94010 Créteil, France
* To whom correspondence may be addressed: Roberta Foresti or Roberto Motterlini, Inserm U955, Equipe 3, F-94000, Créteil, France, Tel : +33 1 49 81 36 37, Email:
roberta.foresti@inserm.fr or roberto.motterlini@inserm.fr; §Current address: Jackson Center for Heart Research at UMMC, Jackson, Mississippi, USA
List of non-standard abbreviations: ALAS 1, delta-aminolevulinate synthase 1; ARE, antioxidant responsive element; BVR, biliverdin reductase; tBH, tert-Butyl hydroquinone; CA, carnosol; CAA, carnosic acid; CoPP, Cobalt Protoporphyrin IX; CO-RMs, carbon monoxide-releasing molecules; DHC, 2,2-Dihydroxychalcone; DMF, dimethyl fumarate; H, hemin; HO-1, heme oxygenase-1; Keap-1, Kelch-like ECH-associated protein-1; INF- , interferon- ; ISL, isoliquiritigenin; LPS, lipopolysaccharide; Nrf2, HF-E2 p45-related factor 2; PGE2, prostglandin E2; S, sulforaphane; SC, supercurcumin; shRNA, small hairpin RNA; SnPPIX, tin protoporphyrin IX; TNF-α, tumor necrosis factor alpha.
*Manuscript
2 Abstract
The nuclear factor erythroid derived 2-related factor 2 (Nrf2) and the antioxidant protein heme
oxygenase-1 (HO-1) are crucial components of the cellular stress response. These two systems
work together to combat oxidative stress and inflammation and are attractive drug targets for
counteracting different pathologies, including neuroinflammation. We aimed to identify the most
effective Nrf2/HO-1 activators that modulate the inflammatory response in microglia cells. In the
present study, we searched the literature and selected 56 compounds reported to activate Nrf2 or
HO-1 and analysed them for HO-1 induction at 6 and 24 h and cytotoxicity in BV2 microglial
cells in vitro. Approximately 20 compounds up-regulated HO-1 at the concentrations tested (5 to
20 µM) with carnosol, supercurcumin, cobalt protoporphyrin-IX and dimethyl fumarate
exhibiting the best induction/low cytotoxicity profile. Up-regulation of HO-1 by some
compounds resulted in increased cellular bilirubin levels but did not augment the expression of
proteins involved in heme synthesis (ALAS 1) or biliverdin reductase. Bilirubin production by
HO-1 inducers correlated with their potency in inhibiting nitrite production after challenge with
interferon- (INF- ) or lipopolysaccharide (LPS). The compounds down-regulated the inflammatory response (TNF-α, PGE2 and nitrite) more strongly in cells challenged with INF- than LPS, and silencing HO-1 or Nrf2 with shRNA differentially affected the levels of
inflammatory markers. These findings indicate that some small activators of Nrf2/HO-1 are
effective modulators of microglia inflammation and highlight the chemical scaffolds that can
serve for the synthesis of potent new derivatives to counteract neuroinflammation and
3
Keywords: BV2 microglia; Nrf2; HO-1; small molecule activators; heme metabolism;
inflammation.
1. Introduction
Inflammation in the brain is considered to be a significant cause underlying the development
of neurodegenerative disorders [1]. Microglia, the resident macrophages of the brain, reacts to
systemic and local inflammation as well as other stressful stimuli by activating a stress response.
This response involves additional production of inflammatory molecules, reactive oxygen species
and other mediators that may lead to detrimental effects. However, microglia activation is also
important for stimulation of repair mechanisms and protection of neurons, indicating the dual role
covered by microglial cells and emphasizing the delicate balance existing between pro- and
anti-inflammatory responses in the context of brain pathophysiology.
In common with other cell types, microglia expresses the Nrf2 and heme oxygenase-1
(HO-1) systems, which are essential for counteracting oxidative stress and inflammation [2,3].
Nrf2-deficient mice are more susceptible to oxidative stress [4] and inflammatory disorders including
systemic inflammation [5], localized inflammation [6] and neuroinflammation [7]. Nrf2 works
stream of HO-1, being a transcription factor sensitive to redox changes that lead to
up-regulation of several cytoprotective and detoxifying enzymes. Under normal conditions, Nrf2 is retained in the cytoplasm in a ‘silent’ form by its repressor protein, Keap-1, which contains a subset of 27 highly reactive cysteine residues. Oxidative and environmental stimuli modify the
cysteine residues of Keap-1, thus enabling translocation of Nrf2 to the nucleus where it binds to
the antioxidant responsive element (ARE) located in the promoter region of detoxifying genes,
4
the expression of HO-1 can also be modulated by others transcriptional regulators depending on
the stimulus. In addition, HO-1 per se exerts a catalytic function by degrading heme to generate
carbon monoxide (CO), iron and bilirubin as final by-products. These products account for many
of the beneficial properties of HO-1 [9,10], suggesting that pharmacological manipulation of the
Nrf2/HO-1 axis could have important implications for limiting neuroinflammation. This notion is
also supported by data obtained with CO-releasing molecules (CO-RMs), specific carriers of CO
in biological systems that reduce the production of inflammatory markers in macrophages and
microglia cells in culture [11,12] and can decrease brain damage and inflammation in a rat model
of hemorrhagic stroke [13].
Our interest in Nrf2/HO-1 activators was initially motivated by results showing that
curcumin, a natural polyphenolic compound, increased HO-1 levels in endothelial cells and
elicited protection against H2O2-mediated oxidative damage in a HO-1-dependent manner [14]. We subsequently reported that HO-1 induction by curcumin was modulated by Nrf2 [15] and we
studied other naturally-derived substances, such as chalcones and caffeic acid phenethyl esther,
as promising inducers of the HO-1 pathway [16]. We also showed that the Michael acceptor
functionality common to the chemical structure of many of these inducers is pivotal for
promoting HO-1 up-regulation [17]. Because of their reliable response to inflammatory
challenges, microglial cells in culture represent a good model to assess (brain) cellular
adaptations following exposure to Nrf2/HO-1 activators.
In this study we performed an extensive literature search and selected 56 different
compounds that were compared and evaluated for their ability to induce HO-1 and modulate
inflammation in BV2 microglial cells. Using shRNA technology, we assessed the contribution of
5
metabolism, showing that some compounds stimulate bilirubin production while others do not,
despite their shared ability to up-regulate HO-1 expression. Our findings provide new insights on
the chemical features and biochemical properties of small activators of Nrf2/HO-1 that are
relevant for the control of inflammatory processes in microglia cells.
2. Materials and Methods
2.1. Chemicals and reagents
Supercurcumin (containing 95% curcuminoids and piperine) was purchased from Life Extension, sildenafil from Sinova Inc (Bethesda, USA), β,β’-dihydroxychalcone from Indofine Chemical Company Inc (Hillsborough, USA), hemin and tin protoporphyrin IX (SnPPIX) from
Frontier Scientific (Logan, USA) and mouse interferon- (INF- ) from ThermoFisher Scientific (Illkirch Cedex, France). All other chemicals and reagents were from Sigma unless otherwise
stated.
2.2. Cell culture
BV2 mouse microglial cells were kindly donated by Professor Rosario Donato (University of
Perugia) and Dr Adjanie Patabendige (Institute of Infection & Global Health, Liverpool). Cells
were cultured in either 75 cm2 flasks, 6-well or 24-well dishes containing RPMI medium supplemented with 10% FBS, 4mM glutamine, 100 U/ml penicillin, 10 µg/ml streptomycin and
grown in a 5% CO2 atmosphere at 37°C.
6
A literature search for compounds that induce HO-1 or Nrf2 was carried out using PubMed. The
keywords used for the search were: a) HO-1 inducers and, b) Nrf2 inducers. The CAS databases
were also searched using SciFinder to identify the chemical structure of various HO-1
inducers/Nrf2 activators reported in the literature. The SciFinder search used the same keywords
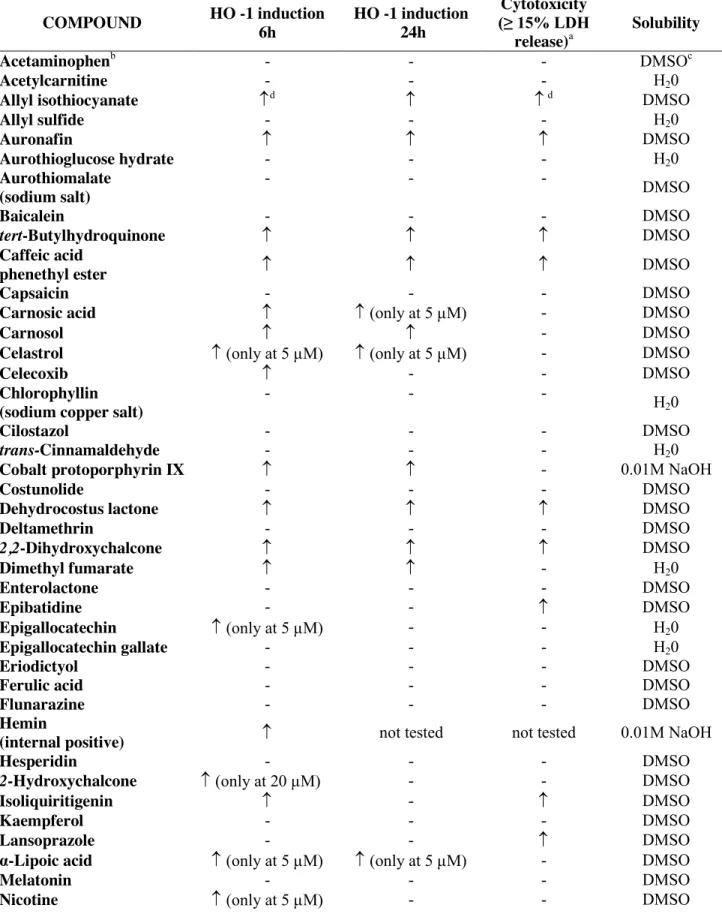
as the PubMed search. From an original list of over 100 compounds identified in our preliminary
search we created a compound library of 56 chemicals to be tested (Table 1); as some of the
compounds were natural extracts or synthesized by the authors, the criteria for this selection were
based on commercial availability of the substances and whether their chemical structure allowed
for feasible structural modification.
2.4. Immunoassay for HO-1 protein expression
A medium-throughput screening assay was utilized to determine the effect of the 56 compounds
on HO-1 protein expression in BV2 cells. Confluent cells grown in 6-well dishes were treated for
6 or 24 h with increasing concentrations (5, 10 or 20 µM) of each compound using also an
internal positive control (10 µM hemin) for HO-1 protein expression in each experiment. DMSO,
the solvent of most of the compounds assessed (see Table 1 for solubility information), was used
in control cells. At the end of the incubation, cells were scraped and collected in PBS at 4 °C.
Samples were analyzed for HO-1 protein levels according to the protocol for the mouse ELISA
(HO-1 (mouse) Immunoset, Vinci-Biochem).
2.5. Cytotoxicity
All 56 compounds were tested to evaluate their possible cytotoxic effects. BV2 cells were grown
7
were also treated with a 1% Triton solution prepared in medium as a positive control (100%
cytotoxicity). Cell viability was determined using a lactate dehydrogenase (LDH) release assay
(Cytotoxicity detection kit (LDH), Roche) according to manufacturers’ instructions. Briefly, at the end of the incubation supernatants were collected and centrifuged at 250 x g to remove any
residual cell debris. The reaction mixture was added to the cell-free supernatant, and colour
development was measured spectrophotometrically at 500 nm.
2.6. Heme oxygenase activity assay
Cells cultured in 100 mm diameter petri dishes were collected 6 h after incubation with selected
inducers (20 µM) and assessed for heme oxygenase activity. The assay is based on the
spectrophotometric determination of bilirubin as the final product of heme degradation by heme
oxygenase [18]. Cell samples were incubated with the substrate hemin, NADPH, liver cytosol (a
source of biliverdin reductase) and other co-factors to sustain heme oxygenase activity. The
reaction was allowed to proceed for 1 h at 37 °C in the dark and was terminated by addition of
chloroform to extract the bilirubin produced. Bilirubin was measured spectrophotometrically as
described before and calculated in picomoles bilirubin/mg protein/60 min [19].
2.7. Determination of bilirubin released in the culture medium
Confluent cells cultured in 60 mm diameter petri dishes were used for this assay. Cells were
incubated with HO-1 inducers/Nrf2 activators for 6 or 24 h in the presence or absence of 10 µM
hemin in a final volume of 1 ml. At the end of the incubation, 0.5 ml of culture supernatant was
added to 250 mg of BaCl2 and vortex-mixed thoroughly. Benzene was added to the mixture and tubes were vigorously vortex-mixed again. The benzene phase containing the extracted bilirubin
8
was separated from the aqueous phase by centrifugation and bilirubin was measured
spectrophotometrically [19,20]. Bilirubin was calculated in picomoles/ml of medium.
2.8. Real-time PCR assay
Confluent BV2 cells cultured in 6-well dishes were exposed for 4 h to certain compounds at 10
µM concentration. This time point was chosen based on preliminary experiments showing that
maximal mRNA levels were achieved 4 h after incubation of cells with 10 µM carnosol (data not
shown). Total RNA was extracted from BV2 cells using the Qiagen RNeasy Mini Kit (Qiagen)
and then reverse-transcribed using the Superscript First-Strand Synthesis System (Invitrogen) and
Oligo(dT)20. Quantitative RT-PCR reactions were performed in triplicate on a 7900 real-time
PCR detection system (Applied Biosystems) using Platinium SYBR Green qPCR SuperMix
(Invitrogen). The following mouse primers were used in the reaction: HMOX1 forward primer: 5’-CCTCACTGGCAGGAAATCATC-γ’, HMOX1 reverse primer: 5’- CTCGTGGAGACGCTTTACATA-γ’, GAPDH forward primer: AAGAGAGGCCCTATCCCAAC, GAPDH reverse primer: GCAGCGAACTTTATTGATGG.
PCR conditions were 50°C for 2 min, 95°C for 2 min, 45 cycles at 95°C for 15 s, and 60°C for 45
s, using GAPDH as the reference gene.
2.9. Measurement of cellular heme content
Heme content was determined in cells treated with HO-1 inducers in the presence or absence of
succinylacetone (1 mM), an inhibitor of heme biosynthesis and in medium containing 10 or 1%
FBS. At the end of the incubation cells were washed twice with warm PBS, followed by addition
9
concentration in the formic acid solution was measured spectrophotometrically at 398 nm (ϵ = 1.56 × 10⁵ M/cm). Heme uptake was expressed as picomole per well.
2.10. Western blot analysis
Expression of biliverdin reductase (BVR), delta-aminolevulinate synthase 1 (ALAS 1), HO-1 and
Nrf2 were determined by western blot at different times after incubation with selected substances. In brief, an equal amount of proteins (β0 μg) for each sample was separated by SDS-polyacrylamide gel electrophoresis and transferred to nitrocellulose membranes; the nonspecific
binding of antibodies then was blocked with 5% nonfat dried milk and 0.1% Tween in TBS.
Membranes were then probed overnight with a rabbit polyclonal antibodies against HO-1 or
biliverdin reductase (Stressgen, 1:1000 dilution), Nrf2 (Santa Cruz Biotechnology, Inc., 1:1000
dilution) and ALAS 1 (ABCAM, 1:1000 dilution). After incubation with
horseradish-peroxidase-conjugated secondary antibody (Cell Signaling Technology, 1:5000 dilution), bands were
visualized using Pierce ECL revelation kit.
2.11. Silencing of HO-1 or Nrf2 using shRNA
Small hairpin RNA specific for mouse HO-1 or Nrf2 and a negative control (sc-108080) obtained
from Santa Cruz (Santa Cruz Biotechnology) were used to infect BV2 cells. Lentiviral particles
were added to the cell culture in a 6-well dish and cells were incubated overnight. The following
day the medium was replaced with medium containing puromycin for selection of stably transfected colonies following manufactures’ instructions.
10
BV2 cells grown in 24-well dishes were treated for 24 h with lipopolysaccharide (LPS, 0.5
µg/ml) or INF-J (15 ng/ml) in the presence or absence of test compounds (5, 10 or 20 µM). In some experiments the heme oxygenase activity inhibitor SnPPIX (10µM) or bilirubin (0.5 to 10
µM) were included. Cells in which HO-1 or Nrf2 were silenced by shRNA were also used. At the
end of the incubation the supernatant was collected for measurements of nitrite levels using the
Griess method [11] while TNFα and PGEβ levels were assessed by ELISA following manufacturers’ instructions (Enzo Life Sciences, Villeurbanne, France).
2.13. Data analysis
Statistical analysis was performed using Graph Pad Prism. One-way ANOVA combined with the Bonferroni or Tukey’s multiple comparison tests and the T-test were applied. Differences were considered to be significant at P<0.05. The EC50 was calculated for positive compounds used at
5, 10 and 20 µM, thus representing an approximate rather than a definite value since a full dose
response curve to each of the compound used was not performed in the present study.
3. Results
3.1. Screening of 56 small molecules activators for HO-1 expression and cytotoxicity
The initial literature search identified more than 100 compounds, including in some cases
derivatives, which induce or activate HO-1 and/or Nrf2. These compounds had been studied by
various authors using different cell types, different cell culture conditions and different
experimental protocols. Thus, one aim of our study was to evaluate and standardize the effect of
these small molecules within the same cellular system and under the same experimental
11
commercially available (e.g., oleanolic acid derivatives, carnosol, epigallocatechin, lansoprazole,
flunarizine), while many others, such as isoegomaketone, sauchinone, or sulfuretin, were
extracted from natural sources. From this initial list, 56 priority compounds were chosen to be
tested for HO-1 expression after 6 and 24 h incubation at three different concentrations (5, 10 and
20 µM) in microglia cells. Their effect on cell viability was also assessed. We did not test
concentrations higher than 20 µM since we observed in previous experiments that some HO-1
inducers start to exhibit significant cytotoxicity around 25-30 µM [14]. In addition, the usefulness
of compounds which can increase HO-1 at concentrations higher than 20 µM might be limited
when there exists already molecules that are effective in the lower micromolar range. This is
especially true if these compounds exhibit other beneficial properties, such as anti-inflammatory
action, that are manifested at low micromolar doses. We note that the bioavailability of some
naturally-derived compounds is limited and therefore we are unable to determine if the
concentrations used in our study will be achieved in the brain after oral intake. Table 1
summarizes the results of the screening, reporting the name of the compounds, their capacity to
induce HO-1 at 6 and 24 h, their solubility as well as their cytotoxic profile. From these initial
experiments it is evident that many of the compounds (35) did not increase HO-1 in BV2 at the
concentrations tested. These included, among others, acethaminophen, capsaicin, eriodictyol,
probucol and sildenafil, which have been shown to augment HO-1 in other cell types [21-25]. We
also observed that 10 compounds caused, in parallel with HO-1 induction, a release of LDH ≥15%, underlying some intrinsic cytotoxic properties. We set 15% LDH release as a reasonable limit for cell toxicity since the HO-1-inducing capacity of compounds should be balanced against
their negative effects on cells. It is important to note that 7 out of the 10 more cytotoxic
12
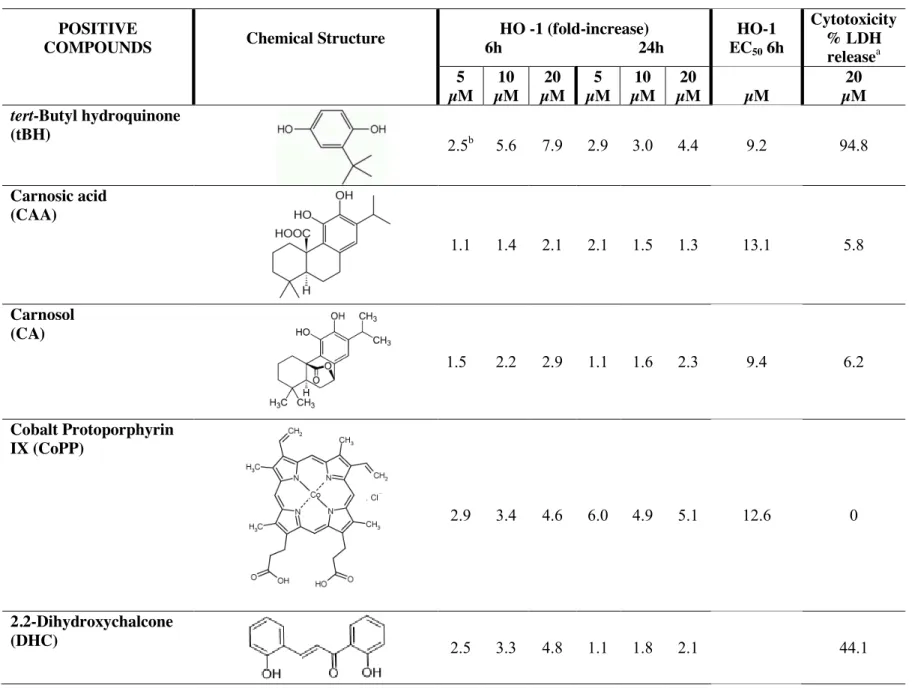
prolonged to counteract cell damage. In contrast, compounds such as carnosol (CA), dimethyl
fumarate (DMF), supercurcumin (SC) and cobalt protoporphyrin IX (CoPP) stimulated HO-1 at 6
and 24 h with minor effects on cell viability (see also Table 2). Altogether, the data from this
initial screening indicate that out of 56 compounds, the natural derivatives carnosic acid (CAA),
CA, DMF and SC together with the porphyrin CoPP exhibit the best HO-1 inducing/cytotoxicity
profile in BV2 cells. We selected from the first set of results 10 positive leads (including hemin
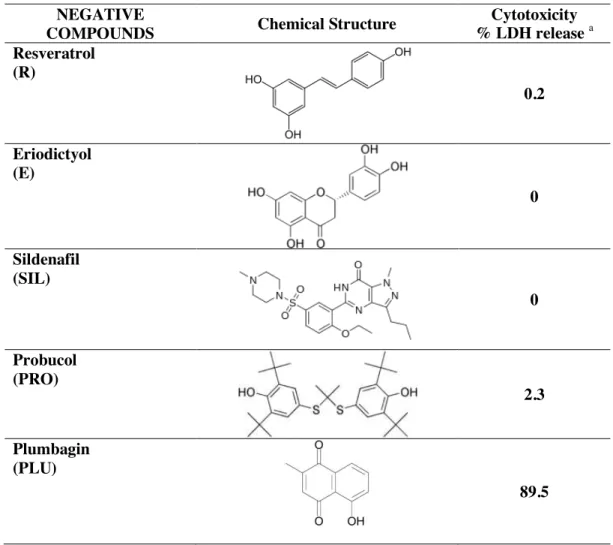
as our internal positive, see Table 2) and 5 negatives. Apart from their inability to promote HO-1
induction, the negatives eriodictyol (E), probucol (PRO), resveratrol (R) and sildenafil (SI) did
not affect cell viability (Table 3). The only exception was plumbagin (PLU), which was highly
toxic even at 5 µM. Quantitative real time PCR confirmed induction of the HMOX1 gene for H,
DMF, CA, SC (Fig. 2C) after 4 h exposure. The negatives PRO and RES also slightly increased
HMOX1 gene although this effect did not translate into a significant increase in HO-1 protein
expression (measured at 6 h after exposure). Indeed, no significant correlation was found between
increases in mRNA and protein levels after incubation with 10 µM H, DMF, CA, SC, PRO and
RES (r2 =0.16, P value= 0.32), suggesting that augmented HO-1 expression by these compounds is not driven exclusively by an increase in mRNA.
3.2. Endogenous production of bilirubin by lead compounds
Since many of the protective actions mediated by HO-1 are dependent on its final degradation
products bilirubin and CO (and ferritin as a scavenging protein for iron), we wondered whether
increased HO-1 expression by positive compounds was associated with a rise in HO-1-derived
products. We measured bilirubin, which accumulates in the cell supernatant and can be detected
13
1A shows that of the 10 positives tested at 20 µM, CoPP, CA, SC, CAA and
tert-butylhydroquinone (tBH) stimulated an increase in cellular bilirubin production at 6 h and/or 24
h. The internal positive control hemin, the putative inducer and substrate of heme oxygenase
activity, was used at 10 µM concentration and promoted the expected accumulation of bilirubin
[20] in the cell culture media. These results differentiate HO-1 inducers between those capable of
stimulating consumption of heme by heme oxygenase and those which do not, despite their
shared ability to induce high HO-1 expression. To ensure that a functional heme oxygenase was
expressed following activation by the compounds, we repeated the same experiments by
incubating cells with the selected substances in the presence of 10 µM hemin. Thus, when hemin
was provided exogenously as the substrate for heme oxygenase activity, bilirubin increased both
at 6 (Fig. 1B) and 24 h (Fig. 1C) with all substances examined. In the case of CoPP, CAA,
2,2-dihydroxychalcone (DHC) and tBH this increase was significantly higher than with either hemin
or the substance alone, suggesting an additive or synergistic action.
3.3. What is the source of heme utilized by heme oxygenase following induction by certain inducers?
The data reported above describe that certain inducers concomitantly stimulated HO-1 expression
and bilirubin production in BV2 while others elicited only HO-1 induction. To better understand
this phenomenon we concentrated on SC and CA and first examined if inhibition of heme
biosynthesis by succinylacetone affected their capacity to increase bilirubin. For these
experiments succinylacetone was pre-incubated for 16 h and maintained in the culture medium
also during the entire exposure of cells to HO-1 inducers. In addition, we cultured cells in
14
detectable amounts of hemoglobin and could thus be an external source of heme for use by cells.
We used 10 µM hemin as positive control. Fig. 2A shows that bilirubin was produced in equal
amounts when cells were exposed to hemin in the presence or absence of succinylacetone. This
was expected, as hemin should enter the cell, up-regulate HO-1 and be degraded by the enzyme
regardless and independently of heme synthesis inhibition. This effect was evident in medium
containing either 10% or 1% FBS but with an important difference: the amount of bilirubin
produced by cells incubated in 1% FBS medium was much higher compared with that measured
in cells cultured in 10% FBS-containing medium. Concerning SC and CA, the results of the
experiments carried out in 10% FBS do not clearly support that heme resulting from de novo
synthesis was used as a substrate for production of bilirubin by SC or CA, although
succinylacetone showed a non-significant tendency to decrease bilirubin levels with SC (Fig. 2A,
left panel). On the contrary, our data point to FBS as the major source of heme for the production
of bilirubin, since this increase was completely absent in BV2 cells incubated with SC or CA in
1% FBS (Fig. 2A, right panel). The measurement of cellular heme content indicated that
treatment of cells with hemin, but not with SC or CA, increased heme levels and that this effect
was much more pronounced in cells cultured in 1% FBS than 10% FBS (Fig. 2B).
Succinylacetone caused a slight, non significant decrease in heme content (Fig. 2B) at 1 mM; we
decided against the use of this compound at higher concentrations to avoid possible cytotoxicity
[26].
3.4. Effect of small activators on expression of heme synthesis and degradation proteins (ALAS 1 and BVR)
15
The pathways involving heme metabolism encompass multiple cytosolic and mitochondrial
enzymes that regulate various passages of heme synthesis and degradation. The fact that some
HO-1 inducers stimulate bilirubin production, while others do not, was intriguing and prompted
us to explore whether pathways working alongside HO-1 in the heme metabolic reactions were
also affected by the inducers. To confirm the results obtained with succinylacetone, we verified
the expression levels of ALAS 1, the rate-limiting enzyme in heme biosynthesis [27] following 6
h incubation with selected substances. As shown in Fig. 3A, the expression of ALAS 1 tended to
decrease in BV2 cells exposed to the positives SC, CA and DMF and the 2 negatives PRO and R
but this difference was not statistically different (P value= 0.1352). In addition, we aimed to
determine whether inducers changed the levels of BVR in parallel to HO-1. BVR is an inducible
protein that reduces biliverdin to bilirubin but also exhibits cytoprotective and anti-inflammatory
properties independently of HO-1 [28]. However, BVR expression levels remained virtually
unchanged after 6 h exposure to SC, CA, DMF, PRO and R (Fig 3 B). We also tested if
N-acetylcysteine (NAC, 1 mM), an antioxidant and a precursor of glutathione synthesis, influenced
HO-1 induction by the inducers. Fig 3C shows that pre-incubation of BV2 with NAC diminished
the increased heme oxygenase activity elicited by all the inducers evaluated (including hemin),
suggesting a contribution of thiol/redox reactions in the mechanisms underlying HO-1 induction
by Nrf2/HO-1 small molecule activators.
3.5. Small molecules differentially modulate inflammatory markers in BV2 cells challenged with LPS or INF-γ
The ability of the selected compounds to modulate LPS or INF -induced inflammation in BV2 cells was assessed. We were keen to distinguish the response to LPS, which directly activates
16
TLR4 receptors and stimulates acute inflammation, from that of INF- , a cytokine derived from
peripheral immune cells that may better mimic a low level of chronic inflammation. Nitrite, an
index of nitric oxide production, was measured in the cell supernatant 24 h after co-incubation of
small activators with INF- or LPS. This protocol differs from our previously published works [29], in which we pre-incubated inflammatory cells with HO-1 inducers at least 6 h prior to LPS
challenge, thus ensuring high expression of HO-1 before the application of the inflammatory
stimulus. Fig. 4 shows that most positives used at 20 µM concentration decrease nitrite in cells
challenged with INF- ; tBH, CA, CoPP, ISL, SC and S were all effective at the highest concentration while CA, CoPP and S elicited marked decreases also at 5 and 10 µM. Inhibiting
heme oxygenase activity with SnPPIX partially reversed the reduction in nitrite caused by tBH,
CA, DMF, S and SC (Supplementary Fig. S1). We also measured INF- -induced nitrite levels in
the presence of the negative compounds since they may exert anti-inflammatory properties
independent of HO-1. In these experiments we observed that E and PLU markedly diminished
nitrite production, although this effect was probably due to high cytotoxicity in the case of PLU
(Fig. 5). When inflammation was triggered by LPS we observed a very good
concentration-dependent inhibition of nitrite production by all positives (Fig. 6), with CA, CoPP, S and SC
being the most potent. However, SnPPIX did not seem very effective in reversing this effect with
all the compounds tested (Supplementary Fig. S2). As observed with INF- , some negatives, such as E, R and PLU could also decrease nitrite production stimulated by LPS (Fig. 7). We found that
the combination of sulphoraphane with LPS or INF- caused increased microglia toxicity in vitro (data not shown). These results confirm that HO-1 inducers can attenuate inflammatory responses
in microglia cells and suggest that the contribution of the HO-1 pathway to this effect is stronger
17
negatives still exert anti-inflammatory action which likely involves modulation of
HO-1-independent mechanisms.
3.6. Correlation between bilirubin production induced by small activators and nitrite levels
As already described, HO-1-derived products mediate many of the defensive properties of heme
oxygenase. Therefore, we correlated the levels of bilirubin produced by positives versus the
amount of nitrite measured after exposure of cells to INF- or LPS in the presence of the compounds. We excluded compound S from this analysis since the LDH release in cells exposed
to 20 µM of the compound alone was 15.8% but markedly increased to >70% when exposed
simultaneously with INF- or LPS (data not shown). Thus, the decrease in nitrite in the presence of compound S is most likely a consequence of substantial cell toxicity rather than an effect
mediated by HO-1 induction. The results of this correlation are very interesting as they underline
an inverse, significant relationship between bilirubin and nitrite production in the case of cells
challenged with INF- (Fig. 8A) but a weaker and non-significant relationship for LPS-treated cells (Fig. 8B). These results suggest that HO-1 induction and its enzymatic reaction are linked
to the anti-inflammatory action of the positive compounds tested. The data are also in line with
those obtained with the heme oxygenase inhibitor, highlighting a stronger reliance of positives on
HO-1 in counteracting inflammation caused by INF- than LPS, at least concerning the nitrite response.
3.7. Contribution of HO-1 and Nrf2 in the modulation of inflammatory markers by small molecule activators
18
To assess whether the Nrf2/HO-1 contributed to the inflammatory-modulating properties of small
molecule activators, we treated cells with shRNA to knock down HO-1 or Nrf2 and examined the
generation of nitrite, prostaglandin E2 (PGE2) and tumor necrosis factor-α (TNF-α) induced by INF- or LPS. Control cells were treated with scrambled shRNA and all compounds were used at 10 µM concentration. Fig. 9 illustrates the data obtained in INF- -challenged BV2. As shown in
Fig. 9A, nitrite production increased in control cells incubated with INF- . Silencing of HO-1 or Nrf2 further increased nitrite levels and this effect was more pronounced in Nrf2-lacking cells.
Nitrite was substantially decreased by tBH, CA and CoPP and, while down-regulation of HO-1 or
Nrf2 significantly reversed this outcome in the case of tBH and CA, nitrite levels remained
consistently low in scrambled, HO-1 or Nrf2 shRNA-treated cells in the presence of CoPP. The
nitrite profile observed with the positive DMF or the negatives PRO and R did not differ from
that of cells exposed to INF- alone. Measuring PGE2 provided an interesting and unexpected picture as this inflammatory mediator was increased in scrambled-infected cells challenged with
INF- but was reduced to control levels in HO-1 or Nrf2-silenced cells (Fig. 9B). Levels of PGE2 were similar to control in scramble, HO-1 or Nrf2 shRNA-treated cells in the presence of INF- and all the positives or negatives tested. Similarly, the production of TNF-α was increased by INF- in scrambled-infected cells (Fig. 9C) but was undetectable in HO-1 or Nrf2-silenced cells. Most of the positives and the two negatives tested decreased to some extent TNF-α levels stimulated by INF- in scrambled control cells, however, knocking down HO-1 or Nrf2 did not restore TNF-α production. The only exception to this trend was observed with the positive DMF. In fact, TNF-α was not inhibited in scrambled control cells co-incubated with INF- and DMF, was markedly reduced in HO-1 silenced cells but its levels were re-established in Nrf2-silenced
19
small molecule activators modulate the INF- -mediated inflammatory response; 2) HO-1 and
Nrf2 appear implicated in mediating the effect of small molecule activators on nitric oxide
production but not for PGE2 or TNF-α and γ) the two negative compounds assessed exhibit independent inflammation modulating properties.
Challenge of BV2 with LPS generated a somewhat diverse outcome (Fig. 10). For example, the
positives tested reduced nitrite production but to a smaller extent compared to the results
observed with INF- (Fig. 10A). The most effective compound in this set of experiments was CA and silencing of Nrf2, rather than HO-1, more strongly reversed this effect also in the case of the
negatives PRO and R. Furthermore, and in line with the data acquired from INF- -treated cells,
LPS stimulated a substantial PGE2 production that was decreased in Nrf2-silenced cells but even more when HO-1 was down-regulated (Fig. 10B). The presence of tBH, CA and DMF markedly
diminished PGE2 in scrambled, HO-1 or Nrf2-treated cells and similar trends were observed with the negatives R and to a lesser extent PRO. In contrast to the INF- data, CoPP did not alter the response compared to LPS alone. The final measurement of TNF-α indicated that this marker increased in control scramble cells stimulated with LPS (Fig. 10C). Importantly, this increase was
substantially augmented when HO-1 or Nrf2 were silenced. Apart from CoPP, the positives tBH,
CA, DMF and the negative R diminished TNF-α induced by LPS in control cells and a tendency to reverse this effect was observed mostly in cells silenced for HO-1. Thus, we observe that
following LPS stimulation small molecule activators differentially affect the markers of
inflammation we chose to examine. The results also suggest that HO-1 and/or Nrf2 contribute to
the effect mediated by the compounds either by counteracting the production of certain markers
20
important differences between INF- and LPS-induced inflammation and the roles of HO-1 and Nrf2 in the cellular response to these stimuli.
21 4. Discussion
Manipulation of the Nrf2/HO-1 pathways has been shown experimentally to protect against a
variety of conditions characterized by oxidative damage and inflammation [3,30] and targeting
Nrf2/HO-1 with appropriate pharmacologically-active compounds may help to reduce the
progression of chronic diseases, including neurodegeneration. It is well established that microglia
activation following inflammatory challenge modulates neuroprotection [1,31], suggesting that
controlling microglia activation by pharmacological approaches may be one useful step towards
the reduction of neuronal damage.
We report in this study the results of a screening test of 56 compounds on the up-regulation
of the cytoprotective protein HO-1 in BV2 microglia cells in vitro. The compounds were selected
over more than 100 found during a literature search where HO-1 and/or Nrf2 were the keywords
used. We compared their HO-1 stimulating capacity with their effect on cell viability. We
selected 10 positives (including hemin) and 5 negatives to further examine their effect on heme
metabolism and modulation of the inflammatory response. This investigation identifies carnosic
acid (CAA), carnosol (CA), cobalt protoporphyrin IX (CoPP), dimethyl fumarate (DMF) and
supercurcumin (SC) as the compounds eliciting the best HO-1 induction and low cytotoxicity.
We also found that the compounds differentiate between those capable of promoting the
generation of 1-derived products (CA, CoPP, SC) and others that do not, indicating that
HO-1 induction by specific molecules may be independent from its heme-degradation function. When
assessed for their inflammatory-modulating properties, we observed that the positives reduced
more strongly inflammatory mediators stimulated by INF- than LPS. In addition, the use of shRNA to silence HO-1 or Nrf2 showed that the two pathways contribute to the effect of the
22
INF- , while HO-1 and Nrf2 were substantially implicated in modulating all the inflammatory markers examined after LPS stimulation. These data highlight the pleiotropic activities of the
compounds examined in this study, the different response to LPS and INF- -mediated
inflammation and the importance of comparing compounds with supposedly similar biological
activity within the same cellular system.
The majority of the positive compounds studied in this report possess electrophilic features,
which are necessary for activation of Nrf2 and the induction of Nrf2-dependent genes such as
HO-1. However, despite investigating many substances, the best profile for HO-1 induction/low
cell toxicity was mostly achieved by some of the original compounds first identified many years
ago as HO-1 inducers (i.e. curcumin) [14] and some later identified electrophilic compounds
(carnosol, chalcones) [32-34], suggesting that their chemical structure is perhaps unique and ‘evolutionarily’ selected to specifically activate the Nrf2/HO-1 pathway. This chemical feature is the base for the development of synthetic triterpenoids, a group of Nrf2 activators recently
demonstrated to reduce neurotoxicity, oxidative stress and inflammation in a mouse model of
Parkinson’s disease [35]. However, the results of a recent clinical trial using a similar compound for advanced chronic kidney disease suggests that a better understanding of the biological
behavior of these new molecules and a fine-tuning of their pharmacological vs. cytotoxic
properties is required to fully exploit their therapeutic potential [36].
Apart from hemin, the only HO-1 inducer which is not electrophilic is CoPP. This compound
can act as substrate for heme oxygenase activity, although it is less effective than the natural
substrate heme [37]. However, CoPP up-regulated Nrf2 in human hepatocytes via
post-transcriptional site(s) of action [38] and protected cardiac stem cells from apoptosis in a
23
required for Nrf2/HO-1 activation. Our data showing that NAC reduced the increase in heme
oxygenase by most inducers point to oxidative stress/thiol regulation as important components
for this induction. Since mouse, rat and human primary microglia have been shown to
overexpress HO-1 and activate Nrf2 following various stimuli, we suggest that the Nrf2/HO-1
activators investigated in the present study will exert similar effects also in primary cells.
Our results also show that not all HO-1 inducers stimulate bilirubin production. It was
intriguing to find that for those compounds that induced HO-1 (CA and SC), the source of heme
was external, i.e. the fetal bovine serum with its residual haemoglobin content (18.5 mg/100 ml
according to the certificate of analysis of the FBS used in our cell culture work). This idea is
supported by our data indicating that: 1) no bilirubin production was observed when cells were
incubated in medium containing only 1% serums; 2) pharmacological inhibition of heme
biosynthesis did not affect bilirubin release in the supernatant in the presence of CA and SC and
3) protein expression of other heme metabolism pathways directly related to heme synthesis and
degradation (ALAS 1 synthase or BVR) was not changed by CA and SC. The use of exogenous
heme sources was unlikely to depend from cytotoxicity since CA and SC were among the least
toxic compounds at the concentrations used. A recent article by Zelenka et al. has measured
bilirubin production both intracellularly and in the culture medium by HPLC, showing that
bilirubin is increased in HepG2 cells following HO-1 induction by sodium arsenite and thus
confirming the ability of cells in culture to generate detectable levels of bilirubin after exposure
to the appropriate stimuli [40].
Our approach helped us to compare the molecules in terms of their anti-inflammatory
activity, in order to select the ones that best modulate inflammation in microglia. Positive
24
oxide generation induced by INF- or LPS and inhibition of heme oxygenase activity partially reversed this effect. The degree of nitrite reduction was different for each small molecule and we
noted a stronger contribution of the HO-1 pathway in cells exposed to INF- - than to LPS.
Indeed, the correlation analysis showed a significant inverse correlation between nitrite levels and
bilirubin production elicited by the compounds in INF- -treated cells. This pattern is interesting
and suggests that higher bilirubin levels stimulated by some substances results in lower nitrite
released by microglia following INF- . However, bilirubin applied exogenously (0.5 to 10 µM)
did not change nitrite levels (data not shown). Thus, we suggest that this effect may be due to
CO, produced simultaneously to bilirubin during heme degradation by heme oxygenase, as
shown previously for CO-releasing molecules in murine macrophages and BV2 cells [12,41].
In general, the inflammatory response promoted by LPS was more robust than with INF- ; possibly emphasizing a different microglia response to acute (LPS) versus chronic low level
inflammation (INF- ). In line with this idea, Orozco et al have shown in a large study involving
92 mouse strains that changes in gene expression are more pronounced in primary macrophages
exposed to LPS than to oxidized phospholipids, which also leads to chronic inflammation [42].
Interestingly, the study revealed that HO-1 was markedly regulated in response to oxidized
phospholipids but not to LPS. Our data using cells silenced for HO-1 or Nrf2 also highlight
intriguing observations. First, we noted that in the absence of positives or negatives, silencing
HO-1 or Nrf2 modulated the production of inflammatory markers induced by INF- or LPS; in particular, nitrite levels were enhanced while PGE2 was decreased. Conversely, lack of HO-1 or Nrf2 abolished TNF-α release in cells challenged with INF- but augmented it in the case of LPS. Thus, HO-1 and Nrf2 counteract nitric oxide production but support the generation of PGE2. This inflammatory lipid mediator deriving from cyclooxygenase-2 exhibits both pro- and
anti-25
inflammatory properties and may have different roles depending on the condition examined.
Second, knocking down HO-1 or Nrf2 influenced more nitrite production by the compounds in
cells challenged with INF- . The compounds (including the negatives PRO and R) completely blocked PGE2 production by INF- and silencing HO-1 or Nrf2 did not restore PGE2 levels. This effect was similar but less pronounced in LPS-stimulated microglia. Our findings are in line with
a recent report showing that R inhibited LPS-mediated stimulation of PGE2 by BV2 via the mammalian target of rapamycin signalling pathway [43]. They also demonstrate that natural
based molecules can exert similar anti-inflammatory activity by modulating cellular mechanisms
alternative or parallel to HO-1 and Nrf2. Third, the inflammatory-regulating properties of the
compounds were better differentiated in LPS-treated cells. For example, CA was the most
effective regulator of the response while tBH or DMF had less influence on nitrite production but
affected more PGE2 and TNF-α levels. Although the bioavailability of these compounds may be limited in vivo, published findings in animals show beneficial effects of sulforaphane, curcumin
and other Nrf2 activators in brain inflammation [3,44].
In conclusion, we have identified potent activators of the Nrf2/HO-1 pathways (i.e. carnosol,
cobalt protoporphyrin, dimelthyl fumarate, supercurcumin) capable of modulating inflammation
in BV2 microglia, suggesting a complex role of these compounds in controlling the production of
inflammatory mediators. Our results also point to heme metabolism as an additional factor
affecting the actions of these compounds, indicating that HO-1 induction in the absence of heme
degradation may limit the cytoprotective potential of this enzyme. This screening approach
suggests that modification of selected chemical scaffolds may be promising for the synthesis of
26
Q et al. with the synthesis of potent, orally active curcumin derivatives that prevented cognitive
decline in a mouse model of Alzheimer’s disease [45].
Acknowledgements
A preliminary part of this work was conducted when R.F., S.K.B., T.P., L.E.B.C. and R.M. were working at the Department of Drug Discovery and Development, Italian Institute of Technology,
Genova, Italy. We thank AREMCAR Foundation for financial support and the International PhD
Program in Neuropharmacology, Medical School, University of Catania. This work was
supported in part by a grant from the Agence Nationale de la Recherche (MITO-CO) to Dr.
Roberto Motterlini.
References
[1] Skaper SD, Giusti P, Facci L. Microglia and mast cells: two tracks on the road to neuroinflammation. FASEB J 2012;26:3103-3117.
[2] Jazwa A and Cuadrado A. Targeting heme oxygenase-1 for neuroprotection and neuroinflammation in neurodegenerative diseases. Curr Drug Targets 2010;11:1517-1531.
[3] Innamorato NG, Rojo AI, Garcia-Yague AJ, Yamamoto M, de Ceballos ML, Cuadrado A. The transcription factor Nrf2 is a therapeutic target against brain inflammation. J Immunol 2008;181:680-689.
[4] Yoh K, Hirayama A, Ishizaki K, Yamada A, Takeuchi M, Yamagishi S, Morito N, Nakano T, Ojima M, Shimohata H, Itoh K, Takahashi S, Yamamoto M. Hyperglycemia induces oxidative and nitrosative stress and increases renal functional impairment in Nrf2-deficient mice. Genes Cells 2008;13:1159-1170.
27
[5] Thimmulappa RK, Lee H, Rangasamy T, Reddy SP, Yamamoto M, Kensler TW, Biswal S. Nrf2 is a critical regulator of the innate immune response and survival during experimental sepsis. J Clin Invest 2006;116:984-995.
[6] Braun S, Hanselmann C, Gassmann MG, Auf dem KU, Born-Berclaz C, Chan K, Kan YW, Werner S. Nrf2 transcription factor, a novel target of keratinocyte growth factor action which regulates gene expression and inflammation in the healing skin wound. Mol Cell Biol 2002;22:5492-5505.
[7] Kitamuro T, Takahashi K, Ogawa K, Udono-Fujimori R, Takeda K, Furuyama K, Nakayama M, Sun J, Fujita H, Hida W, Hattori T, Shirato K, Igarashi K, Shibahara S. Bach1 functions as a hypoxia-inducible repressor for the heme oxygenase-1 gene in human cells. J Biol Chem 2003;278:9125-9133.
[8] Baird L and Dinkova-Kostova AT. The cytoprotective role of the Keap1-Nrf2 pathway. Arch Toxicol 2011;85:241-272.
[9] Motterlini R and Otterbein LE. The therapeutic potential of carbon monoxide. Nat Rev Drug Discov 2010;9:728-743.
[10] Bulmer AC, Verkade HJ, Wagner KH. Bilirubin and beyond: A review of lipid status in Gilbert's syndrome and its relevance to cardiovascular disease protection. Prog Lipid Res 2012;52:193-205.
[11] Sawle P, Foresti R, Mann BE, Johnson TR, Green CJ, Motterlini R. Carbon monoxide-releasing molecules (CO-RMs) attenuate the inflammatory response elicited by lipopolysaccharide in RAW264.7 murine macrophages. Br J Pharmacol 2005;145:800-810.
[12] Bani-Hani MG, Greenstein D, Mann BE, Green CJ, Motterlini R. Modulation of thrombin-induced neuroinflammation in BV-2 microglia by a carbon monoxide-releasing molecule (CORM-3). J Pharmacol Exp Ther 2006;318:1315-1322.
[13] Yabluchanskiy A, Sawle P, Homer-Vanniasinkam S, Green CJ, Foresti R, Motterlini R. CORM-3, a carbon monoxide-releasing molecule, alters the inflammatory response and
28
reduces brain damage in a rat model of hemorrhagic stroke. Crit Care Med 2012;40:544-552.
[14] Motterlini R, Foresti R, Bassi R, Green CJ. Curcumin, an antioxidant and anti-inflammatory agent, induces heme oxygenase-1 and protects endothelial cells against oxidative stress. Free Rad Biol Med 2000;28:1303-1312.
[15] Balogun E, Hoque M, Gong P, Killeen E, Green CJ, Foresti R, Alam J, Motterlini R. Curcumin activates the heme oxygenase-1 gene via regulation of Nrf2 and the antioxidant responsive element. Biochem J 2003;371:887-895.
[16] Scapagnini G, Foresti R, Calabrese V, Stella AM, Green CJ, Motterlini R. Caffeic acid phenethyl ester and curcumin: a novel class of heme oxygenase-1 inducers. Mol Pharmacol 2002;61:554-561.
[17] Sawle P, Moulton BE, Jarzykowska M, Green CJ, Foresti R, Fairlamb IJ, Motterlini R. Structure-Activity Relationships of Methoxychalcones as Inducers of Heme Oxygenase-1. Chem Res Toxicol 2008;21:1484-1494.
[18] Vesely MJJ, Exon DJ, Clark JE, Foresti R, Green CJ, Motterlini R. Heme oxygenase-1 induction in skeletal muscle cells: hemin and sodium nitroprusside are regulators in vitro. Am J Physiol 1998;275:C1087-C1094.
[19] Clark JE, Foresti R, Green CJ, Motterlini R. Dynamics of haem oxygenase-1 expression and bilirubin production in cellular protection against oxidative stress. Biochem J 2000;348:615-619.
[20] Foresti R and Motterlini R. The heme oxygenase pathway and its interaction with nitric oxide in the control of cellular homeostasis. Free Rad Res 1999;31:459-475.
[21] Goldring CE, Kitteringham NR, Elsby R, Randle LE, Clement YN, Williams DP, McMahon M, Hayes JD, Itoh K, Yamamoto M, Park BK. Activation of hepatic Nrf2 in vivo by acetaminophen in CD-1 mice. Hepatology 2004;39:1267-1276.
29
[22] Deng YM, Wu BJ, Witting PK, Stocker R. Probucol protects against smooth muscle cell proliferation by upregulating heme oxygenase-1. Circulation 2004;110:1855-1860.
[23] Vidavalur R, Penumathsa SV, Zhan L, Thirunavukkarasu M, Maulik N. Sildenafil induces angiogenic response in human coronary arteriolar endothelial cells through the expression of thioredoxin, hemeoxygenase and vascular endothelial growth factor. Vascul Pharmacol 2006;45:91-95.
[24] Joung EJ, Li MH, Lee HG, Somparn N, Jung YS, Na HK, Kim SH, Cha YN, Surh YJ. Capsaicin induces heme oxygenase-1 expression in HepG2 cells via activation of PI3K-Nrf2 signaling: NAD(P)H:quinone oxidoreductase as a potential target. Antioxid Redox Signal 2007;9:2087-2098.
[25] Johnson J, Maher P, Hanneken A. The flavonoid, eriodictyol, induces long-term protection in ARPE-19 cells through its effects on Nrf2 activation and phase 2 gene expression. Invest Ophthalmol Vis Sci 2009;50:2398-2406.
[26] Chernova T, Nicotera P, Smith AG. Heme deficiency is associated with senescence and causes suppression of N-methyl-D-aspartate receptor subunits expression in primary cortical neurons. Mol Pharmacol 2006;69:697-705.
[27] Jaronczyk K, Bui L, Soong JM, McLaughlin BE, Marks GS, Brien JF, Nakatsu K. The source of heme for vascular heme oxygenase II: de novo heme biosynthesis in rat aorta. Can J Physiol Pharmacol 2004;82:218-224.
[28] Wegiel B and Otterbein LE. Go green: the anti-inflammatory effects of biliverdin reductase. Front Pharmacol 2012;3:47-.
[29] Abuarqoub H, Foresti R, Green CJ, Motterlini R. Heme oxygenase-1 mediates the anti-inflammatory actions of 2'-hydroxychalcone in RAW 264.7 murine macrophages. Am J Physiol Cell Physiol 2006;290:C1092-C1099.
[30] Motohashi H and Yamamoto M. Nrf2-Keap1 defines a physiologically important stress response mechanism. Trends Mol Med 2004;10:549-557.
30
[31] Aguzzi A, Barres BA, Bennett ML. Microglia: scapegoat, saboteur, or something else? Science 2013;339:156-161.
[32] Martin D, Rojo AI, Salinas M, Diaz R, Gallardo G, Alam J, De Galarreta CM, Cuadrado A. Regulation of heme oxygenase-1 expression through the phosphatidylinositol 3-kinase/Akt pathway and the Nrf2 transcription factor in response to the antioxidant phytochemical carnosol. J Biol Chem 2004;279:8919-8929.
[33] Alcaraz MJ, Vicente AM, Araico A, Dominguez JN, Terencio MC, Ferrandiz ML. Role of nuclear factor-kappaB and heme oxygenase-1 in the mechanism of action of an anti-inflammatory chalcone derivative in RAW 264.7 cells. Br J Pharmacol 2004;142:1191-1199.
[34] Foresti R, Hoque M, Monti D, Green CJ, Motterlini R. Differential activation of heme oxygenase-1 by chalcones and rosolic acid in endothelial cells. J Pharmacol Exp Ther 2005;312:686-693.
[35] Kaidery NA, Banerjee R, Yang L, Smirnova NA, Hushpulian DM, Liby KT, Williams CR, Yamamoto M, Kensler TW, Ratan RR, Sporn MB, Beal MF, Gazaryan IG, Thomas B. Targeting Nrf2-mediated gene transcription by extremely potent synthetic triterpenoids attenuate dopaminergic neurotoxicity in the MPTP mouse model of Parkinson's disease. Antioxid Redox Signal 2013;18:139-157.
[36] Zhang DD. Bardoxolone Brings Nrf2-Based Therapies to Light. Antioxid Redox Signal 2013;In Press.
[37] Maines MD and Kappas A. Enzymatic oxidation of cobalt protoporphyrin IX: observations on the mechanism of heme oxygenase action. Biochemistry 1977;16:419-423.
[38] Shan Y, Lambrecht RW, Donohue SE, Bonkovsky HL. Role of Bach1 and Nrf2 in up-regulation of the heme oxygenase-1 gene by cobalt protoporphyrin. FASEB J 2006;20:2651-2653.
31
[39] Cai C, Teng L, Vu D, He JQ, Guo Y, Li Q, Tang XL, Rokosh G, Bhatnagar A, Bolli R. The heme oxygenase 1 inducer (CoPP) protects human cardiac stem cells against apoptosis through activation of the extracellular signal-regulated kinase (ERK)/NRF2 signaling pathway and cytokine release. J Biol Chem 2012;287:33720-33732.
[40] Zelenka J, Muchova L, Zelenkova M, Vanova K, Vreman HJ, Wong RJ, Vitek L. Intracellular accumulation of bilirubin as a defense mechanism against increased oxidative stress. Biochimie 2012;94:1821-1827.
[41] Bani-Hani MG, Greenstein D, Mann BE, Green CJ, Motterlini R. A carbon monoxide-releasing molecule (CORM-3) attenuates lipopolysaccharide- and interferon-gamma-induced inflammation in microglia. Pharmacol Rep 2006;58:132-144.
[42] Orozco LD, Bennett BJ, Farber CR, Ghazalpour A, Pan C, Che N, Wen P, Qi HX, Mutukulu A, Siemers N, Neuhaus I, Yordanova R, Gargalovic P, Pellegrini M, Kirchgessner T, Lusis AJ. Unraveling inflammatory responses using systems genetics and gene-environment interactions in macrophages. Cell 2012;151:658-670.
[43] Zhong LM, Zong Y, Sun L, Guo JZ, Zhang W, He Y, Song R, Wang WM, Xiao CJ, Lu D. Resveratrol inhibits inflammatory responses via the mammalian target of rapamycin signaling pathway in cultured LPS-stimulated microglial cells. PLoS One 2012;7:e32195.
[44] He LF, Chen HJ, Qian LH, Chen GY, Buzby JS. Curcumin protects pre-oligodendrocytes from activated microglia in vitro and in vivo. Brain Res 2010;1339:60-69.
[45] Chen Q, Prior M, Dargusch R, Roberts A, Riek R, Eichmann C, Chiruta C, Akaishi T, Abe K, Maher P, Schubert D. A novel neurotrophic drug for cognitive enhancement and Alzheimer's disease. PLoS One 2011;6:e27865.
32 FIGURE LEGENDS
FIGURE 1. Bilirubin production following exposure of BV2 to HO-1 inducers. A) Bilirubin
accumulated over time was measured in the supernatant of microglia cells 6 or 24 h after exposure to different HO-1 inducers (20 µM). * < P 0.05 vs. control 6 h, † < P 0.05 vs. control 24 h. B) and C) Bilirubin released in the culture medium following co-incubation of HO-1 inducers (20 µM) and the heme oxygenase substrate hemin (H, 10 µM) for 6 or 24 h, respectively. Bilirubin was calculated in picomoles/ml medium and is shown here as fold increase over the control. Data are the mean ± SEM of 4-6 independent experiments per group. * < P 0.05 vs. control (CON), † < P 0.05 vs. hemin alone (H).
FIGURE 2. Cellular bilirubin production and heme levels in the presence of a heme biosynthesis
inhibitor. A) Bilirubin accumulated in the culture supernatant and B), heme content measured following exposure of BV2 for 6 h to hemin (H, 10 µM) and supercurcumin (SC, 20 µM) or carnosol (CA, 20 µM) in medium containing 10% or 1% FBS, in the presence or absence of succinylacetone (SA, 1 mM). Bilirubin and heme levels were assessed according to spectrophotometric assays described in Materials and Methods. C) HMOX1 mRNA levels after incubation with different inducers and negatives as measured by RT-PCR. Data are the mean ± SEM of 3-6 independent experiments per group. * < P 0.05 vs. control (CON).
FIGURE 3. Small molecules activators do not increase expression of ALAS 1 or BVR. A)
ALAS 1 and B), BVR expression were measured by Western Blot after 6 h incubation of BV2 cells with 20 µM supercurcumin (SC), carnosol (CA), dimethyl fumarate (DMF), probucol (PRO) or resveratrol (R). Results represent the mean of 3 independent experiments and the corresponding densitometric analysis, normalized over the levels of -actin, is depicted on the right. C) Heme oxygenase activity was determined in cells exposed to 10 different HO-1 inducers (20 µM) in the presence or absence of N-acetylcysteine (NAC, 1 mM) using a biochemical assay well established in our laboratory. NAC partially reduced the increase in heme oxygenase stimulated by the compounds. Heme oxygenase activity was calculated in picomoles bilirubin/mg protein/60 min and expressed in fold increase over the control values. Data are the mean ± SEM
33
of 4 independent experiments per group. * < P 0.05 vs. control (CON), † < P 0,05 vs. HO-1 inducer alone.
FIGURE 4. HO-1 inducers affect nitrite production elicited by INF- in a
concentration-dependent manner. Cells were exposed for 24 h to INF- (15 ng/ml) in the presence of increasing concentrations of the compounds (5, 10 and 20 µM) and nitrite levels were measured in the supernatant. All small molecule activators of Nrf2/HO-1 tended to decrease nitrite levels stimulated by INF- , especially at the highest concentration tested (20 µM). CoPP and sulforaphane (S) were the most effective even at lower concentrations. The Griess reagent was used to determine nitrite production. Data represent the mean ± SEM of 5-6 independent experiments per group.
FIGURE 5. Effect of negatives on nitrite production elicited by INF- . Cells were exposed for β4
h to INF- (15 ng/ml) in the presence of increasing concentrations (5, 10 and 20 µM) of the compounds that did not up-regulate HO-1 and nitrite levels were measured in the supernatant. Eriodictyol (E) and plumbagin (PLU) were the only ones capable of decreasing nitrite levels, although for PLU this effect is likely due to the extreme cell toxicity caused by the compound. The Griess reagent was used to determine nitrite production. Data represent the mean ± SEM of 5-6 independent experiments per group.
FIGURE 6. Small molecule activators affect nitrite production elicited by LPS in a
concentration-dependent manner. Cells were exposed for 24 h to LPS (0.5 µg/ml) in the presence of increasing concentrations (5, 10 and 20 µM) of the compounds and nitrite levels were measured in the supernatant. All compounds markedly decreased nitrite levels stimulated by LPS. Carnosol (CA), CoPP, sulforaphane (S) and supercurcumin (SC) were the most effective molecules. The Griess reagent was used to determine nitrite production. Data represent the mean ± SEM of 5-6 independent experiments per group.
FIGURE 7. Effect of negatives on nitrite production elicited by LPS. Cells were exposed for 24
h to LPS (0.5 µg/ml) in the presence of increasing concentrations (5, 10 and 20 µM) of negatives and nitrite levels were measured in the supernatant. Eriodictyol (E) and plumbagin (PLU) were
34
markedly decreased nitrite levels, although this effect was likely due to the extreme cell toxicity caused in the case of PLU. The Griess reagent was used to determine nitrite production. Data represent the mean ± SEM of 5-6 independent experiments per group.
FIGURE 8. Bilirubin production induced by HO-1 inducers is inversely correlated with nitrite
levels. A) Correlation analysis between the amount of bilirubin generated by each positive and nitrite levels following co-incubation of BV2 with INF- and positive compounds. The results show that higher bilirubin production is associated with lower nitrite. B) The same analysis was performed in cells challenged with LPS, showing a similar, albeit not significant, trend.
FIGURE 9. Changes in the production of inflammatory mediators elicited by small molecules
after INF- challenge are partially controlled by the HO-1 and/or Nrf2 genes. BV2 cells were treated with scrambled control shRNA or shRNA for HO-1 or Nrf2 as described in Materials and Methods. Once transfected colonies were selected, cells were stimulated with INF- (15 ng/ml) for 24 h in the presence or absence of the HO-1 inducers tert-butyl hydroquinone (tBH), carnosol (CA), CoPP and dimethyl fumarate (DMF) and the negatives probucol (PRO) and resveratrol (R) at 10 µM concentration and the supernatant was collected for measurement of nitrite (Griess reagent) and PGE2 and TNF-α by ELISA. A) Compounds decreased nitrite levels to different extents and silencing HO-1 or Nrf2 partially reversed this effect. B) Knock down of HO-1 or Nrf2 did not reverse the inhibition of PGE2 production by compounds. C) INF- -mediated TNF-α production was partially decreased by compounds but was not reversed in cells silenced for HO-1 or Nrf2. Data are the mean ± SEM of 3 independent experiments per group. * < P 0.05 vs. unstimulated cells (CON), † < P 0.05 vs. scrambled-transfected cells, # P 0.05 vs. cells stimulated with INF- only.
FIGURE 10. Changes in the production of inflammatory mediators elicited by small molecules
after LPS challenge are partially controlled by the HO-1 and/or Nrf2 genes. BV2 cells were treated with scrambled control shRNA or shRNA for HO-1 or Nrf2 as described in Materials and Methods. The same treatments and measurements described for Fig. 9 were applied in cells stimulated with LPS (0.5 µg/ml) for 24 h. A) Compounds decreased nitrite levels to different extents and silencing Nrf2 partially reversed this effect. B) Knock down of HO-1 or Nrf2 reduced
35
PGE2 levels induced by LPS and did not reverse the inhibition of PGE2 production by compounds. C) LPS-mediated TNF-α production was increased in cells silenced for HO-1 or Nrf2. Compounds partially decreased TNF-α levels and silencing HO-1 partially reversed this effect. Data are the mean ± SEM of 3 independent experiments per group. * < P 0,05 vs unstimulated cells (CON), † < P 0.05 vs. scrambled-transfected cells, # P 0.05 vs. cells stimulated with LPS only.
Supplementary Figure 1. Inhibition of heme oxygenase activity by SnPPIX partially reverses
the decrease in INF- -mediated nitrite production exerted by some HO-1 inducers. SnPPIX (10 µM), the inhibitor of heme oxygenase activity, was co-incubated with small molecule activators (10 µM) in cells challenged with INF- (15 ng/ml) for β4 h. We observed that the decrease in nitrite levels elicited by tert-butyl hydroquinone (tBH), carnosol (CA), CoPP, supercurcumin (SC) and sulforaphane (S) was partially reversed by SnPPIX. Nitrite was measured in the cell supernatant using the Griess reagent. Data represent the mean ± SEM of 5-6 independent experiments per group.
Supplementary Figure 2. Small contribution of the HO-1 pathway in the decrease of nitrite
production exerted by certain compounds in LPS-challenged BV2 cells. SnPPIX (10 µM) was co-incubated with small molecule activators (10 µM) in cells challenged with LPS (0.5 µg/ml) for 24 h. The heme oxygenase inhibitor modestly reversed the decrease in nitrite levels elicited by tert-butyl hydroquinone (tBH), carnosic acid (CAA), carnosol (CA), and isoliquiritigenin (ISL). Nitrite was measured in the cell supernatant using the Griess reagent. Data represent the mean ± SEM of 5-6 independent experiments per group.
Figure 1
Figure 2
Figure 3
Figure 4
Figure 5
Figure 6
Figure 7
Figure 8
Figure 9
Figure 10