HAL Id: hal-00553425
https://hal.archives-ouvertes.fr/hal-00553425
Submitted on 10 Mar 2011
HAL is a multi-disciplinary open access
archive for the deposit and dissemination of sci-entific research documents, whether they are pub-lished or not. The documents may come from teaching and research institutions in France or abroad, or from public or private research centers.
L’archive ouverte pluridisciplinaire HAL, est destinée au dépôt et à la diffusion de documents scientifiques de niveau recherche, publiés ou non, émanant des établissements d’enseignement et de recherche français ou étrangers, des laboratoires publics ou privés.
Effects of transcranial direct current stimulation (tDCS)
on sensory evoked potentials
Behnam Molaee-Ardekani, Javier Márquez-Ruiz, Rocío Leal-Campanario,
Agnès Gruart, Isabelle Merlet, Gwenael Birot, José Maria Delgado-García,
Giulio Ruffini, Fabrice Wendling
To cite this version:
Behnam Molaee-Ardekani, Javier Márquez-Ruiz, Rocío Leal-Campanario, Agnès Gruart, Isabelle Mer-let, et al.. Effects of transcranial direct current stimulation (tDCS) on sensory evoked potentials. Cinquième conférence plénière française de Neurosciences Computationnelles, ”Neurocomp’10”, Aug 2010, Lyon, France. �hal-00553425�
EFFECTS OF TRANSCRANIAL DIRECT CURRENT STIMULATION (tDCS)
ON SENSORY EVOKED POTENTIALS: A COMPUTATIONAL MODELING
STUDY
Behnam Molaee-Ardekani1,2, Javier Márquez-Ruiz 3, Rocío Leal-Campanario3, Agnès Gruart3, Isabelle Merlet1,2, Gwenael Birot1,2, José Maria Delgado-García3, Giulio Ruffini4, and, Fabrice Wendling1,2
1
INSERM, U642, Rennes, F-35000, France 2
Université de Rennes 1, LTSI, F-35000, France 3
University Pablo de Olavide, Sevilla, Spain 4
Starlab, Barcelona, Spain
[email protected], [email protected]
ABSTRACT
We present a combined experimental/computational modeling approach aimed at studying the effects of transcranial Direct Current Stimulation (tDCS) on neuronal systems. More particularly, we introduce i) a neural mass model (neuronal population level) of the cerebral cortex and ii) a coupling model between the considered neuronal population and an externally-applied electric field. We then use this computational modeling approach to interpret evoked potentials (EPs) recorded from the somatosensory cortex of the rabbit under tDCS. Results showed that the model could accurately reproduce the time-course of actual EPs (polarity and latency of main peaks) recorded under control (i.e. “no tDCS stimulation”) condition. From real data, we also identified the “major” effects of tDCS on EPs in terms of shape modifications and we studied the necessary and sufficient conditions for which the model could reproduce these effects. We found that pyramidal cells should be depolarized (resp. hyperpolarized) in order to simulate the effects of anodal (resp. cathodal) currents. We also found that some interneurons are sensitive to externally-applied fields, indicating that modelling efforts need to also consider the role of these neurons to fully understand interactions between stimulation currents and underlying neuronal systems.
KEY WORDS
Computational modeling, neural mass, electric field, transcranial direct current stimulation, tDCS, local field potential, LFP, Evoked potential EP, neural mass model, in vivo recording
1. Introduction
Over the past decade, the use of transcranial Direct Current Stimulation (tDCS) and its variants (tRNS, tACS) has considerably increased both in clinical and research studies [1]. Although it is well-admitted that these non-invasive techniques allow for interacting with brain endogenous rhythms, the exact mechanisms by which externally-applied fields modulate the activity of neurons are not well described yet. For instance, a question that is not resolved yet is whether - and how - an externally-applied field may also affect local
interneurons in addition to pyramidal cells. Several in vitro and in vivo studies have been conducted to address such issues by exploring the behaviour of small and large networks of neurons under the effect of electric or magnetic stimulations (see [2, 3] among others). These studies constitute first attempts to address some fundamental questions about the role of stimulation parameters (stimulation intensity, duration, frequency, repetition, position/orientation/shape of stimulating devices) and subsequent effects on stimulated systems. More recently, biophysicists have also proposed some models aiming to provide insight into the mechanisms involved in the interaction between neurons and externally-applied fields. Most of these models account for the effects of external fields on single neurons. However, only a few models have addressed the behaviour of assemblies of neurons under the effect of applied fields. Such models have been proposed at two different levels: detailed (or microscopic) level and population (or mesoscopic) level. Compared to detailed level modelling in which intrinsic properties of neurons and interactions among neurons are accurately described, population models do not express explicitly action potentials of single neurons; instead they express mean activities (average post-synaptic potentials and firing rate) of interacting sub-populations comprised in the considered assembly of neurons.
The research on mesoscopic models accounting for the effects of electric fields on neuronal populations is limited. To the best of our knowledge, a first attempt is reported in [10] in the context of seizure anticipation based on an active paradigm that uses intermittent electrical stimulation. In line with this first attempt, we have developed a model of the somatosensory cortex. Our objective is to analyze in details how a neuronal assembly is affected by the electric field and how its response, as observed in the local field potential (LFP), relates to the electric field parameters.
2. Material and methods
2.1 Experimental model and in vivo recordings
To study the local effects of tDCS on brain activities, four male rabbits were prepared for chronic intracortical
recording from somatosensory cortex under the influence of tDCS. In short, and following procedures described elsewhere [4], under deep anaesthesia the animal’s skull was drilled over the somatosensory
cortex and four silver ball electrodes (1 mm in
diameter) were symmetrically placed around the drilled window in the skull. A head-holding system was used to cement these stimulating electrodes to the skull. These stimulating electrodes were placed into a socket and were short-circuited. After 1 week allowance for recovery, animals were habituated to the restraining box for about three days. Once the animals were habituated to the recording system, a glass micropipette was inserted into the somatosensory cortex corresponding to the whiskers. The final recording position of the micropipette was determined by mapping the receptor field of the contra-lateral whisker pad by the presentation of air-puffs to the whiskers. Once LFP specificity was established for a particular whisker pad region, air pulses (100 ms, 2 bars) were delivered every 10 ± 3 s before (control) and during application of tDCS (anodal or cathodal current). tDCS was applied to the four silver ball electrodes, whilst a saline-soaked sponge attached to the ear contra-lateral to the recording side served as the counter electrode. Anodal and cathodal stimulations were performed with current intensities equal to +1 and -1 mA, respectively. Evoked potentials in response to air-puffs were recorded (sampling frequency 16667Hz) for 20 minutes under anodal, cathodal and no stimulus (control) conditions for further analyses.
2.2 Computational model
2.2.1 Basic structure of the model
A neural-mass type model was developed to reproduce sensory evoked potentials recorded from the somatosensory cortex of rabbits, in response to an air-puffs directed to the whisker pad. The structure of the model is very similar to the model we presented in [4] based on a vast literature review. In this macroscopic class of models, a population of cells is considered. This population is composed by different subpopulations of cells (typically principal cells and interneurons) which interact via synaptic connections. Our model accounts for the main types of cells present in the cerebral cortex:
- pyramidal cells,
- axon-, soma- and proximal dendrite-targeting cells: basket cells and chandelier cells (type I interneurons mediating GABAa,fast currents), - dendrite-targeting cells: bitufted, bipolar and
double bouquet cells (type I’ interneurons mediating GABAa,slow currents).
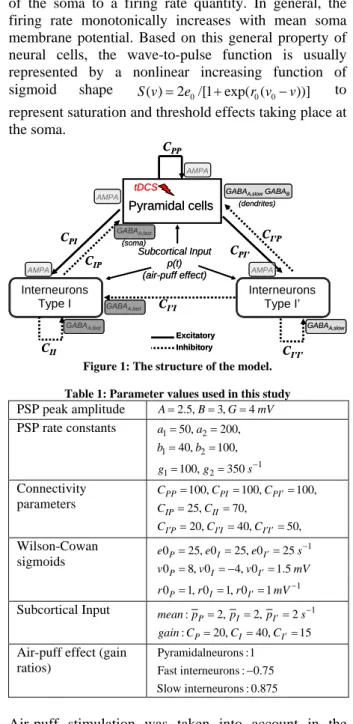
The structure of the model and the values to which we set the free parameters of the model (see [4] for more information about the model parameters) are shown in figure 1 and table 1, respectively. According to this modeling approach, and as shown in figure 2-a, at each subpopulation, a pulse-to-wave function transforms the average presynaptic pulse density of afferent action potentials (input) into an average postsynaptic membrane potential (output).
On the other side, at the output of each population a wave-to-pulse transforms the mean membrane potential of the soma to a firing rate quantity. In general, the firing rate monotonically increases with mean soma membrane potential. Based on this general property of neural cells, the wave-to-pulse function is usually represented by a nonlinear increasing function of sigmoid shape
0 0 0
( ) 2 /[1 exp( ( ))]
S v = e + r v −v to
represent saturation and threshold effects taking place at the soma.
Pyramidal cells
Interneurons
(Type I: Bas., Chand.)
Interneurons
(Type I’ : NGFCs)
(soma)
GABAA,slowGABAB
(dendrites) GABAA,slow CPP CPI CIP CII C I’I’ CI’P CPI’ CI’I Subcortical Input p(t) (air-puff effect) Excitatory Inhibitory GABAA,fast AMPA AMPA AMPA AMPA GABAA,fast GABAA,fast tDCS Pyramidal cells Interneurons
(Type I: Bas., Chand.)
Interneurons
(Type I’ : NGFCs)
(soma)
GABAA,slowGABAB
(dendrites) GABAA,slow CPP CPI CIP CII C I’I’ CI’P CPI’ CI’I Subcortical Input p(t) (air-puff effect) Excitatory Inhibitory GABAA,fast AMPA AMPA AMPA AMPA GABAA,fast GABAA,fast tDCS
Figure 1: The structure of the model. Table 1: Parameter values used in this study
PSP peak amplitude A=2.5,B=3,G=4mV PSP rate constants 1 2 1 2 1 1 2 50, 200, 40, 100, 100, 350 a a b b g g s− = = = = = = Connectivity parameters 100, 100, 100, 25, 70, 20, 40, 50, PP PI PI IP II I P I I I I C C C C C C C C ′ ′ ′ ′ ′ = = = = = = = = Wilson-Cowan sigmoids 1 1 0 25, 0 25, 0 25 0 8, 0 4, 0 1.5 0 1, 0 1, 0 1 P I I P I I P I I e e e s v v v mV r r r mV − ′ ′ − ′ = = = = = − = = = = Subcortical Input : 2, 2, 2 1 : 20, 40, 15 P I I P I I mean p p p s gain C C C − ′ ′ = = = = = =
Air-puff effect (gain ratios)
Pyramidalneurons :1 Fast interneurons : 0.75 Slow interneurons : 0.875
−
Air-puff stimulation was taken into account in the model. It was represented as an abrupt increase of the density action potentials coming from sub-cortical structures to the three neuronal populations that has been considered in the model. Therefore, at the level of pyramidal cells, the model accounts for two types of inhibition: feedback (from local interneurons targeted by pyramidal cells themselves) and feedforward (from the same local interneurons when they receive external excitatory input). In practice, the model consists in 14 ordinary differential equations with a nonlinear term introduced by the sigmoid function. These equations were solved using a Runge-Kutta algorithm (fourth-order, fixed step).
2.2.2 Representation of the effect of tDCS in the model
In the proposed model, not only we considered the effect of a sensory input (i.e. air-puff), but also we included the effect of the applied tDCS electric field in
Interneurons Type I’ Interneurons
the rabbit cortex. The effect of air-puff stimulation was considered in the model by a modulatory signal p(t) (see figure 1) that is supposed to bring sub-cortical excitatory signals to principal cells and interneurons at their pulse-to-wave input function.
In the proposed model we represented the influence of tDCS as a perturbation on the mean membrane potential of neuronal populations in the model. More specifically, we assumed that, within a certain range of intensity, the applied electric field could linearly modify the average membrane potential at the level of the different sub-populations. More specifically, the perturbation is in a direction dependent manner, as in ΔV=λ⋅E, for some vector λ representing the membrane space constant and pointing in the “orthodromic” direction of the neuron. This implies, e.g., that a field aligned with the orthodromic direction (dentridic tuft to axon), will result in a positive or (depolarizing or excitatory) perturbation of the membrane potential. Such modification of the cell membrane potential will be further described in a forthcoming publication, but is well grounded in the biophysics of compartment models [9] and supported by in-vitro experiments that showed the application of exogenous uniform electric fields parallel to the soma–dendritic axis results in changes in transmembrane potential [3]. Indeed, from intracellular recordings (effects on single pyramidal cells of CA1), authors confirmed that application of exogenous uniform electric fields parallel to the soma–dendritic axis results in changes in transmembrane potential (all recorded neurons): positive (respectively negative) fields resulted in somatic hyperpolarization (respectively depolarization).
Pulse to wave
(linear transfer function)
Wave to pulse (nonlinear function) From other subset(s) of cells
To other subset(s) of cells Pulse to wave
(linear transfer function)
Wave to pulse (nonlinear function) From other subset(s) of cells
To other subset(s) of cells
APs ePSPs or IPSPs Excitatory synaptic input (bi-exponential) + -v (mV) S (v ) (v0, e0) v (mV) S (v ) v (mV) S (v ) (v0, e0) ePSPs IPSPs APs
Input from other subsets of cells
+ λ.Ey E APs a) b) Ey x y Inhibitory synaptic input (bi-exponential) Sigmoid output input Pulse to wave
(linear transfer function)
Wave to pulse (nonlinear function) From other subset(s) of cells
To other subset(s) of cells Pulse to wave
(linear transfer function)
Wave to pulse (nonlinear function) From other subset(s) of cells
To other subset(s) of cells
APs APs ePSPs or IPSPs ePSPs or IPSPs Excitatory synaptic input (bi-exponential) + -v (mV) S (v ) (v0, e0) v (mV) S (v ) v (mV) S (v ) (v0, e0) ePSPs ePSPs IPSPsIPSPs
APs APs
Input from other subsets of cells
+ λ.Ey E E APs APs a) b) Ey Ey x y Inhibitory synaptic input (bi-exponential) Sigmoid output input
Figure 2: Coupling model between a subpopulation of neurons in the neural mass model and the electric field resulting from the externally-applied stimulation (tDCS). a) Schematic diagram showing a given subpopulation of cells, its input and output and the projection of the field vector on the main axis of the cells (blue color) b) According to this model of interaction, the variation of the average membrane potential of a given subpopulation is proportional to the intensity of the component of the electric field oriented along the main axis of the cells.
In the model, we included the externally-applied field effect by adding a DC-offset voltage to the mean membrane potentials of pyramidal cells, but also on the more isotropically oriented interneuron populations. This voltage can have either depolarizing or hyperpolarizing effect, depending on its polarity. As a consequence the wave-to-pulse sigmoid function
directly increases or decreases the firing rate of neuronal populations accordingly. Note that this effect on the firing rate is also consistent with results reported experimentally [3], as the applied field also modifies the action potential threshold.
3. Results
3.1. Real evoked responses and the effect of tDCS
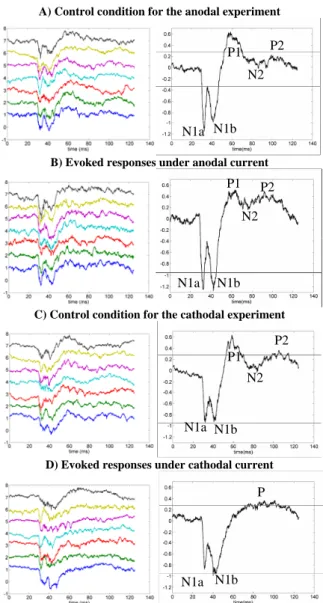
Figure 3 illustrates some single extracellular field potential responses and their averaged values in left and right panels, respectively. Each row of this figure corresponds to a different electrical stimulation trial. The evoked potentials in the first row (panel A) are related to a “no tDCS stimulation” condition. This is a control condition for the EPs recorded under anodal stimulation that are shown in panel B. To avoid corruption of the averaged EP by long-term effects that tDCS may have on brain function, we only considered the first seven field potential evoked responses after the application of the anodal current to calculate the averaged EP signal.
A) Control condition for the anodal experiment
B) Evoked responses under anodal current
C) Control condition for the cathodalexperiment
D) Evoked responses under cathodal current
Figure 3: single (left) and averaged (right) EPs recorded in the somatosensory cortex of the rabbit under control (A, C) and anodal (B) / cathodal (D) tDCS stimulation
N1a N1b P1 N2 P2 N1a N1b P1 N2 P2 N1a N1b P1 N2 P2 N1a N1b P
For the cathodal case, the results are shown in the same manner as in the anodal case. Panels C and D in figure 3 illustrate another set of EPs under “no tDCS stimulation” (i.e. control, C) and cathodal (D) current stimulation. The seven EPs that correspond to cathodal stimulation show the immediate effect of tDCS on brain activities. In another words, there is no delay between recording the EPs in control and cathodal current stimulation conditions.
LFPs in somatosensory cortex induced by air puff whisker pad stimulation consisted in a prominent negative potential that peaked at 4 ms (N1a) and 13 ms (N1b) followed by other minor negative peaks at different latencies (P1, N2, P2). During tDCS the LFP amplitude changed significantly with respect to control values. Anodal current induced an increase in the amplitude of the major negative potential (N1), whilst cathodal current induced an opposite effect. The first positive peak in control condition (P1) diminished a bit when a tDCS current (either anodal or cathodal) is applied on the brain. It seems that tDCS had also some effects on the late small-amplitude components of EPs (i.e., P1, N2 and P2 complex). Anodal stimulation had a slight effect on increasing the frequency of these late components, whilst cathodal current mainly decreased the frequency.
In summary, we identified the following effects as “major” effects of tDCS on EPs. For cathodal stimulation, we could observe 1) an enlargement (in time) of N1, 2) a decrease (in amplitude) of N1 (both N1a and N1b), 3) a merging of P1, N2 and P2 into a single low-frequency positive peak P. For anodal stimulation, effects are less prominent. We observed a significant increase of N1 (both N1a and N1b) and more oscillations flowing this peak.
3.2. Simulation of the evoked potential under “no tDCS stimulation” condition
In the computational model, the simulated LFP is obtained by summing average excitatory and inhibitory post-synaptic potentials (ePSP, iPSP) generated at the level of pyramidal cells. We expressed the simulated LFP in the model with a negative sign to match the polarity used in real data. We could find a set of parameters for which the model could reproduce the time-course of the actual LFP (i.e., EP) under the “no stimulation” condition. Note that most of the parameters of this set were chosen in “physiologically-plausible” range. This point is very important for rise and decay times in bi-exponential functions representing ePSP and iPSP. More particularly, the model could reproduce the observed peaks with the correct polarity and latency, as shown in figure 4. Since there was almost a 28 ms delay between the time that an air-puff is applied on whisker pad and the time that an EP is recorded on the rabbit cortex, we showed a delayed simulated EP (by 28 ms) in figure 4. From that point, the time at which the EP response is created is used at the reference time (t=0). Detailed analysis of the simulated EP revealed that the first major negative peak (N1) is generated in the model when the mean firing rate of pyramidal cells starts to increase in response to the excitatory sub-cortical input.
The activation of pyramidal cells then leads to increased excitation of both types of interneurons. When interneurons get excited by pyramidal cells, they in turn, increase their inhibitory effect on pyramidal cells. Increase of inhibitory effects on pyramidal cells leads appearance of the first positive peak P1 just after N1. The return to baseline and generation of P1, N2 and N2 complex is due to interplays between pyramidal cells and fast and slow interneurons (mainly slow interneurons) in the two negative feedback loops between pyramidal cells and interneurons.
Figure 4: an example of simulated EP under “control” (no tDCS stimulation) condition
As illustrated in figure 3 (real) and 4 (simulated), the first major negative peak includes two small peaks (N1a and N1b). N1a is a very sharp peak that reaches its maximum value after a 4 ms delay. N1b is a bit wider peak and reaches to it maximum at about 15 ms. The valley between these two peak, which is appeared at about t = 8 ms, is the result of an abrupt excessive inhibition on pyramidal cells. Indeed, in the model, we could produce this excessive amount of inhibitory inputs only by a forward mechanism. A feed-forward inhibitory mechanism is basically referred to inhibition of principal cells by those interneurons that have been excited by excitatory sub-cortical inputs. In the model, this feed-forward inhibition is mainly provided by type I interneurons. These interneurons are basically assumed to be large basket cells that are generally founded in deep layers of the cortex, and target soma of pyramidal cells. When these neurons are excited by subcortical inputs, they send a very fast inhibitory signal to pyramidal cells. This inhibitory signal reaches to pyramidal cells after a very short delay that pyramidal cells received their direct sub-cortical excitation. This is the model explanation for the appearance of the narrow N1a peak.
Appearance of N1b requires that the amount of excitation increases once more at the level of pyramidal cells. This was feasible in the model first because the decay-time of the iPSP function corresponding to type I interneurons is much longer than the decay-time of the ePSP function corresponding to pyramidal cells. The second reason is that type I interneurons receive an inhibitory signal from type I’ interneurons that have already been excited by sub-cortical afferents. When type I interneurons are inhibited by type I’ interneurons, they reduce their inhibitory effect on pyramidal cells and the result will be the appearance of N1b peak.
3.3. Simulation the effect of tDCS on the evoked potential
N1a N1b P1
N2 P2
Starting from the above “control” model configuration, we investigated the tDCS-related immediate effects on the various sub-populations included in the model (main pyramidal cells and interneurons). The objective was to search the parameters for which we could reproduce the main effects we identified from real data.
As described earlier in section 2.2.2, we represented the influence of tDCS as a perturbation on the mean membrane potential of the three neuronal populations in the model.
We first analysed which configuration of perturbations of neuronal populations may lead us to reproduce the main identified effects of tDCS on real EPs. As a matter of fact, we observed that if we only increase the mean membrane potential of pyramidal cells (without perturbation of interneurons), in accordance with our directional perturbation model, to a very good extent the effect of anodal currents can be observed on simulated EP. Indeed, we could identify that this type of perturbation (depolarizing) may basically increase a little bit the amplitude of N1 and increase the frequency of P1-N2-P2 complex. Although these modifications are in agreement with those modifications observed in figure 3B as direct influences of anodal currents on real EPs, we realized that the sole perturbation of pyramidal cells also increases the amplitude of P1 which is not the case for real EPs.
In order to get better results, in terms agreement between real and simulated EPs, we realized that we should also perturb mean membrane potentials of interneurons as well. We found out that if membrane potential of type I’ interneurons increases, they become more excitable. The effect of this increase of excitability is that they send a faster and a stronger inhibitory signal to pyramidal cells when they are excited either by subcortical inputs or by pyramidal cells during the formation of N1 peak. When type I’ interneurons send stronger inhibitory signals to pyramidal cells during the early phase of EP (t < 20 ms), pyramidal cells cannot easily excite interneurons to create a large-amplitude P1-N2-P2 complex.
On the other hand, an increase in the mean membrane potential of type I interneurons mainly affects the amplitude of early components of simulated EP. Indeed, when type 1, interneurons become more excitable, they send their fast GABAergic inhibitory effects very rapidly to pyramidal cells. This mainly influences the amplitude of N1 and controls the valley which exists between N1a and N1b peaks.
In brief, we observed that the best configuration for modifying mean membrane potentials of neuronal populations by which we could simulate the effect of anodal currents on EPs is to depolarize both pyramidal cells and slow type I’ interneurons, as well as, to hyperpolarize fast type I interneurons. Indeed, polarization of pyramidal cells and slow interneurons can simply fulfil the requirements to simulate the features that we identified in real anodal experiment (figure 3B), however hyperpolarization of type 1 interneurons could result in simulated EPs with more enhanced N1 peak.
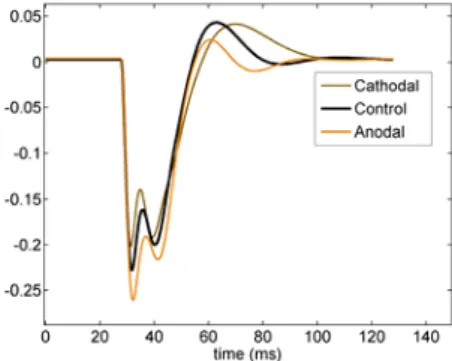
Figure 5 illustrates three EPs simulated in the model under cathodal, control and anodal conditions. Cathodal and anodal conditions have opposite effects on presumed polarities of neuronal populations. It means that for cathodal current, we hyperpolarized pyramidal cells and slow interneurons and polarized fast interneurons, and for anodal current we interchanged polarization and hyperpolarization of neuronal populations.
Figure 5: simulated EPs for control (black) and anodal (orange) and cathodal (brown) tDCS stimulation
In summary, our simulation results show that (i) the amplitude of first negative peak N1 increases/decreases with anodal/cathodal currents, (ii) bandwidths of N1 decreases/increases with anodal/cathodal currents, (iii) Frequency of different components of EPs increases/decreases with anodal/cathodal current, and (iv) P1 decreases with both anodal/cathodal currents.
4. Discussion and conclusion
In this study, we proposed a computational model aiming at (i) reproducing the EP that can be recorded in the rabbit somatosensory cortex in response to a stimulus (air-puff directed to whisker pad) and (ii) studying underlying brain mechanisms that generate this EP at the neuronal population level (mesoscopic). We then investigated the effects of anodal and cathodal tDCS by combining the analysis of EPs recorded in vivo with the computational modelling approach. In this study we focused on short-term (immediate) effects of tDCS on EPs. Therefore, we only analysed the few EPs that were recorded during the first 1.5 minutes just after the application of anodal or cathodal currents. The study of long-term effects is beyond the scope of this study and will probably require a detailed analysis of other model parameters (related to synaptic transmission, for instance).
Using the proposed model, we could reproduce, to a good extent, the time-course of the EP under the “no tDCS stimulation” condition, as well as, under tDCS stimulation conditions. We could notice a good matching between simulated and in real EPs regarding the polarities and the latencies of peaks and valleys. One of the interesting points we faced while developing the model was the necessity of the existence of a feed-forward inhibition for generating the two early narrow negative peaks observed in the EP (N1a and N1b). This result corroborates the fact that this type of inhibition has been reported to actually exist in the somatosensory cortex of several species. We also noticed that if the
inhibitory population which provides the feed-forward inhibition for pyramidal cells (here, type I interneurons) is not inhibited by the other inhibitory population, it will be very difficult to generate these two negative peaks (with the narrow valley between them).
The results we obtained from the study of the necessary and sufficient conditions according to which the effects of anodal and cathodal stimulation on EPs could be realistically simulated in the model were very interesting. We expected from previous work and checked that pyramidal cells should be depolarized in order to simulate the effects of anodal currents. We also found out that if interneurons are polarized then the characteristics of simulated EPs become closer to those of real EPs, indicating the modelling efforts need to consider the role of these less understood neuron types. We noticed that there exists a relation between the best configuration according to which we perturb membrane potentials of neuronal populations to get the best results in the model, on the one hand and the geometrical properties of these neuronal populations in the brain, on the other hand. Indeed, we could observe, in the model, that pyramidal cells constitute the neuronal sub-population that is affected the most by tDCS.
Pyramidal cells should be depolarized so that we can simulate the effect of anodal currents on EPs and hyperpolarized so that we can simulate the effect of cathodal currents. These findings are consistent with biophysical arguments. Any current that is injected from scalp electrodes will produce an electric field component along the somato-dendritic axis of pyramidal cells. Depending on the orientation of this field component, it can be shown that the resulting effect is either a de- or a hyper-polarization of the cells. In addition, it can be shown as we discussed that this effect is “amplified” when cells are geometrically aligned (which is typically the case of pyramidal cells). Indeed, it is well admitted that these cells are not randomly aligned but organized in “palisades” with dendritic trees oriented orthogonally with respect to the cortical surface.
Surprisingly, results also revealed that the externally-applied field is also likely to affect interneurons. This is an important - still unsolved - issue that is often addressed in studies related to the effects of weak fields on the brain. In the model, we noticed that the polarization of the interneuronal sub-populations increases the quality of results in terms of fitting actual EPs under stimulation conditions. A possible explanation can also be related to geometrical considerations. Our literature review revealed that not all types of interneurons have symmetrical dendritic structures. Some types of interneurons such as large basket cells, bitufted cells and bi-polar cells have oriented dendritic trees [5, 6]. For example bitufted cells usually have a dense dendritic structure with lots of aligned branches in the upper side of the soma [7], or large basket cells have some parallel long dendrites directing toward white matter [5, 6]. These oriented structures of denritic targeting slow-interneurons or somatic targeting fast-interneurons could be an explanation for the fact that the perturbation of slow and/or fast interneurons in the computational model
lead to better results. However, we should mention that determining that an anodal or cathodal current has a depolarizing or hyperpolarizing effect on the soma membrane cannot be easily performed by just looking at the shape/direction of dendritic trees. Beside orientation of dendrites, some other factors such as number of branches and synapses on each side of the cell and diameter and resistivity of branches are some other important factors that determine the membrane response to an externally-applied electric field. The study of such factors would require the developement of a detailed model (cell level), a likely research topic for the future.
Acknowledgements
The project HIVE acknowledges the financial support of the Future and Emerging Technologies (FET) programme within the Seventh Framework Programme for Research of the European Commission, under FET-Open grant number: 222079 (http://hive-eu.org/).
References
1. Nitsche, M.A., et al., Treatment of depression with transcranial direct current stimulation (tDCS): a review. Exp Neurol, 2009. 219(1): p. 14-9.
2. Bindman, L.J., O.C. Lippold, and J.W. Redfearn, The Action of Brief Polarizing Currents on the Cerebral Cortex of the Rat (1) During Current Flow and (2) in the Production of Long-Lasting after-Effects. J Physiol, 1964. 172: p. 369-82. 3. Bikson, M., et al., Effects of uniform extracellular
DC electric fields on excitability in rat hippocampal slices in vitro. J Physiol, 2004. 557(Pt 1): p. 175-90.
4. Molaee-Ardekani, B., et al., Computational modeling of high-frequency oscillations at the onset of neocortical partial seizures: From 'altered structure' to 'dysfunction'. Neuroimage, 2010.
52(3): p. 1109-1122.
5. Gupta, A., Y. Wang, and H. Markram, Organizing principles for a diversity of GABAergic interneurons and synapses in the neocortex. Science, 2000. 287(5451): p. 273-8.
6. Markram, H., et al., Interneurons of the neocortical inhibitory system. Nat Rev Neurosci, 2004. 5(10): p. 793-807.
7. Ekstrand, J.J., et al., Immunocytochemical analysis of basket cells in rat piriform cortex. J Comp Neurol, 2001. 434(3): p. 308-28.
9. Ruffini G (Ed) Review of the state of the art in current distribution and effects, HIVE Deliverable D1.1., 2009. Available at http://hive-eu.org.
10. Suffczynski P, Kalitzin S, da Silva FL, Parra J,
Velis D, Wendling F, Active paradigms of seizure anticipation: computer model evidence for necessity of stimulation. Phys Rev E Stat Nonlin Soft Matter Phys. 2008 Nov;78(5 Pt 1):051917