HAL Id: hal-02006936
https://hal.archives-ouvertes.fr/hal-02006936
Submitted on 5 Feb 2019
HAL is a multi-disciplinary open access
archive for the deposit and dissemination of
sci-entific research documents, whether they are
pub-lished or not. The documents may come from
teaching and research institutions in France or
abroad, or from public or private research centers.
L’archive ouverte pluridisciplinaire HAL, est
destinée au dépôt et à la diffusion de documents
scientifiques de niveau recherche, publiés ou non,
émanant des établissements d’enseignement et de
recherche français ou étrangers, des laboratoires
publics ou privés.
Adaptation to Vocal Expressions Reveals Multistep
Perception of Auditory Emotion
Patricia Bestelmeyer, Pierre Maurage, Julien Rouger, Marianne Latinus,
Pascal Belin
To cite this version:
Patricia Bestelmeyer, Pierre Maurage, Julien Rouger, Marianne Latinus, Pascal Belin. Adaptation to
Vocal Expressions Reveals Multistep Perception of Auditory Emotion. Journal of Neuroscience,
Soci-ety for Neuroscience, 2014, 34 (24), pp.8098-8105. �10.1523/jneurosci.4820-13.2014�. �hal-02006936�
Behavioral/Cognitive
Adaptation to Vocal Expressions Reveals Multistep
Perception of Auditory Emotion
Patricia E. G. Bestelmeyer,
1Pierre Maurage,
2Julien Rouger,
3Marianne Latinus,
4and Pascal Belin
4,5,61School of Psychology, Bangor University, Bangor, Gwynedd LL57 2AS, United Kingdom,2Cognitive Neurosciences and Clinical Psychology Research Units, Department of Psychology, Catholic University of Louvain, 1348 Louvain-la-Neuve, Belgium,3Department of Cognitive Neuroscience, University of Maastricht, 6200 MD, Maastricht, The Netherlands,4Institut de Neurosciences de La Timone, Unite´ Mixte de Recherche 7289, Aix-Marseille Universite´, Centre National de la Recherche Scientifique, 13385 Marseille, France,5Institute of Neuroscience and Psychology, University of Glasgow, Glasgow G12 8QB, United Kingdom, and6International Laboratory for Brain, Music and Sound Research, University of Montre´al/McGill University, Montre´al H3C 3J7, Canada
The human voice carries speech as well as important nonlinguistic signals that influence our social interactions. Among these cues that
impact our behavior and communication with other people is the perceived emotional state of the speaker. A theoretical framework for
the neural processing stages of emotional prosody has suggested that auditory emotion is perceived in multiple steps (
Schirmer and Kotz,
2006
) involving low-level auditory analysis and integration of the acoustic information followed by higher-level cognition. Empirical
evidence for this multistep processing chain, however, is still sparse. We examined this question using functional magnetic resonance
imaging and a continuous carry-over design (
Aguirre, 2007
) to measure brain activity while volunteers listened to non-speech-affective
vocalizations morphed on a continuum between anger and fear. Analyses dissociated neuronal adaptation effects induced by similarity
in perceived emotional content between consecutive stimuli from those induced by their acoustic similarity. We found that bilateral
voice-sensitive auditory regions as well as right amygdala coded the physical difference between consecutive stimuli. In contrast, activity
in bilateral anterior insulae, medial superior frontal cortex, precuneus, and subcortical regions such as bilateral hippocampi depended
predominantly on the perceptual difference between morphs. Our results suggest that the processing of vocal affect recognition is a
multistep process involving largely distinct neural networks. Amygdala and auditory areas predominantly code emotion-related acoustic
information while more anterior insular and prefrontal regions respond to the abstract, cognitive representation of vocal affect.
Key words: fMRI; vocal emotion; voice perception
Introduction
Voices convey an array of social information such as the
gen-der, identity, and emotional state of the speaker. Amplitude,
fundamental frequency, and voice smoothness are only some
of the variables that convey emotion by physiological changes
in the vocal production system (
Patel et al., 2011
). Perceiving
these acoustic cues as a complex message that communicates
emotions or intentions even in the absence of speech is crucial for
everyday social interactions (
Wallbott and Scherer, 1986
).
Re-search on auditory affect perception has concentrated on the
perception of speech prosody with a neuroscientific model
pro-posing the anatomical underpinnings that are involved
(
Schirmer and Kotz, 2006
). The first stage of this model consists
of low-level acoustic analyses in bilateral auditory cortices. These
areas then project to superior temporal sulci (STSs) and superior
temporal gyri (STGs) for more complex processing in which
emotionally salient information is synthesized into an emotional
“Gestalt” or acoustic object. The STS and STG then feed into
frontal areas for higher-order cognition (e.g., evaluative
judg-ments of prosody). This model provides an analytical first step
toward understanding the network involved, but more research
is necessary to test its predictions and expand it to the perception
of other emotional auditory objects.
We were interested in examining the neural processing stages
of vocal affect perception using a specific type of adaptation
par-adigm. Behaviorally, adaptation refers to a process during which
continued stimulation results in biased perception toward
oppo-site features of the adaptor (
Grill-Spector et al., 1999
). These
aftereffects have been demonstrated behaviorally for vocal affect
perception (
Bestelmeyer et al., 2010
;
Skuk and Schweinberger,
2013
). Neurally, fMRI adaptation to a specific stimulus feature is
typically accompanied by a decrease in the hemodynamic
re-sponse (also referred to as repetition suppression). Adaptation
paradigms are often used to reveal neural populations tuned to
the processing of a specific stimulus attribute (i.e., to reveal
func-Received Nov. 16, 2013; revised April 15, 2014; accepted April 23, 2014.
Author contributions: P.E.G.B. and P.B. designed research; P.E.G.B. and P.M. performed research; J.R., M.L., and P.B. contributed unpublished reagents/analytic tools; P.E.G.B. analyzed data; P.E.G.B. wrote the paper.
This research was supported by Economic and Social Research Council/Medical Research Council Grant RES-060-25-0010.
The authors declare no competing financial interests.
This article is freely available online through the J Neurosci Author Open Choice option.
Correspondence should be addressed to Dr. Patricia E.G. Bestelmeyer, School of Psychology, Bangor University, Gwynedd LL57 2AS, UK. E-mail: [email protected].
DOI:10.1523/JNEUROSCI.4820-13.2014 Copyright © 2014 Bestelmeyer et al.
This is an Open Access article distributed under the terms of the Creative Commons Attribution License (http://creativecommons.org/licenses/by/3.0), which permits unrestricted use, distribution and reproduction in any medium provided that the original work is properly attributed.
tional specificity of neural populations). Continuous carry-over
designs present an unbroken stream of serially balanced stimuli,
thereby allowing the evaluation of adaptation or “carry-over”
effects between subsequent stimuli (
Aguirre, 2007
).
We created morph continua between angry and fearful
vocal-izations (
Bestelmeyer et al., 2010
). Carry-over effects between
consecutive stimuli were assessed by calculating physical and
per-ceptual differences between morphs in the stimulus sequence and
entering these values as regressors in a general linear model. The
“physical difference” regressor consisted of the absolute
differ-ence in morph step between a given stimulus and the preceding
one, directly proportional to the acoustic difference. The
“per-ceptual difference” regressor consisted of the absolute difference
in proportion of fear responses between stimuli and was
orthogo-nalized with respect to the “physical regressor” in the design
ma-trix. This design allowed us to examine adaptation effects
induced by perceived emotion after variance accounted for by
acoustic differences had been explained. We hypothesized that
carry-over effects to the physical properties would be evident in
voice-sensitive areas with a lateralization toward the right (
Belin
et al., 2000
;
Lewis et al., 2009
;
Bestelmeyer et al., 2011
). In
con-trast, we expected the cognitive representations of emotion to
engage separate, higher-level areas involving frontal cortices.
Materials and Methods
Participants. Nineteen healthy volunteers from the under- and postgrad-uate community of the University of Glasgow took part (13 females, mean age⫽ 22.63, range ⫽ 18–32 years, SD ⫽ 3.96). All participants were of normal hearing (according to a brief audiometric test) and were reimbursed £12 for their time. Informed consent was obtained from all individuals and the study protocol was approved by the local ethics committee.
Experimental stimuli and fMRI paradigm. Recordings were taken from the Montreal Affective Voices (Belin et al., 2008) in which actors were instructed to produce emotional interjections using the vowel /a/. The voices from six identities (three female) expressed anger and fear. Angry to fearful continua were created separately for each identity in seven steps that corresponded to (fear/anger) 5/95%, 20/80%, 35/65%, 50/50%, 65/ 35%, 80/20% and 95/5%. The duration of the vocalizations within each continuum was kept constant and ranged between 0.6 and 0.9 s across continua. We used STRAIGHT for stimulus generation (Kawahara and Matsui, 2003; for more information, see also http://www.wakayama-u. ac.jp/⬃kawahara/STRAIGHTadv/index_e.html). STRAIGHT performs an instantaneous pitch-adaptive spectral smoothing of each stimulus for separation of contributions to the voice signal arising from the glottal source [including the perceived pitch of the voice (f0)] versus suprala-ryngeal filtering [distribution of spectral peaks, including the first for-mant frequency (F1)]. Voice stimuli were decomposed by STRAIGHT into the following five parameters: f0, frequency, duration, spectrotem-poral density, and aperiodicity. Each parameter can be manipulated in-dependently. For each voice, we manually identified one time landmark with three frequency landmarks (corresponding to the first three for-mants) at the onset of phonation and the same number of landmarks at the offset of phonation. Morphed stimuli were then generated by resyn-thesis based on the interpolation (linear for time; logarithmic for F0, frequency, and amplitude) of these time–frequency landmark templates (for a recent discussion of the voice morphing technique, see also Schweinberger et al., 2014). Stimuli were normalized in energy (root mean square) before and after morphing. Acoustic analyses to illustrate the validity of the morphing technique with affective bursts have been published previously (Bestelmeyer et al., 2010). We used Psychtoolbox-3 (Brainard, 1997;Pelli, 1997) for stimulus presentation and response re-cording. Both programs were run in MatlabR2007b (MathWorks).
We used a continuous carry-over design (Aguirre, 2007) to measure the effects of one stimulus upon the next using a first-order serially balanced sequence of stimuli known as type-1-index-1 (Nonyane and
Theobald, 2007). Our carry-over sequence was defined by eight items: the seven morph steps of a continuum (always within identity) plus one silent null event. One complete carry-over sequence with eight items comprises 65 stimuli. In this balanced sequence, each stimulus is pre-ceded and followed by every other stimulus an equal number of times. Thus, every item is repeated eight times per sequence (except for the first item, which is repeated nine times; for a sample sequence of eight items, see http://www.bioss.ac.uk/people/cmt/seqlist.html#08). The end of each carry-over sequence was followed by nine TRs of silences (18 s) before the start of the next carry-over sequence. Each of our six identities was presented once per run, leading to six different carry-over sequences and totaling 390 stimuli per run. Gender was blocked so that an experi-mental run started with three male carry-over sequences followed by three female carry-over sequences or vice versa. We acquired three ex-perimental fMRI runs.
Sounds were presented binaurally using the electrostatic NNL head-phone system (NordicNeuroLab) at an intensity of 80 dB SPL(C). Par-ticipants were asked to perform a two-alternative forced choice task in which each affective voice had to be categorized as either angry or fearful by means of two buttons mounted on an MRI-compatible response box (fORP, Current Designs). Participants were asked to react as fast as pos-sible and to keep their eyes closed for the duration of all scans. For each participant, the behavioral responses were used to compute the percep-tual difference regressor, which was then fed into the parametric modu-lation analyses. Following this procedure, we administered a short “voice localizer” scan (for details, seeBelin et al., 2000) to localize areas that are particularly sensitive to voices compared with other, environmental sounds.
Image acquisition and analysis. All scans were acquired in a 3.0 tesla Siemens Tim Trio scanner using a 12-channel head coil. Whole-brain T1-weighted anatomical scans were performed using fast gradient echo known as T1 magnetization-prepared rapid acquisition gradient echo, consisting of 192 axial slices of 1 mm thickness with an in-plane resolu-tion of 1⫻ 1 ⫻ 1 [field of view (FOV) ⫽ 256°] and a matrix of 256 ⫻ 256 performed at the end of the experimental session. T2*-weighted func-tional scans were acquired using an interleaved ascending sequence con-sisting of 32 slices of 3 mm thickness (0.3 mm gap) with an in-plane resolution of 3⫻ 3 ⫻ 3 (FOV ⫽ 1260°), an acquisition matrix of 70 ⫻ 70, and a flip angle of 77°. The three runs of the experimental scan (TR⫽ 2 s, TE⫽ 30 ms) consisted of 446 volumes each, while the voice localizer (TR⫽ 2 s; TE ⫽ 30 ms) scan consisted of one run of 310 volumes and allows reliable identification of the temporal voice areas by contrasting vocal with nonvocal sounds.
All MRI data were analyzed using SPM8 (Wellcome Department of Cognitive Neurology, University College London, http://www.fil.ion. ucl.ac.uk/spm/). Preprocessing of the data consisted of anterior commis-sure–posterior commissure alignment of the anatomical images (and application of the orientation change to all functional images acquired in the same session). Functional scans were corrected for head motion (tri-linear interpolation) by aligning all scans to the first scan of the last run, and a mean image was created. The anatomical scan was coregistered to the mean image. Functional and anatomical data were transformed to Montreal Neurological Institute space after segmentation of the anatom-ical scan. Normalized data were spatially smoothed by applying a Gauss-ian kernel of 8 mm full-width at half-maximum.
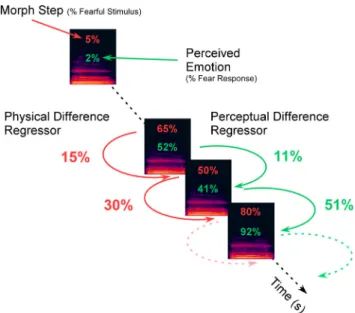
We used parametric modulations to analyze our data (Bu¨chel et al., 1998). We linearly rescaled the parametric variables so that all measure-ments were on a comparable scale lying between 0 and 1 using the ‘‘Min-Max” normalization. This transformation preserves the relationships among the original data values and ensures that the regressors have equivalent weights. For each auditory stimulus (except the first sound in each carry-over sequence), we calculated the physical and perceptual differences between it and the preceding stimulus (Fig. 1). The design matrix of first-level analyses contained all voice onset events as the first regressor which was followed by four parametric regressors, as follows: (1) “first voice” of each block (to remove the effect of a stimulus follow-ing baseline); (2) “morph step” (i.e., the percentage of fearfulness con-tained in the voice); (3) physical difference, which was computed as the absolute difference in morph step between two consecutive stimuli; and Bestelmeyer et al.• Multistep Perception of Vocal Affect J. Neurosci., June 11, 2014•34(24):8098 – 8105 • 8099
(4) perceptual difference, which was calculated in the same way as regres-sor 2 but was based on the participant’s behavioral responses (Fig. 2; Aguirre, 2007;Charest et al., 2013). Thus, for the perceptual difference regressor of each run, we calculated the mean behavioral response to each morph step and then calculated the absolute difference in mean sponses between two consecutive stimuli. The perceptual difference re-gressor was therefore based on the participant’s own subjective judgments of the affective morphs.Figure 1illustrates how the regressors for the physical difference (red) and perceptual difference (green) were calculated.
Note that each of the four parametric regressors was orthogonalized (i.e., rendering collinear regressors linearly independent) with respect to the previous ones to account only for variance not explained by previous regressors. We also included the silent null events presented within the carry-over sequences and six movement parameters in our model. Second-level analysis of the morph step and physical difference regres-sors consisted of one-sample t tests for each regressor, allowing for the evaluation of positive and negative correlations. The analysis of the
per-ceptual difference regressor consisted of an F test across linear and qua-dratic contrasts in a full-factorial ANOVA with two levels (level 1: T-contrast images from the linear expansion; level 2: T-contrast images from the quadratic expansion). To illustrate the parametric modulations inFigures 3and4, we used the built-in function of SPM8 (spm_graph.m) to extract the estimates at the peak maxima within a sphere of 6 mm. Figure 1. Illustration of the calculation of the physical (red) and perceptual (green)
differ-ence regressors. The physical differdiffer-ence regressor is calculated based on the absolute differdiffer-ence in morph step between two consecutively presented stimuli. Similarly, the perceptual differ-ence regressor is calculated based on the absolute differdiffer-ence in the averaged participant’s behavioral responses (two alternative forced choice responses) to each morph step between two consecutively presented stimuli.
Figure 2. A, Results of the emotion categorization task. B, Reaction time as a function of
morph step. Error bars represent the SEM.
Figure 3. Activation maps of significant correlations between the physical difference be-tween consecutive stimuli and BOLD signal illustrated on a T1-weighted average structural template. Positive correlations (i.e., increased neuronal adaptation for more similar consecutive stimuli) are evident in areas that overlap with bilateral voice-sensitive cortex (shown in blue) and right amygdala (see also associated plots of parameter estimates in the peak voxels of these clusters).
Figure 4. Activation maps of significant correlations between perceptual difference be-tween morph steps and BOLD signal illustrated on a T1-weighted average structural template. The F-contrast combines linear and quadratic expansions of the perceptual regressor. Signifi-cant negative quadratic relationships are evident in bilateral insulae, mid-cingulum, medial orbitofrontal and superior frontal gyri, as well as bilateral precentral gyri. A positive quadratic relationship was obtained in bilateral precuneus.
Unlike the physical difference, behavioral responses did not average to discrete steps but, rather, resulted in a range of numbers. Therefore, to account for the interindividual variability of behavioral responses and to allow the averaging across participants, we grouped averaged behavioral responses into five bins of 20%. Results are illustrated on an average anatomical scan using MRIcron (Rorden et al., 2007). Anatomical cluster location was assessed with xjview version 8.1 (http://www.alivelearn. net/xjview) and cross-checked with the brain atlas ofDuvernoy (1999)to ensure accuracy.
Our two regressors of interest (physical and perceptual difference) are not naturally orthogonal. Given our design, the physical regressor, en-tered before the perceptual regressor, may therefore contain variance that is shared by both regressors (i.e., variance that is neither purely physical nor purely perceptual). We therefore computed two further “single” models for each participant, as follows: (1) a model with the physical regressor but without the perceptual regressor; and (2) a model with the perceptual regressor but without the physical regressor. These models were otherwise identical to the one reported above.
Results
Behavioral results
Results of the behavioral data are summarized in
Figure 2
. The
re-sponse data were averaged as a function of the seven morph steps,
and a psychophysical curve (based on the hyperbolic tangent
func-tion) was fitted to the mean data (
Fig. 2
A; see also
Bestelmeyer et al.
(2010)
for an identical pattern obtained without scanner noise).
Par-ticipants more frequently categorized the first three morph steps
as anger and the last three morph steps as fear, while the 50%
morph was perceived as the most emotionally ambiguous.
Re-action times were lowest for the least ambiguous stimuli and
highest for the 50% morph with
⬎150 ms difference between
extreme versus central points of the continuum (
Fig. 2
B).
fMRI results
We used parametric modulation analyses to investigate areas that
respond to a modulation of the morph step, physical difference,
and then perceptual difference from a combined general linear
model (see ( A) and ( B), below). All results are illustrated at a
threshold of p
⬍ 0.0001 (uncorrrcted) and an extent threshold of
30 voxels. Unless stated otherwise, statistical significance was
as-sessed at the cluster level with a threshold of p
⬍ 0.05 and was
FWE corrected for multiple comparisons across the whole brain.
No significant modulations with morph step were observed (i.e.,
no brain area reacted more to anger than to fear and vice versa).
(A) Carry-over effect of the physical difference between
consecutive morphs
Parametric modulation analysis of the physical difference
regres-sors showed significant positive correlations between physical
difference and BOLD signal in bilateral superior/midtemporal
gyri (right: t
(18)⫽ 8.35, k ⫽ 491; left: t
(18)⫽ 7.52, k ⫽ 161), right
amygdala (t
(18)⫽ 5.90, k ⫽ 32) and a small cluster covering
mid-cingulum (t
(18)⫽ 6.27, k ⫽ 36). This neuronal adaptation is
illustrated in
Figure 3
, and significant clusters are summarized in
Table 1
. In these regions, activity was greater in response to
uli that were more acoustically different from the preceding
stim-ulus (larger morph step difference).
(B) Carry-over effect of the perceptual difference between
consecutive morphs
The perceptual difference between morphs was based on the
ab-solute difference between averaged proportions of fear responses
to each morph (not averaged across the group but specific to each
participant) and was included as an orthogonalized regressor,
after variance explained by physical differences between stimuli
had been accounted for. The adaptation framework predicts a
(typically linear) decrease in BOLD signal with stimulus
repeti-tion. However, previous research has shown quadratic
relation-ships between perceptual differences and BOLD signal (
Charest
et al., 2013
). We therefore included linear and quadratic
expan-sions of the perceptual difference regressor. To test for a
signifi-cant effect of modulations in perceptual difference, we calculated
an F-contrast to combine linear and quadratic expansions of this
regressor. This analysis revealed significant negative quadratic
relationships in bilateral anterior insulae with inferior frontal gyri
(IFGs; right: F
(2,36)⫽ 28.78, k ⫽ 169; left: F
(2,36)⫽ 38.80, k ⫽
153), bilateral precentral gyri (right: F
(2,36)⫽ 25.28, k ⫽ 240; left:
F
(2,36)⫽ 37.75, k ⫽ 336), bilateral middle temporal gyrus (MTG),
superior temporal gyrus (STG; right STG: F
(2,36)⫽ 21.52, k ⫽ 75;
left STG: F
(2,36)⫽ 25.34, k ⫽ 131; left MTG: F
(2,36)⫽ 23.73, k ⫽
241), supplementary motor area/mid-cingulum (F
(2,36)⫽ 32.90,
k
⫽ 205), left superior frontal region (F
(2,36)⫽ 25.20, k ⫽ 66), left
medial superior frontal (F
(2,36)⫽ 19.40; k ⫽ 98), right lingual
(F
(2,36)⫽ 20.21, k ⫽ 83), and a positive quadratic relationship in
a cluster covering bilateral precuneus (F
(2,36)⫽ 32.44, k ⫽ 516).
At a more lenient threshold of p
⬍ 0.001 (uncorrected), using
small-volume corrections (6 mm), a number of subcortical
struc-tures survived FEW correction at the peak level (i.e., clusters
covering bilateral hippocampi and amygdalae; right: F
(2,36)⫽
20.51, k
⫽ 19, MNI coordinates ⫽ 24 ⫺4 ⫺23; left: F
(2,36)⫽
14.09, k
⫽ 20, MNI coordinates ⫽ ⫺24 ⫺7 ⫺20) and thalami
(right: F
(2,36)⫽ 16.38, k ⫽ 29, MNI coordinates ⫽ 12 ⫺19 4; left:
F
(2,36)⫽ 17.02, k ⫽ 28, MNI coordinates ⫽ ⫺12 ⫺16 4).
Figure 3
illustrates significant clusters and illustrations of the parameter
estimates in bilateral anterior insulae, mid-cingulum, and
precu-neus. Significant clusters are summarized in
Table 1
.
We then computed parametric modulation analyses of two
single general linear models (reported in ( C), below) to address
whether regions dealing with physical and perceptual differences
of vocal expressions involve partially overlapping regions.
(C) Overlap between the carry-over effect for the physical and
perceptual difference from the two single models
Parametric modulation analyses of the two single models (either
with the physical but not the perceptual regressor or vice versa)
showed very similar patterns of activations to our combined
model reported above. The analyses confirm that while the two
steps necessary for the acoustic and perceptual processing of
vo-cal emotion are largely distinct, there is some overlap between the
two processes in right midtemporal and left superior temporal
gyrus and left putamen (
Fig. 5
). Significant clusters of both single
models are summarized in
Table 2
.
Discussion
We were interested in disentangling the different regions of the
vocal emotion network that process acoustic differences between
emotional vocalizations from regions that deal with the cognition
and evaluation of vocally expressed emotions by using a new
adaptation design (
Aguirre, 2007
). We morphed nonverbal
ex-pressions on a continuum between anger and fear, and presented
the stimuli in a continuous and balanced sequence (
Nonyane and
Theobald, 2007
). We found linear neuronal adaptation effects in
response to the physical difference between two consecutively
presented voice morphs in bilateral voice-sensitive cortices (
Belin
and Zatorre, 2000
;
Lewis et al., 2009
;
Bestelmeyer et al., 2011
)
with larger activations in the right hemisphere, and right
amygdala. In response to the perceived difference between
stim-uli, we found repetition effects in more widespread regions
cluding bilateral anterior insulae, precentral gyri, and medial
superior frontal areas, as well as amygdalae, hippocampi, and
thalami at a more lenient threshold. Our study provides support
for the key concept described in
Schirmer and Kotz (2006)
of
multistep processes involved in the coding of auditory emotion
but also highlights the unpredicted complexity of the network
necessary for the evaluative judgments of affective vocalizations,
even in the absence of speech.
Schirmer and Kotz (2006)
propose a hierarchical model for
the processing of emotional prosody (for a multimodal version,
see also
Wildgruber et al. (2009)
;
Bru¨ck et al. (2011)
). This model
consists of three steps starting with a low-level acoustic analysis in
bilateral auditory cortices followed by mid-level analyses in
bilat-eral STS/STG, which synthesize emotionally salient information
into an acoustic object. Finally, STS/STG then feed into frontal
areas for higher-order cognition and evaluation. Most of the
neu-roimaging studies cited in support of the model used subtraction
designs, which make a demonstration of the existence of separate
steps and differential functions of STS/STG and IFGs difficult.
Importantly, also, these studies do not typically differentiate
ac-tivity patterns that process general physical differences between
stimuli from those that process more abstract emotional
infor-mation independent of lower-level acoustic changes. To our
knowledge, only one study (
Wiethoff et al., 2008
) has used
mul-tiple regression to demonstrate that the passive-listening
re-sponse to emotionally spoken words in the right mid-STG could
be explained only by a combination of various acoustic
parame-ters, but the study did not elucidate the areas responsible for the
higher-level representation of emotion.
The continuous carry-over design allowed us to isolate the
neural processes engaged in lower-level stages dealing with
phys-ical differences between sounds from higher-level stages involved
in vocal affect cognition. Thus, we first computed correlations
between the BOLD signal and the physical difference between
morphs. Right amygdala as well as bilateral STS/STG, which
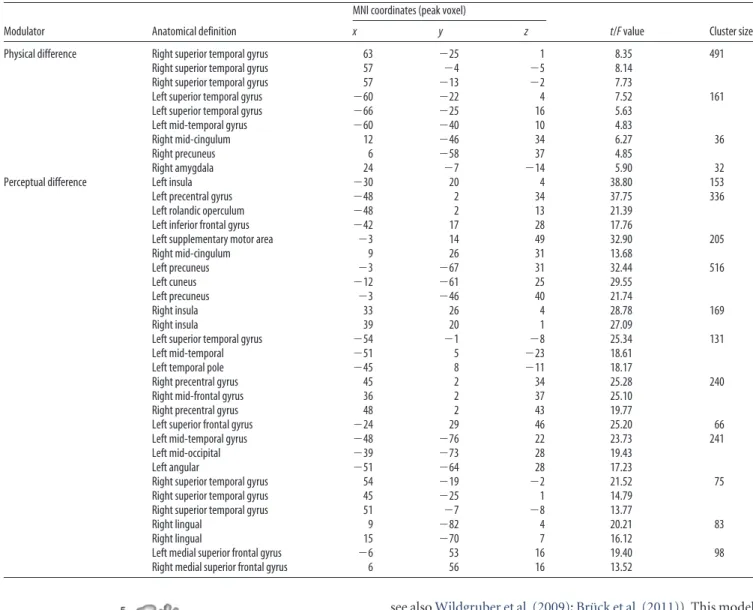
Table 1. Areas revealing significant modulations with physical and perceptual difference
Modulator Anatomical definition
MNI coordinates (peak voxel)
t/F value Cluster size
x y z
Physical difference Right superior temporal gyrus 63 ⫺25 1 8.35 491 Right superior temporal gyrus 57 ⫺4 ⫺5 8.14
Right superior temporal gyrus 57 ⫺13 ⫺2 7.73
Left superior temporal gyrus ⫺60 ⫺22 4 7.52 161 Left superior temporal gyrus ⫺66 ⫺25 16 5.63
Left mid-temporal gyrus ⫺60 ⫺40 10 4.83
Right mid-cingulum 12 ⫺46 34 6.27 36
Right precuneus 6 ⫺58 37 4.85
Right amygdala 24 ⫺7 ⫺14 5.90 32
Perceptual difference Left insula ⫺30 20 4 38.80 153
Left precentral gyrus ⫺48 2 34 37.75 336
Left rolandic operculum ⫺48 2 13 21.39 Left inferior frontal gyrus ⫺42 17 28 17.76
Left supplementary motor area ⫺3 14 49 32.90 205
Right mid-cingulum 9 26 31 13.68 Left precuneus ⫺3 ⫺67 31 32.44 516 Left cuneus ⫺12 ⫺61 25 29.55 Left precuneus ⫺3 ⫺46 40 21.74 Right insula 33 26 4 28.78 169 Right insula 39 20 1 27.09
Left superior temporal gyrus ⫺54 ⫺1 ⫺8 25.34 131
Left mid-temporal ⫺51 5 ⫺23 18.61
Left temporal pole ⫺45 8 ⫺11 18.17
Right precentral gyrus 45 2 34 25.28 240
Right mid-frontal gyrus 36 2 37 25.10
Right precentral gyrus 48 2 43 19.77
Left superior frontal gyrus ⫺24 29 46 25.20 66
Left mid-temporal gyrus ⫺48 ⫺76 22 23.73 241
Left mid-occipital ⫺39 ⫺73 28 19.43
Left angular ⫺51 ⫺64 28 17.23
Right superior temporal gyrus 54 ⫺19 ⫺2 21.52 75 Right superior temporal gyrus 45 ⫺25 1 14.79
Right superior temporal gyrus 51 ⫺7 ⫺8 13.77
Right lingual 9 ⫺82 4 20.21 83
Right lingual 15 ⫺70 7 16.12
Left medial superior frontal gyrus ⫺6 53 16 19.40 98 Right medial superior frontal gyrus 6 56 16 13.52
Figure 5. Overlap of the activation maps of significant correlations for physical (red-yellow) and perceptual (blue-green) difference regressors from the “single” models illustrated on a T1-weighted average structural template.
overlapped with voice-sensitive regions, correlated positively
with an increased difference in physical properties between
con-secutive stimuli (for similar results with different task and design,
see also
Fru¨hholz et al. (2012)
). The bilateral correlation in
voice-sensitive cortex was lateralized to the right, confirming previous
neuropsychological studies (
Van Lancker and Sidtis, 1992
;
Hor-nak et al., 1996
;
Shamay-Tsoory et al., 2004
;
Ross and Monnot,
2008
) and neuroimaging studies (
Imaizumi et al., 1997
;
Morris et
al., 1999
;
Buchanan et al., 2000
;
Ra¨ma¨ et al., 2001
;
Wildgruber et
al., 2002
;
Mitchell et al., 2003
;
Grandjean et al., 2005
;
Wildgruber
et al., 2005
;
Ethofer et al., 2006
,
2009a
,
b
;
Leitman et al., 2010
;
Ethofer et al., 2012
; for a recent meta-analysis, see
Witteman et
al., 2012
) that provide support for the importance of these
re-gions in the perception of emotional prosody. While STS/STG
are classically highlighted in studies on affective prosody
percep-tion, they do not seem to be specific to the processing of auditory
emotion, as activations in these areas have been reported for the
perception of identity (
Andics et al., 2010
;
Latinus et al., 2011
,
2013
), gender (
Charest et al., 2013
), and attractiveness
(
Bestelmeyer et al., 2012
). Research on auditory object
percep-tion suggests that while subregions of the STG/STS may be
spe-cific to certain sound categories, these activations may not as such
be indicative of representations of the semantic category but
in-stead of a shared acoustic profile common to a particular group of
auditory objects (e.g., vocalizations, musical instruments;
Lewis
et al. (2009)
;
Leaver and Rauschecker, 2010
). Thus, bilateral STS/
STG may be related to acoustic feature extraction of
paralinguis-tic information more generally.
Second, to reveal the higher-level processes involved in vocal
affect cognition, we computed correlations between the
percep-tual difference regressor (using an individual’s behavioral data)
and BOLD signal after the variance explained by the physical
difference regressor had been explained. We found negative
qua-dratic correlations in bilateral insulae (with IFG), mid-cingulum,
superior frontal gyrus, and precentral gyrus, and a positive
cor-relation in bilateral precuneus. The involvement of anterior
in-sulae has frequently been reported in the perception of a variety
of emotional, multimodal stimuli and experimental tasks (
Du-erden et al., 2013
), emphasizing its importance in the processing
and possible integration of emotional information from various
senses. A recent review (
Craig, 2009
) reveals that the response of
the anterior insulae is not specific to emotion because an
as-tonishing number of studies covering a range of topics (e.g.,
emotional awareness, error awareness, and attention to pain)
Table 2. Areas revealing significant modulations with physical and perceptual difference from the single models
Modulator Anatomical definition
MNI coordinates (peak voxel)
t/F value Cluster size
x y z
Single physical difference Right superior temporal gyrus 63 ⫺25 1 8.58 511 Right superior temporal gyrus 57 ⫺4 ⫺5 8.19
Right superior temporal gyrus 57 ⫺13 ⫺2 7.93
Left superior temporal gyrus ⫺60 ⫺22 4 7.70 180 Left superior temporal gyrus ⫺66 ⫺22 16 5.82
Left superior temporal gyrus ⫺51 ⫺43 13 4.90
Left putamen ⫺21 8 1 6.24 30
Precuneus 9 ⫺49 37 6.20 37
Precuneus 3 ⫺58 37 4.84
Right amygdala 24 ⫺7 ⫺14 5.84 33
Left supplementary motor area ⫺3 11 49 39.33 230 Single perceptual difference Left anterior cingulum ⫺9 23 25 13.21
Right insula 33 26 4 31.62 221 Left insula ⫺30 20 4 29.99 228 Left putamen ⫺21 8 1 18.89 Left putamen ⫺18 11 10 15.38 Left thalamus ⫺12 ⫺16 4 29.83 72 Left mid-occipital ⫺39 ⫺82 28 28.81 309
Left angular gyrus ⫺57 ⫺64 25 18.84
Left angular gyrus ⫺54 ⫺61 34 17.07
Right precentral gyrus 45 5 31 26.32 210
Right inferior frontal gyrus 54 8 19 16.95 Right precentral gyrus 48 2 43 13.42
Left superior frontal gyrus ⫺21 29 46 26.20 101 Left mid-frontal gyrus ⫺30 17 43 14.62
Left precentral gyrus ⫺42 2 34 25.87 196
Left rolandic operculum ⫺48 2 13 19.97 Left precentral gyrus ⫺54 5 37 18.68
Left supramarginal gyrus ⫺66 ⫺22 16 24.51 128 Left superior temporal gyrus ⫺57 ⫺19 1 21.27
Left post-central gyrus ⫺60 ⫺16 22 19.42
Left inferior parietal area ⫺45 ⫺28 43 24.34 147 Left inferior parietal area ⫺33 ⫺37 34 19.99
Left inferior parietal area ⫺39 ⫺40 52 15.41
Left precuneus ⫺9 ⫺58 28 22.86 398
Left precuneus ⫺6 ⫺46 43 22.19
Left mid-cingulum ⫺3 ⫺28 40 22.11
Left precentral gyrus ⫺30 ⫺7 46 21.97 62
Left mid-temporal gyrus ⫺51 ⫺40 10 20.49 37 Left superior temporal gyrus ⫺51 ⫺43 19 15.65
Left superior temporal gyrus ⫺63 ⫺46 13 14.91
highlight activation of the anterior insulae with no consistent
coactivation of other areas. The anterior insulae are therefore
now thought of as a correlate of awareness or consciousness
(
Craig, 2009
).
The precuneus and its functional significance have only
re-cently received attention. Its anatomical location makes it hard to
study, and it is therefore a comparatively less accurately mapped
area of cortex (
Cavanna and Trimble, 2006
). The precuneus has
widespread reciprocal corticocortical and subcortical
connec-tions. The principal connections outside parietal cortex are with
the frontal lobes (including supplementary motor areas) and
in-sulae, and it is noteworthy that the precuneus is not directly
connected to any primary sensory area (
Margulies et al., 2009
).
This pattern of connections implies that the precuneus is a major
association area that may underpin a variety of different
behav-iors (
Cavanna and Trimble, 2006
). An inverse relationship
be-tween activity in anterior insulae and activity in precuneus has
been associated with task-related attention (
Dosenbach et al.,
2007
). We see a similar inverse pattern of activation in precuneus
compared with anterior insulae and mid-cingulum, suggesting
that these areas could be related to the attentional demands of the
task rather than emotion perception per se. Importantly, albeit at
a more lenient threshold, we observed activation in bilateral
sub-cortical structures (amygdalae/hippocampi and thalami), all of
which have been traditionally implicated in emotion perception.
The quadratic response to the perceptual difference was
un-expected. In bilateral insulae, identical and maximally different
morphs of precentral gyri and mid-cingulum produced lower
responses than when it was less clear whether the morph
be-longed to the same category as the preceding one. Such complex
response forms to continuous changes in stimulus features may
be a property of higher-order association cortex and are an
im-portant topic for future investigation. While unexpected, these
responses have been reported previously in visual psychophysics
studies (
Aguirre, 2007
;
Drucker et al., 2009
) as well as a study on
voice gender (
Charest et al., 2013
). Intuitively, these quadratic
effects could be related to the experimental task, although these
have been very different across studies (orthogonal vs active
tasks).
We used nonverbal stimuli and a relatively simple task.
Nev-ertheless our data suggest a dissociation between the processing
of acoustic and cognitive aspects. It is plausible that the areas
responsive to perceptual differences in affect are supramodal. In
fact, a recent behavioral adaptation study suggests that there
might be neurons which code expressions independently of
mo-dality (
Skuk and Schweinberger, 2013
). There are additional
as-pects which deserve future attention. First, the perceptual
difference regressor was based on a simple categorization task
and could be fine-tuned by incorporating more dimensions of
emotion, e.g., intensity. We opted, in the first instance, to use data
that can be obtained from the participant during scanning.
Sec-ond, due to the nonverbal nature of our stimuli an interesting
extension of this study could investigate the complex interactions
between speech content and vocal affect. Furthermore, while our
analytical approach was appropriate for teasing apart the
pro-cesses dealing with acoustic and evaluative aspects of vocal
ex-pressions, it is limited in that it assumes our regressors of interest
are orthogonal (when in fact they are to some extent
corre-lated). As such, some of the variance attributed to the physical
difference regressor is neither purely physical nor purely
per-ceptual but shared. Therefore a strict dichotomy between
ce-rebral effects driven by physical or perceptual features of the
sounds is oversimplified.
Our results support the core idea described in
Schirmer and
Kotz (2006)
that vocal affect recognition is a multistep process.
Our findings extend that idea by identifying largely distinct
re-gions of the emotion network for the coding of acoustic features
of vocalization and for the processing of the cognitive
represen-tation of emotion. While the model originally proposes right IFG
and orbitofrontal cortex as the hubs for evaluative judgments and
left IFG for the processing of semantic content of emotional
pros-ody, our findings highlight the involvement of a more complex,
largely bilateral set of regions necessary to perform evaluative
judgments of emotional vocalizations even in the absence of
speech.
References
Aguirre GK (2007) Continuous carry-over designs for fMRI. Neuroimage 35:1480 –1494.CrossRef Medline
Andics A, McQueen JM, Petersson KM, Ga´l V, Rudas G, Vidnya´nszky Z (2010) Neural mechanisms for voice recognition. Neuroimage 52:1528 – 1540.CrossRef Medline
Belin P, Zatorre RJ (2000) ”What,” “where” and “how” in auditory cortex. Nat Neurosci 3:965–966.CrossRef Medline
Belin P, Zatorre RJ, Lafaille P, Ahad P, Pike B (2000) Voice-selective areas in human auditory cortex. Nature 403:309 –312.CrossRef Medline Belin P, Fillion-Bilodeau S, Gosselin F (2008) The Montreal Affective
Voic-es: a validated set of nonverbal affect bursts for research on auditory affective processing. Behav Res Methods 40:531–539.CrossRef Medline Bestelmeyer PE, Rouger J, DeBruine LM, Belin P (2010) Auditory
adapta-tion in vocal affect percepadapta-tion. Cogniadapta-tion 117:217–223.CrossRef Medline Bestelmeyer PE, Belin P, Grosbras MH (2011) Right temporal TMS impairs
voice detection. Curr Biol 21:R838 –R839.CrossRef Medline
Bestelmeyer PE, Latinus M, Bruckert L, Rouger J, Crabbe F, Belin P (2012) Implicitly perceived vocal attractiveness modulates prefrontal cortex ac-tivity. Cereb Cortex 22:1263–1270.CrossRef Medline
Brainard DH (1997) The psychophysics toolbox. Spat Vis 10:433– 436. CrossRef Medline
Bru¨ck C, Kreifelts B, Wildgruber D (2011) Emotional voices in context: a neurobiological model of multimodal affective information processing. Phys Life Rev 8:383– 403.CrossRef Medline
Buchanan TW, Lutz K, Mirzazade S, Specht K, Shah NJ, Zilles K, Jancke L (2000) Recognition of emotional prosody and verbal components of spoken language: an fMRI study. Cogn Brain Res 9:227–238.CrossRef Bu¨chel C, Holmes AP, Rees G, Friston KJ (1998) Characterizing stimulus—
response functions using nonlinear regressors in parametric fMRI exper-iments. Neuroimage 8:140 –148.CrossRef Medline
Cavanna AE, Trimble MR (2006) The precuneus: a review of its functional anatomy and behavioural correlates. Brain 129:564 –583. CrossRef Medline
Charest I, Pernet C, Latinus M, Crabbe F, Belin P (2013) Cerebral porcess-ing of voice gender studied usporcess-ing a continuous carryover FMRI design. Cereb Cortex 23:958 –966.CrossRef Medline
Craig AD (2009) How do you feel—now? The anterior insula and human awareness. Nat Rev Neurosci 10:59 –70.CrossRef Medline
Dosenbach NU, Fair DA, Miezin FM, Cohen AL, Wenger KK, Dosenbach RA, Fox MD, Snyder AZ, Vincent JL, Raichle ME, Schlaggar BL, Petersen SE (2007) Distinct brain networks for adaptive and stable task control in humans. Proc Natl Acad Sci U S A 104:11073–11078.CrossRef Medline Drucker DM, Kerr WT, Aguirre GK (2009) Distinguishing conjoint and
in-dependent neural tuning for stimulus features with fMRI adaptation. J Neurophysiol 101:3310 –3324.CrossRef Medline
Duerden EG, Arsalidou M, Lee M, Taylor MJ (2013) Lateralization of affec-tive processing in the insula. Neuroimage 78:159 –175.CrossRef Medline Duvernoy HM (1999) The human brain: surface, blood supply, and
three-dimensional sectional anatomy. Vienna: Springer.
Ethofer T, Anders S, Erb M, Herbert C, Wiethoff S, Kissler J, Grodd W, Wildgruber D (2006) Cerebral pathways in processing of affective pros-ody: a dynamic causal modeling study. Neuroimage 30:580 –587. CrossRef Medline
Ethofer T, Van De Ville D, Scherer K, Vuilleumier P (2009a) Decoding of emotional information in voice-sensitive cortices. Curr Biol 19:1028 – 1033.CrossRef Medline
Wildgru-ber D (2009b) Differential influences of emotion, task, and novelty on brain regions underlying the processing of speech melody. J Cogn Neu-rosci 21:1255–1268.CrossRef Medline
Ethofer T, Bretscher J, Gschwind M, Kreifelts B, Wildgruber D, Vuilleumier P (2012) Emotional voice areas: anatomic location, functional properties, and structural connections revealed by combined fMRI/DTI. Cereb Cor-tex 22:191–200.CrossRef Medline
Fru¨hholz S, Ceravolo L, Grandjean D (2012) Specific brain networks during explicit and implicit decoding of emotional prosody. Cereb Cortex 22: 1107–1117.CrossRef Medline
Grandjean D, Sander D, Pourtois G, Schwartz S, Seghier ML, Scherer KR, Vuilleumier P (2005) The voices of wrath: brain responses to angry prosody in meaningless speech. Nat Neurosci 8:145–146. CrossRef Medline
Grill-Spector K, Kushnir T, Edelman S, Avidan G, Itzchak Y, Malach R (1999) Differential processing of objects under various viewing condi-tions in the human lateral occipital complex. Neuron 24:187–203. CrossRef Medline
Hornak J, Rolls ET, Wade D (1996) Face and voice expression identification inpatients with emotional and behavioural changes following ventral frontal lobe damage. Neuropsychologia 34:247–261.CrossRef Medline Imaizumi S, Mori K, Kiritani S, Kawashima R, Sugiura M, Fukuda H, Itoh K,
Kato T, Nakamura A, Hatano K, Kojima S, Nakamura K (1997) Vocal identification of speaker and emotion activates different brain regions. Neuroreport 8:2809 –2812.CrossRef Medline
Kawahara H, Matsui H (2003) Auditory morphing based on an elastic per-ceptual distance metric in an interference-free time-frequency represen-tation. Paper presented at IEEE International Conference on Acoustics, Speech, and Signal Processing, 2003, Hong Kong, People’s Republic of China, April.
Latinus M, Crabbe F, Belin P (2011) Learning-induced changes in the cere-bral processing of voice identity. Cereb Cortex 21:2820 –2828.CrossRef Medline
Latinus M, McAleer P, Bestelmeyer PE, Belin P (2013) Norm-based coding of voice identity in human auditory cortex. Curr Biol 23:1075–1080. CrossRef Medline
Leaver AM, Rauschecker JP (2010) Cortical representation of natural com-plex sounds: effects of acoustic features and auditory object category. J Neurosci 30:7604 –7612.CrossRef Medline
Leitman DI, Wolf DH, Ragland JD, Laukka P, Loughead J, Valdez JN, Javitt DC, Turetsky BI, Gur GC (2010) “It’s not what you say, but how you say it”: a reciprocal temporo-frontal network for affective prosody. Front Hum Neurosci 4:19.CrossRef Medline
Lewis JW, Talkington WJ, Walker NA, Spirou GA, Jajosky A, Frum C, Brefczynski-Lewis JA (2009) Human cortical organization for process-ing vocalizations indicates representation of harmonic structure as a sig-nal attribute. J Neurosci 29:2283–2296.CrossRef Medline
Margulies DS, Vincent JL, Kelly C, Lohmann G, Uddin LQ, Biswal BB, Villringer A, Castellanos FX, Milham MP, Petrides M (2009) Precuneus shares intrinsic functional architecture in humans and monkeys. Proc Natl Acad Sci U S A 106:20069 –20074.CrossRef Medline
Mitchell RL, Elliott R, Barry M, Cruttenden A, Woodruff PW (2003) The neural response to emotional prosody, as revealed by functional magnetic resonance imaging. Neuropsychologia 41:1410 –1421.CrossRef Medline Morris JS, Scott SK, Dolan RJ (1999) Saying it with feeling: neural responses
to emotional vocalizations. Neuropsychologia 37:1155–1163.CrossRef Medline
Nonyane BA, Theobald CM (2007) Design sequences for sensory studies: achieving balance for carry-over and position effects. Br J Math Stat Psy-chol 60:339 –349.CrossRef Medline
Patel S, Scherer KR, Bjo¨rkner E, Sundberg J (2011) Mapping emotions into acoustic space: the role of voice production. Biol Psychol 87:93–98. CrossRef Medline
Pelli DG (1997) The VideoToolbox software for visual psychophysics: transforming numbers into movies. Spat Vis 10:437– 442. CrossRef Medline
Ra¨ma¨ P, Martinkauppi S, Linnankoski I, Koivisto J, Aronen HJ, Carlson S (2001) Working memory of identification of emotional vocal expres-sions: an fMRI study. Neuroimage 13:1090 –1101.CrossRef Medline Rorden C, Karnath HO, Bonilha L (2007) Improving lesion-symptom
map-ping. J Cogn Neurosci 19:1081–1088.CrossRef Medline
Ross ED, Monnot M (2008) Neurology of affective prosody and its functional-anatomic organization in right hemisphere. Brain Lang 104: 51–74.CrossRef Medline
Schirmer A, Kotz SA (2006) Beyond the right hemisphere: brain mecha-nisms mediating vocal emotional processing. Trends Cogn Sci 10:24 –30. CrossRef Medline
Schweinberger SR, Kawahara H, Simpson AP, Skuk VG, Za¨ske R (2014) Speaker perception. WIREs Cogn Sci 5:15–25.CrossRef
Shamay-Tsoory SG, Tomer R, Goldsher D, Berger BD, Aharon-Peretz J (2004) Impairment in cognitive and affective empathy in patients with brain lesions: anatomical and cognitive correlates. J Clin Exp Neuropsy-chol 26:1113–1127.CrossRef Medline
Skuk VG, Schweinberger SR (2013) Adaptation aftereffects in vocal emo-tion percepemo-tion elicited by expressive faces and voices. PLoS One 8:e81691.CrossRef Medline
Van Lancker D, Sidtis JJ (1992) The identification fo affective-prosodic stimuli by left-hemisphere-damaged and right-hemisphere-damaged subjects—all errors are not created equal. J Speech Hear Res 35:963–970. Medline
Wallbott HG, Scherer KR (1986) Cues and channels in emotion recogni-tion. J Pers Soc Psychol 51:690 – 699.CrossRef
Wiethoff S, Wildgruber D, Kreifelts B, Becker H, Herbert C, Grodd W, Ethofer T (2008) Cerebral processing of emotional prosody—influence of acoustic parameters and arousal. Neuroimage 39:885– 893.CrossRef Medline
Wildgruber D, Pihan H, Ackermann H, Erb M, Grodd W (2002) Dynamic brain activation during processing of emotional intonation: influence of acoustic parameters, emotional valence, and sex. Neuroimage 15:856 – 869.CrossRef Medline
Wildgruber D, Riecker A, Hertrich I, Erb M, Grodd W, Ethofer T, Ackermann H (2005) Identification of emotional intonation evaluated by fMRI. Neuroimage 24:1233–1241.CrossRef Medline
Wildgruber D, Ethofer T, Grandjean D, Kreifelts B (2009) A cerebral net-work model of speech prosody comprehension. Int J Speech Lang Pathol 11:277–281.CrossRef
Witteman J, Van Heuven VJ, Schiller NO (2012) Hearing feelings: a quan-titative meta-analysis on the neuroimaging literature of emotional pros-ody perception. Neuropsychologia 50:2752–2763.CrossRef Medline Bestelmeyer et al.• Multistep Perception of Vocal Affect J. Neurosci., June 11, 2014•34(24):8098 – 8105 • 8105