Chest Wall Kinematics Using Triangular Cosserat Point
Elements in Healthy and Neuromuscular Subjects
The MIT Faculty has made this article openly available. Please share
how this access benefits you. Your story matters.
Citation Solav, Dana; Meric, Henri; Rubin, M. B. et al. “Chest Wall Kinematics Using Triangular Cosserat Point Elements in Healthy and
Neuromuscular Subjects.” Annals of Biomedical Engineering 45, 8 (April 2017): 1963–1973 © 2017 Biomedical Engineering Society As Published http://dx.doi.org/10.1007/s10439-017-1840-6
Publisher Springer-Verlag
Version Author's final manuscript
Citable link http://hdl.handle.net/1721.1/110854
Terms of Use Article is made available in accordance with the publisher's policy and may be subject to US copyright law. Please refer to the publisher's site for terms of use.
Chest Wall Kinematics Using Triangular Cosserat Point Elements in Healthy and Neuromuscular Subjects
Solav Dana1, Meric Henri2,3,4, Rubin MB.1, Pradon Didier4, Lofaso Frédéric2,4, Wolf Alon1
1
Faculty of Mechanical Engineering, Technion Israel Institute of Technology, 32000 Haifa, Israel
2
Inserm U 1179, Université de Versailles Saint-Quentin-en-Yvelines, 104 Bd Raymond Poincaré, 92380 Garches, France
3
UPVD Département STAPS, 7 Avenue Pierre de Coubertin, 66120 Font-Romeu, France
4 CIC 1429, Inserm-APHP, Hôpital Raymond Poincaré, 104 Bd Raymond Poincaré,
92380 Garches, France
Address correspondence to: Dana Solav
Department of Mechanical Engineering, Technion Israel Institute of Technology 32000 Haifa, Israel
Electronic mail: [email protected] Telephone: +972778875945
Fax: +972778875711
Word count: 5500
Abstract:
Optoelectronic plethysmography (OEP) is a noninvasive method for assessing lung volume variations and the contributions of different anatomical compartments of the chest wall (CW) through measurements of the motion of markers attached to the CW surface. The present study proposes a new method for analyzing the local CW kinematics from OEP measurements based on the kinematics of triangular Cosserat point elements (TCPEs). 52 reflective markers were placed on the anterior CW to create a mesh of 78 triangles according to an anatomical model. Each triangle was characterized by a TCPE and its kinematics was described using four time-variant scalar TCPE parameters. The total CW volume (VTCW) and the contributions of its six compartments were also estimated, using the same markers. The method was evaluated using measurements of ten healthy subjects, nine patients with Pompe disease, and ten patients with Duchenne muscular dystrophy (DMD), during spontaneous breathing (SB) and vital capacity maneuvers (VC) in the supine position. TCPE parameters and compartmental volumes were compared with VTCW by computing the phase angles (for SB) and the correlation r (for VC) between them. Analysis of and r of the outward translation parameter P of each TCPE T revealed that for healthy subjects it provided similar results to those obtained by compartmental volumes, whereas for the neuromuscular patients the TCPE method was capable of detecting local asynchronous and paradoxical movements also in cases where they were undistinguished by volumes. Therefore, the TCPE approach provides additional information to OEP that may enhance its clinical evaluation capabilities.
Key Terms:
Breathing pattern; Chest wall kinematics; Neuromuscular disorder; Optoelectronic plethysmography; Respiratory motion
1. INTRODUCTION
Optoelectronic plethysmography (OEP) is a non-invasive method for measuring lung volume changes during breathing. In this method, the three-dimensional positions of reflective markers placed on the thoracic-abdominal surface are tracked by a system of infrared cameras to obtain an estimation of the volume variations of the entire chest wall (CW), and the contribution of each one of its compartments. OEP can be applied in various positions: standing, sitting, supine, prone 2,6,8,12,29. OEP has been shown to be a reliable and accurate method, and has been validated against spirometry in various conditions and populations 2,3,7,8,11,36 .
Unlike spirometry, OEP allows for a regional analysis of the breathing pattern. This approach has been commonly applied by partitioning the CW into two to six compartments and computing the contribution of each compartment to the total volume change 2,11. Moreover, this approach allows for the detection of asynchronies and asymmetries between the different compartments 4,6,11,37, which can be associated with respiratory muscle weakness 6,18.
Paradoxical respiration is a condition in which parts of the CW move inwards during inspiration and/or outward during expiration. Specifically, weakness or dysfunction of one or both diaphragms often leads to abdominal paradox, which can be measured using OEP as an opposite abdominal contribution to the total CW volume variation 4,6,20,23,30,31. Paradoxical volume contributions of the rib cage compartments were also reported 4,21.
Pompe disease, also named glycogen storage disease type II and acid maltase deficiency, is an autosomal recessive metabolic disorder associated with progressive muscle weakness predominantly affecting skeletal and respiratory muscles 26. Respiratory failure, often caused by lack of diaphragmatic involvement, is the primary cause of death 27. A recent study on late-onset Pompe disease patients 30 has shown, using OEP, that the abdominal contribution to tidal volume was correlated with the fall in forced vital capacity between seated and supine position, and therefore represents a reliable index to detect diaphragmatic weakness. Furthermore, Meric et al.23 have shown that the abdominal contribution to breathing and the abdominal volume change during vital capacity (VC) maneuver measured noninvasively using OEP, were correlated with the invasively measured Gilbert index reflecting the
diaphragmatic contribution to breathing, and are therefore reliable non-invasive indices of diaphragmatic function in Pompe disease.
Duchenne muscular dystrophy (DMD) is a genetic disorder associated with gradual loss of muscle strength and function. Reduced respiratory muscle strength typically causes respiratory inefficiency, and eventually leads to respiratory failure, which is the most common cause of death in DMD 14,16. Therefore, early diagnosis of respiratory muscle weakness is crucial in their clinical evaluation. Lo Maoro et al.20 and Romei et al.31 have shown, using OEP and other respiratory function tests, that the abdominal contribution to tidal volume and inspiratory capacity is a marker of the onset of diaphragm weakness in DMD patients.
In the great majority of the abovementioned studies using OEP, the data on the motion of the markers attached to the CW surface was used only to compute total and compartmental volume variations. A few studies also used them to analyze the distributions of respiratory system transfer impedance 1,10 and the translation of individual markers along the midline of the CW 10. However, it appears that no previous study has analyzed the CW motion by means of its complete kinematics for clinical purposes. Here, it is postulated that local analysis of CW kinematics provides information related to specific respiratory muscle function that adds valuable information to OEP measurements which potentially enhance its clinical evaluation capabilities. Therefore, as a first step to achieve this goal, the present study aims at developing a method for the local analysis of the complete non-rigid kinematics of the CW surface. The kinematic methods presented in this paper are based on the triangular Cosserat point elements (TCPE) method, previously developed for bone pose estimation in the presence of soft tissue artifact 33–35, and are further developed here for the purpose of respiratory kinematic analysis. The second aim of the study is to evaluate the new method using OEP measurements of healthy subjects as well as two groups of neuromuscular patients: Pompe disease and DMD, and to compare the new method with volumetric measures extracted from OEP.
Both the TCPE and the OEP analyses are performed using the same raw data, consisting of the instantaneous three-dimensional positions of a 52-marker set attached to the anterior CW surface. It was hypothesized that local CW kinematics, represented by TCPE parameters, will provide valuable information on the breathing pattern which cannot be detected by OEP using the six compartments model.
2. MATERIALSANDMETHODS
2.1. Subjects and experimental measurements
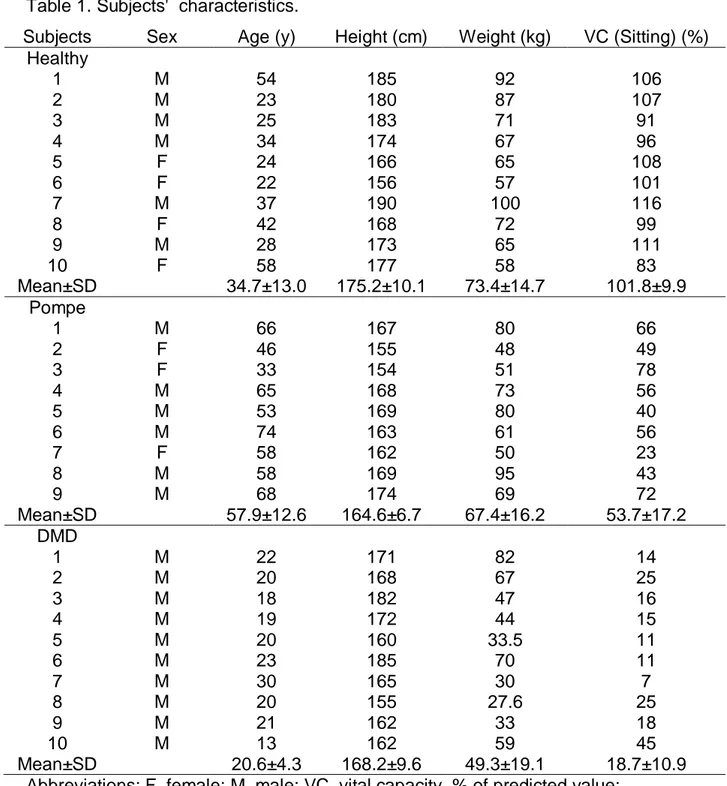
Three groups of subjects were examined; ten healthy subjects (H1, H2, …, H10), nine patients with Pompe disease (P1, P2, …, P9), and ten patients with DMD (D1, D2, ..., D10). Their characteristics are presented in Table 1. The patients were investigated prospectively as part of their routine follow-up at the Raymond Poincaré Teaching Hospital, Garches, France. The local ethics committee approved the study and all participants gave a written informed consent to participate in the study. The healthy subjects were investigated in the same unit during the same period as the patients. All subjects were examined in the supine position, with the back of the trunk supported on a bed, using a routine which included two minutes of spontaneous breathing (SB) and a slow vital capacity (VC) maneuver, guided by a technician, as described by the ATS/ERS standardization guidelines 25.
An optoelectronic recording system (CX1, Codamotion System, Charnwood Dynamics Ltd., Rothley, Leicester, UK) was used to measure the positions of 52 active reflective markers. Two CX1 units connected through a hub were used simultaneously; each unit contains three pre-aligned solid-state cameras which tracks the three-dimensional positions of the infra-red LED active markers. A major advantage of this system is that it does not require calibration and marker labeling, and that it uniquely identifies each marker with 100% reliability, unlike most passive-marker systems. The reported angular resolution of each camera, positioned at 3 meters distance, is about 0.03 mrad (0.002 deg), which results in a lateral position resolution of about 0.05mm, and a distance resolution of about 0.3mm 9. The reliability of the CX1 system was previously analyzed for three-dimensional gait analysis, and was found to provide good inter-trial, inter-session, and inter-therapist reliabilities, which compared favorably to other systems 17. To the best of the authors' knowledge, no study published the reliability of the system specifically for respiratory motion measurements.
The markers were positioned over the anterior CW surface from the clavicles to the pubic bone, based on the anatomical model of Cala et al. 8, as illustrated in Fig.
The signals were smoothed by applying a fourth-order reverse and zero-phase forward Butterworth digital filter with a cutoff frequency of 3 Hz.
2.2. Modelling of the chest wall and volume computation
The posterior thoracoabdominal wall, which is hidden in the supine position, was modeled by vertically projecting the position of the lateral markers on the plane of the bed at the onset of inspiration. The anterior CW surface was approximated by a triangular mesh containing 78 triangles created by connecting the nodes represented by the markers, as shown in Fig. 1. The CW was separated into six compartments: left and right upper thorax (LUT and RUT, respectively), left and right lower thorax (LLT and RLT), and left and right abdomen (LAB and RAB). The upper thorax extends from the clavicular line to the xiphoid process, the lower thorax extends from the xiphoid process to the lower costal margin, and the abdomen extends from the costal margin to the anterior-superior iliac spines. The volumes enclosed by the total CW surface
VTCW
and each of its six compartments (VLUT, VRUT, VLLT, VRLT, VLAB, and VRAB ) were computed in each time step by integrating over the surface mesh enclosing the relevant volume and applying Gauss' theorem 3,24.Figure 1. Marker positions and triangulation of the chest wall surface. The colored lines illustrate the borders of the anatomical compartments: RUT (blue), LUT (red), RLT (yellow), LLT (purple), RAB (green), LAB (light blue). The upper thorax extends from the clavicular line to the xiphoid process, the lower thorax extends from the xiphoid process to the lower costal margin, and the abdomen extends from the costal margin to the anterior-superior iliac spines.
2.3. TCPE kinematics
The local kinematics of the CW was studied by analyzing the non-rigid kinematics of each triangle in the triangulated mesh described in the previous section. Each triangle was characterized by a triangular Cosserat point element (TCPE), and the position data of the markers were used to obtain the non-rigid transformation of each TCPE from a reference configuration (time t ) to a present configuration (time t ). 0 This transformation was defined by a deformation gradient tensor F of the TCPE and a translation vector t of the centroid of the TCPE, as described in the Appendix. Then, F and t were used to define four time-variant scalar parameters describing the TCPE's outward translation (PT), rotation angle (P , area change (R) P , and shape A) distortion (P . The procedure for obtaining these parameters is described in the S) Appendix as well.
2.4. Data analysis
Each SB trial was divided into respiratory cycles according to the minimum values of the VTCW signal, representing the onset of inspiration. In each cycle, the marker configuration in the first frame was used as the reference configuration. Then, the scalar TCPE parameters
P P P PT, R, A, S
were calculated for each frame succeeding the reference frame, such that the value of each of the parameters equals zero at the beginning of each cycle, and its value in each succeeding frame is relative to its value at the onset of inspiration.For each respiratory cycle of each SB trial, the relationship between the waveform of the TCPE parameter P ii( T R A S, , , ) and the waveform of VTCW , was evaluated as the phase angle between the signals. The phase angle was obtained using Lissajous figures produced by plotting VTCW againstP . From each Lissajous i
figure, the following measures were obtained: the range Vof VTCW , the range Pof i
P , the area APV bounded by the Lissajous loop, the slope aPV of the major axis of the curve, and the direction of the curve's rotation (clockwise or counter clockwise). These measures were used to obtain the value of the phase angle by
1 1 1 1 if 0 and clockwise sin 4if 0 and counter clockwise sin 4
if 0 and clockwise 180 sin 4
if 0 and counter clockwise 180 sin 4 PV PV PV PV PV PV PV PV a A P V a A P V a A P V a A P V (1) with 1
0 sin 4APV P V 90 such that 180 180 . 0 represents complete synchrony and 180 represents complete asynchrony between the signals. A positive value of indicates that the VTCW signal precedes the TCPE parameter signal, and vice versa. This formulation of was chosen because it has shown to perform well in cases where the loops tend to deviate from an elliptical shape 13.
Since the VC maneuver is not cyclic, the relationship between the signals of TCPE parameters and the volumes could not be evaluated using phase angles. Therefore, these signals were compared by calculating the Pearson correlation coefficients r between them. Values of r close to +1 represent synchrony and values close to 1 represent large asynchrony, or paradoxical motion.
The phase shift and correlation analyses could not be performed for P and R
S
P because they are positive definite (see Appendix). Specifically, their waveforms cannot be compared with the volume change when the latter becomes negative. Therefore, these analyses were performed only for the parameters P and T P . A
Additionally, the phase angles (for SB) and the Pearson correlation coefficients (for VC) are calculated between each of the compartmental volumes (VLUT, VRUT,
, LLT
those of the TCPE parameters, in order to examine whether the TCPE parameters provide similar and/or additional information to OEP.
Table 1. Subjects' characteristics.
Subjects Sex Age (y) Height (cm) Weight (kg) VC (Sitting) (%) Healthy 1 M 54 185 92 106 2 M 23 180 87 107 3 M 25 183 71 91 4 M 34 174 67 96 5 F 24 166 65 108 6 F 22 156 57 101 7 M 37 190 100 116 8 F 42 168 72 99 9 M 28 173 65 111 10 F 58 177 58 83 Mean±SD 34.7±13.0 175.2±10.1 73.4±14.7 101.8±9.9 Pompe 1 M 66 167 80 66 2 F 46 155 48 49 3 F 33 154 51 78 4 M 65 168 73 56 5 M 53 169 80 40 6 M 74 163 61 56 7 F 58 162 50 23 8 M 58 169 95 43 9 M 68 174 69 72 Mean±SD 57.9±12.6 164.6±6.7 67.4±16.2 53.7±17.2 DMD 1 M 22 171 82 14 2 M 20 168 67 25 3 M 18 182 47 16 4 M 19 172 44 15 5 M 20 160 33.5 11 6 M 23 185 70 11 7 M 30 165 30 7 8 M 20 155 27.6 25 9 M 21 162 33 18 10 M 13 162 59 45 Mean±SD 20.6±4.3 168.2±9.6 49.3±19.1 18.7±10.9
3. RESULTS
3.1 Kinematic analysis
The kinematic analysis was performed by examining the time-variant values of the four TCPE parameters
P P P PT, R, A, S
in each trial. It was found that the values of
P P PR, A, S
were highly sensitive to noisy marker position data, and that their values were very small and insignificant compared with the parameter P , which T provided the most robust and consistent results. Therefore, the results are focused on the parameter PT.The time-variant values of P for each TCPE, and the estimated volume T variations of the total CW (TCW) and its six compartments, are presented in Vid. 1 and Vid. 2 for SB and VC, respectively. Each video shows the respiratory kinematic pattern of one characteristic subject from each group, for examples: a healthy subject (H5), a Pompe patient (P8), and a DMD patient (D6). The values of PT in each TCPE are illustrated using colors and the volume variations are plotted below.
In Vid. 1, it is noticed that for the healthy subject, the values of P are positive T on the entire surface of the CW, and the waveforms of the volumes of all the compartments are synchronized. Conversely, the Pompe patient demonstrates a paradoxical inward abdominal motion, which is indicated by the negative values of the TCPEs in the abdominal region during inspiration. The paradoxical pattern is also indicated by the large phase shift between the volumes of the abdominal compartments (LAB and RAB) and the rest of the volumes. For the DMD patient, the volumes of the abdominal compartments are synchronized with those of the CW and the thoracic compartments, and therefore do not indicate paradoxical motion. However, the values of P in different TCPEs within the abdominal compartments T are highly inhomogeneous, and a paradoxical motion in the medial parts of the abdominal compartments is observed. As a result, the abdominal compartment contribution to the volume is positive, even though it decreases due to the negative contribution of the medial regions. In this case, the asynchrony can be detected using the local TCPE measures but not using the volumetric measures.
In Vid. 2, similarly to Vid.1, for the healthy subject the values of P are T positive on the entire CW surface during inspiration, and the volumes of all the compartments seem reasonably synchronized. The Pompe patient demonstrates an inward abdominal motion during inspiration and an outward abdominal motion at the end of expiration, which is indicated by the opposite values of the TCPEs in the abdominal region as well as by the abdominal compartmental volumes. The lower thoracic volume contribution is very small but is clearly asynchronized with VTCW ,
while the values of P in the TCPEs in these compartments indicate that the upper T ones move synchronously while the lower ones move paradoxically. For the DMD patient, the volumes of all the compartments seem fairly synchronized with VTCW , however the values of P indicate an asynchronous motion in the lower abdomen, T
particularly on the lateral right side. Therefore, despite the synchrony between {VLAB,
RAB
V } and VTCW , it is clearly noticed that the lower parts of the abdominal compartments exhibit paradoxical motion.
3.2 Phase angles and correlations
The inter-subject variability within the neuromuscular groups did not allow for averaging of the subjects. Therefore, the results are presented here for one characteristic subject from each group. The results for all subjects are presented in the electronic supplementary material.
Local maps of the absolute phase angles
P VT, TCW
between the waveforms of P and T VTCW during SB are presented in Fig. 2 for one subject from each group (same subjects as in Vid. 1 and Vid. 2). The maps were obtained by averaging, for each TCPE, the values of
P VT, TCW
over six consecutive respiratory cycles. The statistics of the absolute values of
P VT, TCW
are presented because the computational procedure of the phase angle from Lissajous figures which are close to linear with a negative slope, often results in phase angles close to 180 or 180 , depending on the direction of the loop. Therefore, averaging of these values would yield meaningless results. The maps for all subjects are presented in the electronic supplementary Fig. E1.In the healthy group, nine out of ten subjects exhibited synchronous motion, depicted as small phase angles on the entire CW surface, similar to the healthy subject H5 shown in Fig .2. The meanSD value of
P VT, TCW
over all TCPEs and all subjects was 14 10 . Similarly, the volumes of all the compartments were synchronized with VTCW ( 6 5 ). For one subject (H2), the values of
P VT, TCW
demonstrated mild asynchrony ( 36 19 ), while the volumes were synchronized (9 7 ).
In the Pompe group, six out of nine patients (P3, P4, P5, P6, P8, and P9) demonstrated severe asynchrony between the TCPEs in the abdominal regions and the total volume VTCW (124 17 ), along with synchrony or mild asynchrony in the thoracic compartments ( 43 25 ). For instance, patient P8, whose local phase angle map is shown in Fig. 2, exhibited paradoxical motion in all the TCPEs in LAB and RAB (mean values of
P VT, TCW
for the TCPEs in both compartments was 167 6 ), which was similar to the values of
VRAB,VTCW
and
VLAB,VTCW
(175 2 ). In the lower thoracic compartments, the compartmental volumes values were paradoxical relative to VTCW (mean values of
VRAB,VTCW
and
VLAB,VTCW
were 168 4 ). However, the TCPEs in the upper parts of these compartment, moved synchronously with VTCW ( 38 24 ) while the ones in the lower parts moved paradoxically ( 157 26 ). Furthermore, one patient (P7) exhibited paradoxical motion in the TCPEs in the upper and lower thoracic compartments ( 111 37 ), along with synchronous motion in the TCPEs in the abdominal compartments (27 33 ). The other two patients (P1 and P2) demonstrated synchronous motion in TCPEs on the entire CW surface ( 22 19 ).
In the DMD group, apparent asynchronies were noticed in seven out of ten patients (D2, D4, D5, D6, D7, D8, and D9). The locations of the asynchronous TCPEs varied among the subjects. For instance, patient D6, shown in Fig. 2, exhibited asynchronous motion in the TCPES in the medial abdominal region. The meanSD value of
P VT, TCW
in these TCPEs was 109 29 , whereas the valuesthe asynchrony in this case is detectable by the local TCPE parameter but not by the compartmental volumes. Other DMD patients exhibited mostly mild asynchronies in various regions of the CW, particularly in TCPEs in the medial parts of the CW surface ( 61 44 ). All these asynchronies were not indicated by the phase angles of the abdominal volumes, which were all synchronized ( 6 6 ).
The values of the Pearson correlation coefficients r P V
T, TCW
between the waveforms of PT and VTCW during the VC trials are presented in Fig. 3 for one subject from each group (same subjects as in the Vid. 1, Vid. 2, and Fig. 2). The maps for all subjects are presented in the electronic supplementary Fig. E2.In the healthy group, all ten subjects exhibited very strong positive correlations in the TCPEs on the entire CW surface, similarly to the healthy subject H5 shown in Fig. 3. The meanSD value of r P V
T, TCW
over all TCPEs and all subjects was 0.920.7 . Correspondingly, the correlations between the compartmental volumes and VTCW were also very strong (0.98 0.2 ).In the Pompe group, five out of nine patients (P3, P4, P6, P7, and P8) demonstrated abdominal paradoxical motion characterized by negative correlation coefficients in TCPEs in the lower areas (mostly in all or part of the abdominal compartments). The mean SD value of r P V
T, TCW
in these TCPEs was0.72 0.26
. For instance, patient P8 shown in Fig. 3 exhibited paradoxical motion in the entire abdominal compartment, as well as in the lower part of the lower thoracic compartments. One subject (P5) exhibited paradoxical motion in the upper thoracic compartments (0.71 0.24 ). Conversely, three patients (P1, P2, P9) demonstrated strong positive correlations on the entire CW surface (0.88 0.11 ). Analysis of the correlations between the compartmental volumes and VTCW in this group obtained similar results, except for two patients (P6 and P7) for whom asynchrony was identified by the values of P but not by the volumes. T
In the DMD group, paradoxical movements were noticed in six out of ten patients (D1, D2, D4, D6, D8, and D9) in part of the TCPEs in the abdominal compartments, characterized by negative values of r P V
T, TCW
. Negative values appeared mostly in TCPEs in the lower parts of the abdomen and not in the entire abdominal compartment, as shown for patient D6 in Fig. 3. The mean SD value of
T, TCW
r P V in these TCPEs over all the above mentioned patients was 0.520.37. Moreover, for all these subjects the correlation coefficients between the abdominal volumes and VTCW, namely r V
RAB,VTCW
and r V
LAB,VTCW
, were positive (0.86 0.9 ) and did not exhibit asynchrony. The other DMD patients exhibited mostly positive values of r P V
T, TCW
on the entire CW surface (0.88 0.10 ), similar to the values of the compartmental volumes (0.90 0.9 ).Figure 2. Absolute values of the phase angle between the TCPE parameter P and T the total CW volume VTCW in all the TCPEs on the CW, averaged over six cycles of SB, for one subject from each group.
Figure 3. Values of the Pearson correlation coefficients between the TCPE parameter P and the total CW volume T VTCW in all the TCPEs on the CW, during a VC maneuver, for one subject from each group.
4. DISCUSSION
The main objective of the present study was to develop a kinematic method for analyzing the local movements of the CW surface during respiration and to apply this method on healthy and neuromuscular subjects with an aim to provide more accurate and detailed information on the CW motion pattern that would enhance the clinical interpretation of the well-established OEP measurements. To achieve this, the triangulated mesh of the CW surface was characterized using Triangular Cosserat Point Elements (TCPEs), and the full non-rigid kinematics of each TCPE was decomposed into four time-variant scalar parameters describing the outer translation, rotation angle, area change, and shape distortion. These parameters, as well as the compartmental volumes measured simultaneously, were analyzed in 10 healthy subjects, 9 Pompe patients, and 10 DMD patients, during SB and VC in the supine position.
The results revealed that the translational parameter P provided the most T robust and useful results among the four parameters. The values of P were T
evaluated in terms of the phase angles (for SB) and correlations (for VC) with VTCW measured simultaneously using the same markers. These results were compared with the phase angles and correlations obtained between the compartmental volumes and VTCW.
In the SB trials, the values of
P VT, TCW
indicated that healthy SB pattern is characterized by synchronous outward translation of the entire CW surface. Conversely, in the neuromuscular patient groups, various levels of asynchrony were found, characterized by large values of
P VT, TCW
. Specifically, abdominal paradoxical motion was found in six out of the nine Pompe patients. This finding is consistent with previous research and has been shown to be an important indicator of the degree of diaphragmatic weakness 6,23,30. In the DMD group, high variabilities in the phase angles within TCPEs in the same compartment were found. These local asynchronies, indicated by large values of
P VT, TCW
, appeared mostly in the medial parts of the CW.entire CW surface, indicating a synchronous motion. Conversely, in the neuromuscular patient groups, areas with TCPEs characterized by negative values of r P V
T, TCW
were found, mostly in the lower parts of the abdominal compartments.In both SB and VC, the phase angles and correlations obtained by the compartmental volumes, provided similar results to those obtained by TCPEs only for the healthy subjects. Conversely, in the neuromuscular groups, local asynchronies were found in TCPEs also in cases where the compartmental volumes were synchronized, and vice versa. This is an important finding which demonstrates that the large compartments commonly used in OEP methods are not sufficient to distinguish local variations and asynchronies, and that complementary information can be extracted from the same marker data by analyzing smaller local elements to obtain a more detailed and accurate picture of the respiratory pattern. Specifically, it has been previously shown, in DMD patients, that the abdominal contribution to tidal volume can be used as an indicator of the degree of disease progression and respiratory muscle impairment, including the diaphragm 20,31. Nevertheless, reduced abdominal contribution to the volume can be caused either by small synchronous motion of the entire surface of the compartment, or by paradoxical motion of a part of the compartment. This difference, for example, can be pointed out by the analysis of local elements.
It should be noted that the computation of the outward translation values of individual triangular elements can be done using other methods, and is not limited to the TCPE method. The choice of using the TCPE method in this study provided the possibility to analyze a number of independent non-rigid kinematical measures, and the finding that P provided the most important contribution could not be determined T a priori without analyzing other measures. Therefore, the results suggest that the six compartments typically used in OEP are not always sufficient to distinguish local variations, especially in pathological patients. Moreover, since the values of the other parameters provided considerably smaller contributions, it is possible that volume computation of much smaller elements using OEP would provide similar results.
Moreover, it is known that abdominal motion during respiration is affected by the function of both the diaphragm and abdominal muscles. In patients with diaphragmatic weakness, the decrease in abdominal expansion during inspiration might be masked by relaxation of the abdominal muscles which were activated
during expiration 19. It is anticipated that by analyzing the local kinematics of the CW, these individual contributions can be better distinguished, and a more accurate diagnosis of the level of muscle impairment can be obtained.
This study entails several limitations. The first limitation arises from the fact that the measurements were performed in the supine position. This position was chosen for two reasons: first, it is known to impair diaphragmatic function which was of interest in this study. Second, it requires fewer markers than the upright position, and therefore reduces the preparation time. Nevertheless, further research using different positions, such as standing, sitting, and prone, are necessary to determine if the results of this study can be generalized. The second limitation is that both the TCPE method and OEP are based upon non-invasive motion analysis of the CW. In order to validate the relationships between the local CW kinematics and the contributions of different respiratory muscles, invasive tests are required such as needle electromyography 5 and transdiaphragmatic pressure measurements 6. Once these relationships are validated, OEP including local analysis may constitute a potential alternative to the invasive tests. Being non-invasive, OEP has shown to be preferred by patients, and it also entails an advantage for clinics, because it can be performed by a technician and can therefore reduce medical doctor time.
A benefit of the proposed method is that once its algorithm is incorporated in the OEP analysis system, the additional information can be obtained automatically, and is available at no additional cost, either monetary or in subject preparation time. Moreover, an advantage of the local parameter P over the volumetric measures is T that it is independent of the area of the triangular element, and is therefore less sensitive to marker positioning errors introduced by the operator.
The additional information gained by analyzing smaller elements demonstrates that a larger number of markers may be advisable. However, applying more markers would result in an undesirable longer subject preparation time. A potential alternative is to use markerless motion capture systems, which are recently becoming more accessible and accurate, and are being developed for respiratory motion analysis as well 15,28. Using markerless systems, a very large number of observation points can be available at a minimal cost. However, further research should determine the reliability of these systems compared with marker-based
In summary, analysis of CW local kinematics revealed that the outward translation parameter provided additional information about local asynchronous movements in neuromuscular patients which was undistinguished by OEP volumetric measures. Further research should validate the relationship between these local asynchronies and the diaphragmatic and non-diaphragmatic muscle function, using gold standard measures such as electromyography and transdiaphragmatic pressure tests.
ACKNOWLEDGEMENTS
Dana Solav was partially supported by the Aharon and Ephraim Katzir Study Grant of the Batsheva de Rothschild Fund. MB Rubin was partially supported by his Gerard Swope Chair in Mechanics.
APPENDIX
The present configuration of a given TCPE is denoted by the position vectors
1, 2 3}
{x x x, of its vertices. The values of these position vectors in the reference configuration are denoted by {X X X1, 2, 3}, with Xi xi(t t0) ; i1, 2, 3. Furthermore,
the centroids of the TCPE
X x,
in its reference and present configurations,respectively, and the translation vector t between these two configurations are given by
1 2 3
1 2 3
1 1 , , . 3 3 X X X X x x x x t x X (2)Moreover, the reference and present configurations are characterized by the director vectors {D D , D and 1, 2 3} {d d , d1, 2 3}, respectively, with D and 3 d being unit 3
1 2 0 1 2 3 1 2 3 1 2 2 1, 3 1, 2 . ( ); 1, 2,3 i A t t i i D d d D D d x x d x x d d d D d (3)
The vertices and director vectors of each TCPE are ordered such that for each TCPE the director vector d points outwards from the CW surface. Then, the reference 3 reciprocal vectors 1 2 3 , {D D , D are defined by } 1 2 3 2 3 3 1 1 2 3 1 1 1 ( ); ( ); ( ) 2A 2A 2A , D D D D D D D D D D (4) such that i i j j D D , where i j
is the Kronecker delta symbol. In addition, the deformation gradient tensor F of the TCPE is defined by
3 1 , i i i
F d D (5)where
is the tensor product (outer product) operator.It follows that the transformation of each TCPE from its reference configuration to a present configuration can be described by a translation vector t of the TCPE's centroid, and the deformation gradient tensor F, such that each point in the TCPE is transformed by
.i i
x X t F X X (6)
The translation vector t of the TCPE's centroid and the unit vector d normal 3 to the TCPE plane are used to define a scalar parameter P describing the outward T normal translation of the TCPE.
3.
T
P t d (7)
Furthermore, the deformation gradient F is decomposed using the polar decomposition theorem 22 to determine the unique proper orthogonal rotation tensor
R and the unique positive definite symmetric stretch tensor N by
1/2 1/ 1 2 ; [ , det 1, ] . T T T T T T T T NR R R I R N N FF NR NR NRR N NN N R N FF F B B F F (8)1 ( ) 1 cos . 2 R trace P R (9)
Since the deformations of the TCPE are two-dimensional it follows that the left Cauchy-Green deformation tensor B has the spectral form
2 2
1 1 1 2 2 2 3 3,
T
B FF p p p p d d (10)
where
p p1, 2
are orthogonal unit eigenvectors in the plane of the TCPE.Furthermore, it follows that the dilatation J is given by
1 2
det( ) det( ) / ,
J F B a A (11)
where a is the TCPE’s present area and A is the reference area, such that a scalar parameter P describing the area change is given by A
1 A
P J . (12)
Moreover, it follows from (10) and (11) that
2 2 1 2 2 1 2 1 2 2 2 1 1 ( ) 1 . trace J B (13) where 2 1 2
. Using this expression, the scalar parameter P describing the S distortional deformation (shape change with no area change) is defined by
1 2 2 1 ( ) 1 2 2 S P J trace B . (14)It is noted that the parameters
P PR, S
are positive definite, while
P PT, A
can have positive or negative values. Moreover, it should be noted that all four TCPE parameters are independent on the size of the TCPE.REFERENCES
1. Aliverti, A., R. L. Dellacà, and A. Pedotti. Transfer impedance of the respiratory
system by forced oscillation technique and optoelectronic plethysmography.
Ann. Biomed. Eng. 29:71–82, 2001.
2. Aliverti, A., R. L. Dellacà, P. Pelosi, D. Chiumello, L. Gattinoni, and A. Pedotti.
Compartmental analysis of breathing in the supine and prone positions by
optoelectronic plethysmography. Ann. Biomed. Eng. 29:60–70, 2001. 3. Aliverti, A., R. Dellacà, P. Pelosi, D. Chiumello, A. Pedotti, and L. Gattinoni.
Optoelectronic plethysmography in intensive care patients. Am. J. Respir. Crit.
Care Med. 161:1546–1552, 2000.
4. Aliverti, A., M. Quaranta, B. Chakrabarti, A. L. P. Albuquerque, and P. M.
Calverley. Paradoxical movement of the lower ribcage at rest and during
exercise in COPD patients. Eur. Respir. J. 33:49–60, 2009.
5. Bolton, C. F., F. Grand’maison, A. Parkes, and M. Shkrum. Needle electromyography of the diaphragm. Muscle Nerve 15:678–681, 1992.
6. Boudarham, J., D. Pradon, H. Prigent, L. Falaize, M. C. Durand, H. Meric, M.
Petitjean, and F. Lofaso. Optoelectronic plethysmography as an alternative
method for the diagnosis of unilateral diaphragmatic weakness. Chest
144:887–895, 2013.
7. Boudarham, J., D. Pradon, H. Prigent, I. Vaugier, F. Barbot, N. Letilly, L.
Falaize, D. Orlikowski, M. Petitjean, and F. Lofaso. Optoelectronic vital
capacity measurement for restrictive diseases. Respir. Care 58:633–638, 2013.
optical reflectance motion analysis. J. Appl. Physiol. (Bethesda, Md. 1985)
81:2680–2689, 1996.
9. Charnwood Dynamics Limited. CODA cx1 User Guide. , 2008.at
<http://www.codamotion.com/>
10. Dellacà, R. L., A. Aliverti, K. R. Lutchen, and A. Pedotti. Spatial distribution of
human respiratory system transfer impedance. Ann. Biomed. Eng. 31:121– 131, 2003.
11. Dellaca, R. L., M. L. Ventura, E. A. Zannin, M. Natile, A. Pedotti, and P.
Tagliabue. Measurement of total and compartmental lung volume changes in
newborns by optoelectronic plethysmography. Pediatr. Res. 67:11–16, 2010. 12. Ferrigno, G., P. Carnevali, A. Aliverti, F. Molteni, G. Beulcke, and A. Pedotti.
Three-dimensional optical analysis of chest wall motion. J. Appl. Physiol.
(Bethesda, Md. 1985) 77:1224–1231, 1994.
13. Fredberg, J. J., and D. Stamenovic. On the imperfect elasticity of lung tissue. J
Appl Physiol 67:2408–2419, 1989.
14. Hahn, A., J. R. Bach, A. Delaubier, A. Renardel-Irani, C. Guillou, and Y.
Rideau. Clinical implications of maximal respiratory pressure determinations
for individuals with Duchenne muscular dystrophy. Arch. Phys. Med. Rehabil.
78:1–6, 1997.
15. Harte, J. M., C. K. Golby, J. Acosta, E. F. Nash, E. Kiraci, M. A. Williams, T. N.
Arvanitis, and B. Naidu. Chest wall motion analysis in healthy volunteers and
adults with cystic fibrosis using a novel Kinect-based motion tracking system.
Med. Biol. Eng. Comput. 54:1631–1640, 2016.
16. Howard, R. S., C. M. Wiles, G. T. Spencer, R. S. Howard, C. M. Wiles, N. P.
Assessment and management. Qjm 86:175–189, 1993.
17. Kiernan, D., M. Walsh, R. O’sullivan, and D. Fitzgerald. Reliability of the CODA cx1 motion analyser for 3-dimensional gait analysis. Gait Posture 39:S99– S100, 2014.
18. Lanini, B., M. Masolini, R. Bianchi, B. Binazzi, I. Romagnoli, F. Gigliotti, and G.
Scano. Chest wall kinematics during voluntary cough in neuromuscular
patients. Respir. Physiol. Neurobiol. 161:62–68, 2008.
19. Lessard, M. R., F. Lofaso, and L. Brochard. Expiratory muscle activity
increases intrinsic positive end-expiratory pressure independently of dynamic
hyperinflation in mechanically ventilated patients. Am. J. Respir. Crit. Care
Med. 151:562–569, 1995.
20. LoMauro, A., M. G. D’Angelo, M. Romei, F. Motta, D. Colombo, G. P. Comi, A. Pedotti, E. Marchi, A. C. Turconi, N. Bresolin, and A. Aliverti. Abdominal
volume contribution to tidal volume as an early indicator of respiratory
impairment in Duchenne muscular dystrophy. Eur. Respir. J. 35:1118–1125, 2010.
21. LoMauro, A., S. Pochintesta, M. Romei, M. G. D’Angelo, A. Pedotti, A. C. Turconi, and A. Aliverti. Rib cage deformities alter respiratory muscle action
and chest wall function in patients with severe Osteogenesis imperfecta. PLoS
One 7:e35965, 2012.
22. Malvern, L. Introduction to the Mechanics of a Continuous Medium. Prentice
Hall, 1969.
23. Meric, H., L. Falaize, D. Pradon, D. Orlikowski, H. Prigent, and F. Lofaso. 3D
24. Meric, H., F. Lofaso, L. Falaize, and D. Pradon. Comparison of Two Methods
to Compute Respiratory Volumes Using Optoelectronic Plethysmography. J.
Appl. Biomech. 32:221–226, 2016.
25. Miller, M. R., J. Hankinson, V. Brusasco, F. Burgos, R. Casaburi, A. Coates, R.
Crapo, P. Enright, C. P. M. van der Grinten, P. Gustafsson, R. Jensen, D. C.
Johnson, N. MacIntyre, R. McKay, D. Navajas, O. F. Pedersen, R. Pellegrino,
G. Viegi, and J. Wanger. Standardisation of spirometry. Eur. Respir. J.
26:319–38, 2005.
26. Pellegrini, N., P. Laforet, D. Orlikowski, M. Pellegrini, C. Caillaud, B. Eymard,
J. C. Raphael, and F. Lofaso. Respiratory insufficiency and limb muscle
weakness in adults with Pompe’s disease. Eur. Respir. J. 26:1024–1031, 2005.
27. van der Ploeg, A. T. Monitoring of pulmonary function in Pompe disease: a
muscle disease with new therapeutic perspectives. Eur. Respir. J. 26:984–5, 2005.
28. Povšič, K., M. Jezeršek, and J. Možina. Real-time 3D visualization of the thoraco-abdominal surface during breathing with body movement and
deformation extraction. Physiol. Meas. 36:1497–1516, 2015.
29. Redlinger, R. E., R. E. Kelly, D. Nuss, M. Goretsky, M. A. Kuhn, K. Sullivan, A.
E. Wootton, A. Ebel, and R. J. Obermeyer. Regional chest wall motion
dysfunction in patients with pectus excavatum demonstrated via optoelectronic
plethysmography. J. Pediatr. Surg. 46:1172–1176, 2011.
30. Remiche, G., A. Lo Mauro, P. Tarsia, D. Ronchi, A. Bordoni, F. Magri, G. P.
Comi, A. Aliverti, M. G. D’Angelo, and M. G. D’Angelo. Postural effects on lung and chest wall volumes in late onset type II glycogenosis patients. Respir.
Physiol. Neurobiol. 186:308–314, 2013.
31. Romei, M., M. G. D’Angelo, A. Lomauro, S. Gandossini, S. Bonato, E.
Brighina, E. Marchi, G. P. Comi, A. C. Turconi, A. Pedotti, N. Bresolin, and A.
Aliverti. Low abdominal contribution to breathing as daytime predictor of
nocturnal desaturation in adolescents and young adults with Duchenne
Muscular Dystrophy. Respir. Med. 106:276–283, 2012.
32. Rubin, M. B. A simplified implicit Newmark integration scheme for finite
rotations. Comput. Math. with Appl. 53:219–231, 2007.
33. Solav, D., V. Camomilla, A. Cereatti, A. Barré, K. Aminian, and A. Wolf. Bone
orientation and position estimation errors using Cosserat point elements and
least squares methods: Application to gait. J. Biomech. ,
2017.doi:10.1016/j.jbiomech.2017.01.026
34. Solav, D., M. B. Rubin, A. Cereatti, V. Camomilla, and A. Wolf. Bone Pose
Estimation in the Presence of Soft Tissue Artifact Using Triangular Cosserat
Point Elements. Ann. Biomed. Eng. 44:1181–1190, 2016.
35. Solav, D., M. B. Rubin, and A. Wolf. Soft Tissue Artifact compensation using
Triangular Cosserat Point Elements (TCPEs). Int. J. Eng. Sci. 85:1–9, 2014. 36. Vogiatzis, I., A. Aliverti, S. Golemati, O. Georgiadou, A. LoMauro, E. Kosmas,
E. Kastanakis, and C. Roussos. Respiratory kinematics by optoelectronic
plethysmography during exercise in men and women. Eur. J. Appl. Physiol.
93:581–587, 2005.
37. Zoumot, Z., A. LoMauro, A. Aliverti, C. Nelson, S. Ward, S. Jordan, M. I.
Polkey, P. L. Shah, and N. S. Hopkinson. Lung Volume Reduction in