Publisher’s version / Version de l'éditeur:
Vous avez des questions? Nous pouvons vous aider. Pour communiquer directement avec un auteur, consultez la première page de la revue dans laquelle son article a été publié afin de trouver ses coordonnées. Si vous n’arrivez pas à les repérer, communiquez avec nous à [email protected].
Questions? Contact the NRC Publications Archive team at
[email protected]. If you wish to email the authors directly, please see the first page of the publication for their contact information.
https://publications-cnrc.canada.ca/fra/droits
L’accès à ce site Web et l’utilisation de son contenu sont assujettis aux conditions présentées dans le site LISEZ CES CONDITIONS ATTENTIVEMENT AVANT D’UTILISER CE SITE WEB.
Building Research Note, 1982-05
READ THESE TERMS AND CONDITIONS CAREFULLY BEFORE USING THIS WEBSITE.
https://nrc-publications.canada.ca/eng/copyright
NRC Publications Archive Record / Notice des Archives des publications du CNRC : https://nrc-publications.canada.ca/eng/view/object/?id=f47e2724-5689-4c92-add5-52ee0c119295 https://publications-cnrc.canada.ca/fra/voir/objet/?id=f47e2724-5689-4c92-add5-52ee0c119295
NRC Publications Archive
Archives des publications du CNRC
This publication could be one of several versions: author’s original, accepted manuscript or the publisher’s version. / La version de cette publication peut être l’une des suivantes : la version prépublication de l’auteur, la version acceptée du manuscrit ou la version de l’éditeur.
For the publisher’s version, please access the DOI link below./ Pour consulter la version de l’éditeur, utilisez le lien DOI ci-dessous.
https://doi.org/10.4224/40000527
Access and use of this website and the material on it are subject to the Terms and Conditions set forth at
Multiple speakers in reverberation room measurements
1
I
I h Division of Building Research, National Research Council of Canada I
- - -. - -> -. --- -- - -- " -
W T I P L E SPEAKERS IN RF;VERBERATZON ROOM MEASUREMENTS
1
by 1 ANALYZED I A . C . C . WarnockI/
{IMULTIPLE SPEAKERS IN REVERBERATION ROOM MEASUREMENTS
by
A.C.C. Warnock
In reverberatlon room measurements af transmission loss and absorption coefficients, the sound s o u r c e is generally one or more
loudspeaker systems. Both ASTH methods dealing wlth these measurements (E90 and C423) (1,2) allow b u t do not actually recommend the use of
m u l t i p l e sound sources, nor d o they say anything about the methods of e x c i t a t i o n of multiple sources. In the current d r a f t revisian of IS0 R354(3), the I S 0 equivalent of C423 which a l s o deals with the
measurement of absorption, m l t i p l e speaker p o s i t i o n s are required. Also, measurements are to be repeated by operating each loudspeaker system coasecutively or by f e e d i n g each speaker independently ~ 5 t h
uncorrelated random noise. The current version of IS0 140/111(4)
actually a d v i s e s against the u s e of m u l t i p l e speakers. This Note
presents some measurements made f n the reverberation roams at the
D i v i s f o n of Building Research (DBR), National Research Council of Canada
(NRCC) t o examine the effects of multiple loudspeakers fn transmission l o s s and absorption measurements.
GENE= PROCEDURES
For all measurements, four loudspeakers were p l a c e d in the corners of the reverberatlon room being excited, Each speaker had its
a m power amplifier and independent pseudo-random n o i s e generator. Thus it was p o s s i b l e t o use each speaker on I t s own, all four together with the same and therefore correlated input, or a l l four together with
independent, uncorrelated inputs. The speaker cones, nominally 300 mm
in diameter, were mounted in horn enclosures wlth no separate high- frequency d r i v e r units. All measarements were made in acc~rdance with
the requLsements of ASTM E90, C423 and I S 0 140/~11, using a computer- c o n t r o l l e d testing apparatus which incorporated a real time analyser. Nine microphones were used in each raom to measure the space-averaged sound pressure level. Decays were averaged at each microphone in the r e c e i v i n g room to o b t a i n the mean room decay rate which in turn
d e t e d n e d room absorption,
TRPLNSMT SSION LOSS MEASUREHENTS
Transmission l o s s measuremeats w e r e made through a wall and a Eloar specimen to o b t a i n additional Information. k t a i l s of t h e
specimens used are n o t important for t h i s work and are not given here.
Transrnissfon lass measurements in this laboratory have routinely been made in one d i r e c t i o n only; t h a t is, one room fs designated as the
source room and t h e other a s t h e receiving room, For wall trausmfss;ion loss measuremeats the source room is normally the smallest room wfth a
volume of 6 5 m3 and the receiving room, also used for saund absorption measurements, is the largest room with a volume sf about 250 m3
.
Both of these r o o m , which wlll hereafter be called the small and large rooms respectively, are equipped with f i x e d and rotating d i f f u s e r s . F o r floortransmission l o s s measurements the smallest room becomes the receiving room and the room above, with a volume of 158 m3, becomes the source
room. This room, which will be referred to as the upper room, d i d not
have any diffusing elements. Far these experiments, the measurements
were made in b o t h directions to observe the differences, if any.
However, it was not possible t o make r e l i a b l e measurements Ln the
reverse d i r e c t f o n through t h e floor because of excessive n o i s e i n t m s i o n i n t o the upper room.
Figure 1 and T a b l e 1 show variations i n transmfssion loss
through the wall specimen wfth each speaker excited in turn and measured
from the small t o the large room. F i g u r e 2 and Table 2 show the
corresponding d a t a for measurements in the reverse d i r e c t i o n . Table 3 shows the variations observed f o r a floor transmission loss measurement
from the upper room to the lower.
In,
all three cases there wasconsiderable variation in the transmfssion loss values obtained wfth single speakers, fndtcating that a s i n g l e speaker of t h i s type does not
uniformly excite the room, The tables show, however, that there was almost no effect on sound transmfssion class (STC)(5) f o r these
specfrnens, although it is clear that for a specimen with an STC sating
determined by its low-frequency transmfssfon l o s s values and t h e 8dB rule(5), the STC could change by a f e w points.
T a b l e 4 compares the transmission loss values for both
correlated and uncorrelated e x c i t a t i o n of the loudspeaker s y s t e m , The differences between these two methods of excitatfon are not very great
and occur mainly at t h e l o w e r frequencies. Figure 3 , however, shms t h e
data for transmission from the small to the large room. The increase i n eransmFssion l o s s values at l m frequencies when correlated sources are
used indicates t h a t interference affects are causing spuriausly high results. Table 4 a l s o p e m d t s comparison of the transmisston l o s s
valves for the uncorrelated sources wfth those obtained by averaging the values i n Tables 1 t o 3 f o r the f o u r Individual speakers. It can be seen that in all three cases the agreement is e x c e l l e n t .
In p r i n c i p l e , if one accepts the need for m u l t i p l e speaker
systems, uncorrelated n o i s e sources are to be preferred since
interference effects are thus aveided. One also expects t o prodoce a
more zandon field in the source room and thus approach more c l o s e l y the ideal of a d i f f u s e sound f i e l d . Table 5 supports t h i s i d e a . It shows
t h e spatial standard deviation of the sound pressure l e v e l in the three source rooms when the four sources a r e uncorrelated and when they are correlated. Using uncosrelated excitation of multiple speakers clearly
leads to a more unfform sound field, thereby increasing the p r e c i s i o n of
the measurements.
Flgure 4 compares the measured transmission lasses f a r the two directions of measurement through the wall. One possible reason for the large discrepancies at low frequencies shown in t h i s graph is that t h e dimensions of the small room become comparable to the wavelength of
sound at
I w
frequencies. Another explanation canskdered I s that thedecay rates measured in the small room were being increased by sound
t ransmlssion through t h e specimen from the large room, in which sound decays more slowly, thus t e n d i n g to increase t h e adjustment f o r room absorption and the calculated values of transmission loss. To test t h i s
second hypothesis, a l l significant transmission from t h e large room
through the specimen was eliminated by c l o s i n g the a w i l i a r y lead-cored
door l o c a t e d between the room. T a b l e 6 shows the change in measured reverberation times and t h e resulting correction t h a t should be a p p l i e d to the calculated transmission loss.
It
can be seen that thedifferences in reverberation t i m e are s t i l l not sufficient to account
for the d i f f e r e n c e s between the transmission losses measured in the t w o directtons.
CONCLUSIONS I
These results demonstrate that there are good reasons for using
multkple speaker system in reverberation room transmission l o s s measurements and t h a t independent, uncorrelated n o i s e generators to power the speakers are a l s o to be preferred. The transmission l o s s
differences observed for single loudspeakers at the lover frequencies
can be explained q u a l i t a t i v e l y as inadequate excdtation of the lmer room modes. There are, however, some differences at the higher
f r e q u e n c i e s t h a t can perhaps be attributed to beaming from the
laadspeakers which, as has been stated, had no high-f requency driver u n i t s and were therefore poor approximations to p o i n t sources. Thus the recornendation i n IS0 140/111 that only a s l n g l e speaker be used does
n o t represent s t a t e o f - t h w a r t aeasurement procedures, e s p e c i a l l y in view of the comparatively low cost of pseudo-random noise generators, pmer amplfffers and speakers.
These results have led to the d e c i s i o n t o use multlple
independent speaker s y s terns in all f utuse transmission loss measurements in the reverberation rooms at DBR. They have also shown the need to exadne more c l o s e l y the transmission in both directions through t e s t
specimens. This vdll require constructing a new w a l l . in the upper room t o prevent the i n t r u s i o n of external n o i s e by way of t h e floor hatch
from the sample preparation area. Diffusing devices ~3.11 a l s o be i n s t a l l e d i n t h e upper room to increase the diffusivity of the sound f l e l d s
.
ABSORPTION MEASUREMENTS
UsPng the same four loudspeakers as in t h e transmission loss
measurements, a series of absorption measurements was carried o u t on a reference absorbing specimen. This specimen consisted of glass fibre batts 50 mm thick encased in an alurnfnum frame and faced on both sides with diamond-patterned, expanded aluminum mesh
-
one of a set of AMA reference specimens f i r s t introduced in 1964 under the a e g i s of ASTMcommittee 620 (now E33) and used in laboratory t e s t s performed accordfng
to ASTM C423. The specimen was supported on a wooden frame so t h a t its
(formerly identified as the Number 7 mounting) which is described in
ASTM E795 ( 6 ) .
Fifty sound decays w e r e ensemble averaged at each of the nine microphone positions. The program calculated t h e decay rate and
curvature f a r each ensemble average as well as the absorption
coefficients from the mean reverberation tlmes. Curvature is deffned a s (RbJRt-1) x 100% where Rb is the reverberation t h e calculated for t h e
bottom half af t h e decay and Rt is that for the t o p h a l f . The
repeatability 05 t h i s system permits one t o discern quite small differences between different experimental conf iguratiens w i t h a hPgh degree of confidence.
The differences in the mean room decay rates were generally small when the room was excited with I n d i d d u a l speakers or with
multiple speakers. The largest differences were observed in t h e lower
frequency bands. The mean reverberation times f o r all t e s t s in the
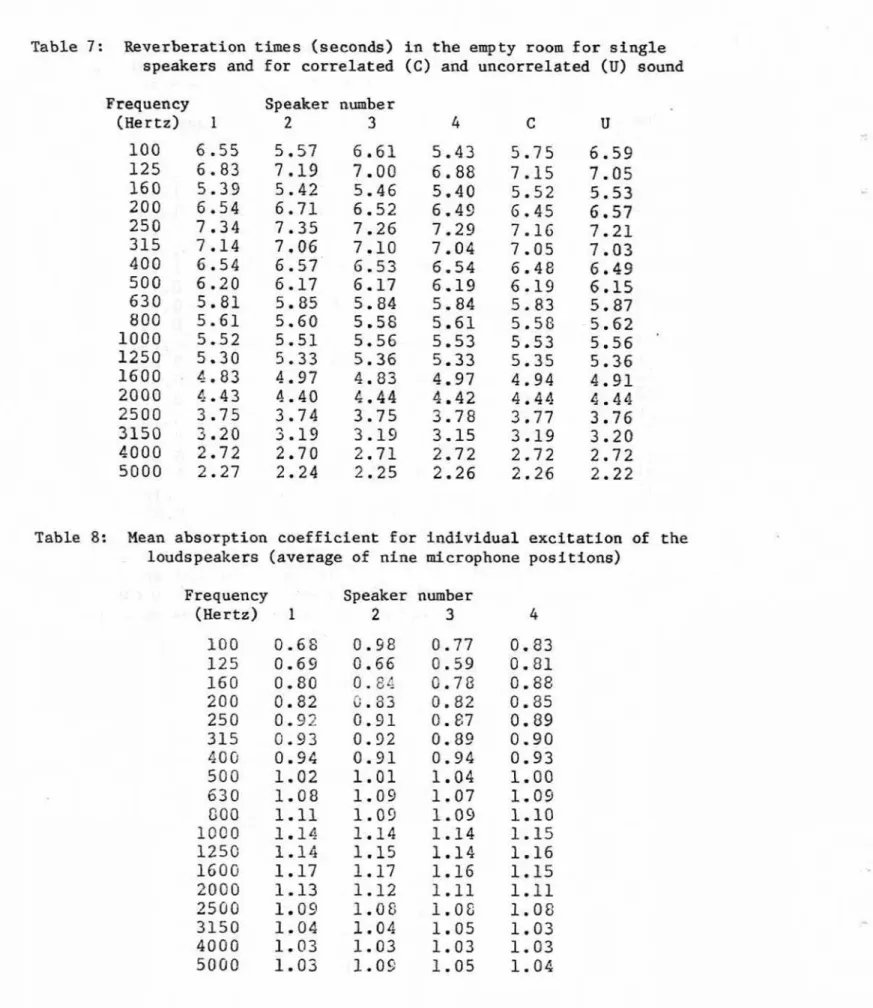
empty room are given in Table 7.
Since the room reverberation times, both w i t h and without the
specimen, are uaed to calculate the absorption coefficients, Z r is
necessary to look at these coefficients t o d e t e d n e the final effect of
the changes in procedure described above. Figure 5 and T a b l e 8 shaw the mean values of the absorption c o e f f i c i e n t obtained when the four
speakers are e x c i t e d i n d i v i d u a l l y . The differences are t y p i c a l l y greater than the repeatability of the measurements, e s p e c i a l l y in the m i d d l e and lower frequencies.
It must be borne in mind t h a t the use of nine microphones
i n
t h ereverberation room i n t r o d u c e s a consfderable amount of averaging.
Figure 6 displays the range af absorption coefflclents measured for two of the loudspeakers. In t h i s case the absorption coefficient for t h e
specimen was calculated for each microphone in turn and stored by the computer. F i g u r e 7 shows the a b s o l p t i s n coef ffcf e n t s for a single d+crophone when each of the four loudspeakers was used in turn.
Although these p l o t s do not r e a l l y have a d i r e c t bearing on the matter at hand, they do illustrate t h a t averaging over all the variables in reverberation room i s important and that microphone position is one of
the most sign5ficant of rhese variables.
T a b l e 9 compares the mean coefficient calculated f o r the
specimen using the data for each of the four speakers excsted
i n d i v i d u a l l y and compares thgs with the correlated and the uncosrelated cases. T h e r e are no significant differences between these values.
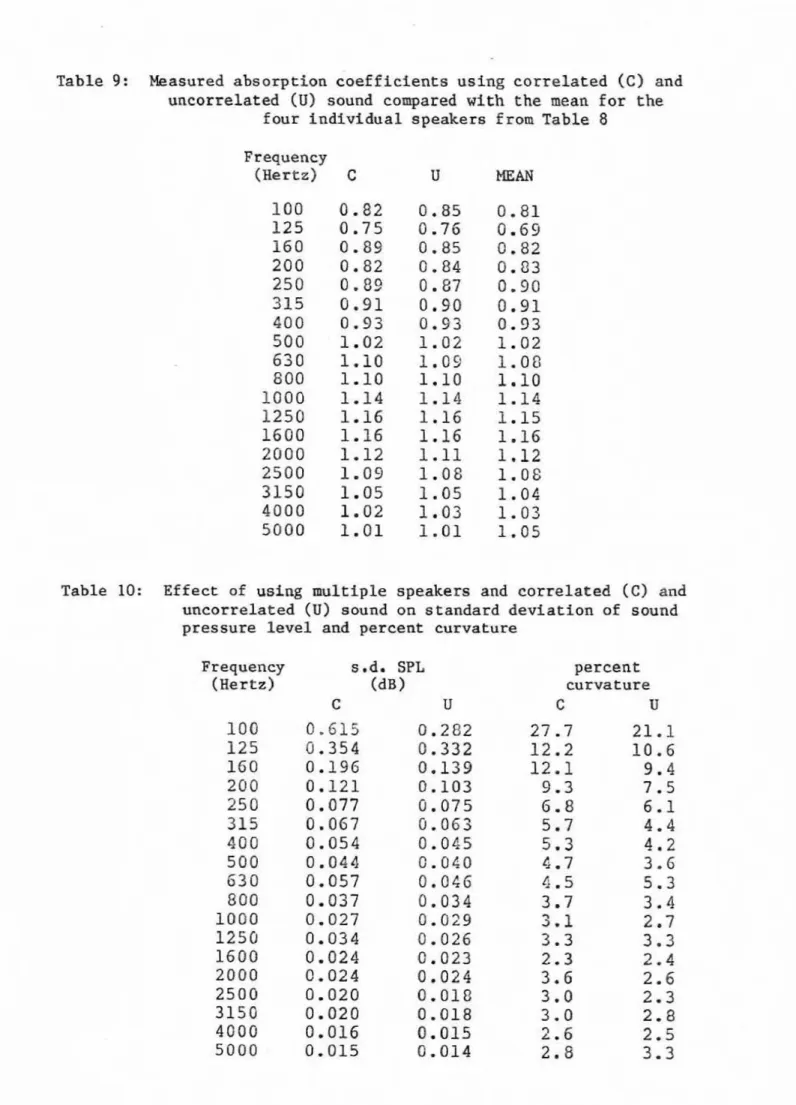
Table 10 shows the e f f e c t of using uncorrelated noise on the measured values of s p a t i a l standard devjlatf on of reverberation t i m e , as well as on the percent curvature. The data in the table were obtained
by averaging the results of 20 sets of data, 10 w i t h correlated
excitation of the speakers and 10 with uncasrelated excitation.
It
canbe seen that although there are some advantages in the use af the
uncorrelated multiple sources in conjunction w i t h a r o t a t i n g diffuser, they are quite small,
These experiments verify t h a t in a b s o r p t i o n measurements one
sees changes i n measured coefficients when the p o s i t i o n of any of the loudspeakers used in the measurements is changed. It is to be expected t h a t if the loudspeakers were a c t u a l l y moved, the changes observed would be at least as great, if not greater, since the room would be altered by
the movement. In these experiments, however, there was no physf cal movement of the loudspeakers. It is already known t h a t measured
absorption coefficients depend on the specimen and microphone positions.
The dependence on loudspeaker position is thus s i m p l y one more effect
t h a t m s t be averaged to improve t h e precision of the measurements.
The use of m l t i p l e speakers or speaker p o s i t i o n s as s p e c i f i e d
in the current draft of I S 0 354 t s thus j u s t f f i a b l e , On the b a s i s of the measurements in this experiment, one could perhaps argue that although m u l t i p l e speaker p o s f t i o n s are d e s i r a b l e , it is not r e a l l y necessary to use the speakers consecutively, and that the use of
uncorrelated noise excitation f o r m u l t i p l e speakers is not r e a l l y
essential. However, s i n c e t h e e f f e c t s of t h e m u l t i p l e speakers will be most noticeable at t h e lower frequencies and in reverberation soam t h a t are substantially smaller than the 250 rn3 of t h e DBR room, it is likely t h a t t h e requirements in I S 0 3 5 4 will a s s m e mch more importance.
OVERALL CONCLUSIONS
These measurements provide a justiftcatfan f o r the i n s t a l l a t i o n
in the NRC reverberation room of new speaker s y s t e m , each p r o v i d e d with low-frequency and high-frequency driver units to excite the room modes e f f e c t i v e l y at all frequencies. Four speakers are currensly planned for each room; however, is is n o t known from t h i s experiment
whether u s i n g more than f o u r speakers would result: in a significant irnprovcrnenr in p r e c i s i o n - Since It is r e l a t i v e l y sfmple to construct
pseudo-random noise generator;, each o f t h e speakers will be provided
w i t h i t s m n o i s e generator and power amplifier,
REFERENCES
(1) ASTM E90-75, "Standard method far laboratory measurement of
airborne sound transmisaton l o s s of b u i l d i n g p a r t i t i o n s " , American
S o c i e t y f o r Tesifng and Haterials, Philadelphia, 1975. (2) ASTM C423-81, "Standard test method f o r sound absorption
c o e f f i c i e n t s by the reverberarion room method", kmerican Society
f o r Testing and Materials, P h i l a d e l p h i a , 1981.
(3) I S 0 R354-1963, "Meesurernent of absorption c o e f f i c i e n t s in a reverberation room", International Organization f o r
Standardizatiod, Geneva.
( 4 ) IS0 140/3/111-1978, "Laboratory measurements of airborne sound ~nsulatlon of building elements", Geneva.
(5) EP43-73, "Standard classification f o r d e t e r m i n a t i o n of sound
transmission class", Amerfcan Society f o r Testing and Materials,
Table 1 : Transmission loss values f o r measurements through the w a l l from the small t o the large room using single speakers
Frequency Speaker number
(Hertz) 1 2 3 4
m
STC 24
T a b l e 2: Transmission loss values f o r measurements through the w a l l from t h e large to t h e small room u s i n g s i n g l e speakers
Frequency Speaker number
(Hertz) 1 2 3 4 MEAN
Table 3: Transmission l o s s values f o r normal measurements through a flour using i n d i v i d u a l speakers
Frequency Speaker number
(Hertz) 1 2 3 4 MEAN 8 0
100
1 2 5 160 200 250 315 400 5 0 0 G30 800 1000 1250l G O O
2000
2 5 0 0 3150 4 0 0 0 5 0 0 0 STCTable 4 : Transmissian loss values for measurements made with four loudspeakers using uncorselated
(u)
and correlated( c )
excitation compared with a mean of four individual s p e a k e r s Frequency small - large large-
small upper-
smallTable 7 : Reverberation t i m e s (seconds) in the empty room for s i n g l e speakers and for correlated I C ) and nncorrelated
(u)
sound Frequency(Hertz) 1
Speaker number
2 3
Table 8: Mean absorption coefficient for individual excitation of the loudspeakers (average of nine microphone pos it ions)
Frequency (Hertz) 1
100
1 2 5 160 200 250 315 4G(3 5 0 0 6 3 0 C O O 3000 1 2 5 01600
ZOO0
2500 3 1 5 0 4000 5 0 0 0 Speaker number 2 3Table 9: Measured absorption coefficients using correlated (C) end uncorrelated (U) sound compared with the mean far the
four i n d i v f dual speakers f rorn T a b l e 8 Frequency
(Hertz) C
Table 10: Effect of using multiple speakers and correlated ( C ) and
uncorrelated (U) sound on standard deviation 0 5 sound
pses sure l e v e l and percent curvature
Frequency s.d. SPL percent
(Hertz) (dB ) curvature
l [ l l l , t ~ l r ! ! ~ , ~ : # , !
100 200 500 1K Z K 5 K 113 OCTAVE CENTRE FREQUENCY, Hz F I G U R E I WALL TL FOR I N D l Y r D U A L S P E A K E R S - 65 m 3 TO 250 rn3 F R E Q U E N C Y , H z F I G U R E 3 W A L L T l F O R b 5 m 3 T O 250 m 3 F O U R C O R R E L A T E D S P E A K E R S
-
: F O U R U N C O R R E L A T E D S P E A K E R 5---
100 200 500 1 K 2K 5 K FREQUENCY. Hz F I G U R E 2 W A L L Til F O R S M D l V l D U A L S P E A K E R S - 250 m 3 T O 6 5 rn3 F R E Q U E N C Y . Hz F I G U R E 4 W A L L TL FOR T W O D I R E C T I O N S O F MEASUREMENT W l T H F O U R U N C O R R E L A T E D SOURCES ( L A R G E TO SMALL-
; S M A L L T O L A R G E ---*-0.5
5
100 200 500 P K Z K 5 K113 OCTAVE CENTRE FREQUENCY, Hz
F T G U R E 5 A B S O R P T I O N C O E F F I C I EMJS FOR I H D I V 1 D U A L S P E G K E R S (CIVERRGE O F N I N E M I C R O P H O N E P O S I T I O N S ) F R E Q U E N C Y . Hz A 8 5 0 R P T t O N C O E F F E C t ENTS FROM A S I N G L E M l C R O P H O N E F O R E A C H O F THE FOUR L O U D S P E A K E R S FREQUENCY. Hz M A X I M U M AND M l N l M U M V A L U E S OF A B S O R P T I O N C O E F F I C I E N T MEASURED I N THE ROOM FOR T W O L O U D S P E A K E R S - 20 400 200 500 1 K 2 K 5 K F R E Q U E N C Y , H z F I G U R E 8 D E C A Y C U R V A T U R E W l T H C O R R E L A T E D -I 3 A N D U N C O R R E L A T E D (---? E X C f T A T I O k ! O F F O U R S P E A K E R S