Publisher’s version / Version de l'éditeur:
Vous avez des questions? Nous pouvons vous aider. Pour communiquer directement avec un auteur, consultez la première page de la revue dans laquelle son article a été publié afin de trouver ses coordonnées. Si vous n’arrivez pas à les repérer, communiquez avec nous à PublicationsArchive-ArchivesPublications@nrc-cnrc.gc.ca.
Questions? Contact the NRC Publications Archive team at
PublicationsArchive-ArchivesPublications@nrc-cnrc.gc.ca. If you wish to email the authors directly, please see the first page of the publication for their contact information.
https://publications-cnrc.canada.ca/fra/droits
L’accès à ce site Web et l’utilisation de son contenu sont assujettis aux conditions présentées dans le site
LISEZ CES CONDITIONS ATTENTIVEMENT AVANT D’UTILISER CE SITE WEB.
Lighting Research and Technology, 14, 3, pp. 121-229, 1982
READ THESE TERMS AND CONDITIONS CAREFULLY BEFORE USING THIS WEBSITE. https://nrc-publications.canada.ca/eng/copyright
NRC Publications Archive Record / Notice des Archives des publications du CNRC : https://nrc-publications.canada.ca/eng/view/object/?id=7f13207e-3b9d-4e88-9789-5ad56cd7f66f https://publications-cnrc.canada.ca/fra/voir/objet/?id=7f13207e-3b9d-4e88-9789-5ad56cd7f66f
NRC Publications Archive
Archives des publications du CNRC
This publication could be one of several versions: author’s original, accepted manuscript or the publisher’s version. / La version de cette publication peut être l’une des suivantes : la version prépublication de l’auteur, la version acceptée du manuscrit ou la version de l’éditeur.
Access and use of this website and the material on it are subject to the Terms and Conditions set forth at
Calibration of subjective scaling responses
CALIBRATION O F SUBJECTIVE SCALING RESPONSES by M.S. Rea
Reprinted from
Lighting Research & Technology Vol. 14, No. 3, 1982
p. 121 - 129
DBR Paper No. 1076
Division of Building Research
On u t i l i s e d e p l u s e n p l u s 1 1 6 c h e l l e d 1 6 v a l u a t i o n s u b j e c t i v e p o u r d g t e r m i n e r l e s c a r a c t G r i s t i q u e s de 1 1 6 c l a i r a g e d e s i n t g r i e u r s , b i e n que peu d ' e f f o r t s a i e n t t f a i t s p o u r v a l i d e r l e s r g p o n s e s d e s s u j e t s . On s o u t i e n t que l e s c h e r c h e u r s q u i u t i l i s e n t 1 1 6 c h e l l e d 1 6 v a l u a t i o n s u b j e c t i v e d e v r a i e n t G t a l o n n e r d ' u n e f a ~ o n ou d ' u n e a u t r e l e u r s s u j e t s , 1 e s i d i o s y n c r a s i e s porlvant m o d i f i e r l e s r 6 s u l t a t s moyens. Dans l a p r E s e n t e e x p s r i e n c e , l a t 3 c h e e s t s o u m i s e 2 un c o n t r a s t e v a r i a b l e , e t l a p e r f o r m a n c e v i s u e l l e ( v i t e s s e e t p r E c i s i o n ) e s t 6valuEe e n m6me temps q u e l e s u j e t rgpond s u b j e c t i v e m e n t s u i v a n t u n e 6 c h e l l e s s m a n t i q u e e n s e p t p o i n t s . L e s p e r f o r m a n c e s d e s s u j e t s soumis 3 1 1 e x p i 5 r i e n c e s o n t s tSri5o t y p g e s ; l e u r s ri5ponses d 6 n o t e n t d e s i d i o s y n c r a s i e s , mEme s i c e r t a i n e s & v a l u a t i o n s s u b j e c t i v e s d e s p a r a m s t r e s e x p g r i m e n t a u x v a t i e n t d a n s l e &me s e n s q u e l e s p e r f o r m a n c e s . On a v a n c e q u e d e s m e s u r e s d e p e r f o r m a n c e s v i s u e l l e s p e u v e n t 6 t r e 1 i t i l i s 6 e s p o u r G t a l o n n e r d e s 6 v a l u a t i o n s s u b j e c t i v e s .
Summary Subjective scaling is being used more frequently to assess the lighting characteristics of interiors, although there has been little attempt to validate the responses that subjects provide. I t is argued that
investigators using subjective scaling should calibrate their subjects in some way because idiosyncratic responses can alter averaged scaling estimates. In this experiment task contrast was varied and estimates of visual performance (speed and accuracy) were collected simultaneously with subjective responses on seven-point semantic scales. Subjects exhibited sterotypical behaviour on the performance measures; their scaling responses were quite idiosyncratic, although some subjective responses to the
experimental parameters varied like the performance responses. I t is argued that visual performance measures could be used to calibrate subjective scaling responses.
Calibration of subjective scaling responses
M. S. REA
1 Introduction
Subjective scaling has become a widely used technique in measuring the properties of objects or environments, for example such attributes as the brightness of tasks1 or the spaciousness of rooms2. In most other areas where measurement is
important a great deal of attention is placed upon standardising the units and tools for assessing object attributes, but with subjective scaling there has been little, if any, discussion about calibrating the responses of observers. I t would appear that in most contemporary studies face validity alone dictates the acceptance of subjective scaling data in 'quantifying' the properties of objects and
environments.
I t is fairly obvious that an observer's responses can be influenced by a variety of parameters, some of them superfluous to the task at hand. For example, having a fight with one's spouse might influence the behaviour of a subject in a scaling experiment, yet it is unlikely that this factor is of interest to the investigator trying to define a perceived brightness function. Without suitable checks he. calibration) an investigator cannot validate the subject's response. If data from a subject who cannot or will not attend to brightness are included with those of other subjects, it can lead to
erroneous interpretation of how people perceive brightness.
The calibration of a subject in a scaling experiment can be much like the calibration of a photocell, where a systematic relation must be found between response under unique situations and response Dr. Rea is with the Energy and Services Section,
Division of Building Research, National Research Council of Canada.
The paper was first received on 3 November 1981, and in revised form on 1 March 1982.
under a standard set of conditions. Thus, when subsequent measurements are made with the cell, its response can be placed in some orthodox context. As with a photocell, a person's responses in subjective scaling could be calibrated if they could be related to responses under a standard set of conditions.
Visual performance measures based upon speed and accuracy have been used to indicate the response of the human perceptual system to complex, realistic ~ t i m u l i . ~ - ~ As such, these response functions may be regarded as a basis for gauging visual processing by human subjects (for example, work by Weston3 has been used to recommend illumination levels in Great Britain). Subjective scaling responses to visual parameters could be calibrated if they could be correlated with visual performance data under comparable conditions. I t is not mandatory that the responses in subjective scaling be linked only to those from visual performance experiments, but without a calibration of this type to some kind of measure it is impossible to decide unequivocally whether the subjective scaling responses are produced from the variable important to the investigator or from extraneous parameters. This paper deals with the calibration of observers' responses in a subjective scaling experiment. Responses of the same observers under the same stimulus conditions in visual performance and scaling experiments are compared. These comparisons illustrate some of the problems associated with using subjective scaling when observers' responses are not calibrated. 2 Procedures
Subjective scaling data were collected in
conjunction with a visual performance experiment. Briefly, the subject's task in the performance experiment7 was to compare two number lists as
Vol. 14 No. 3 1982 121
?5SIQ&o
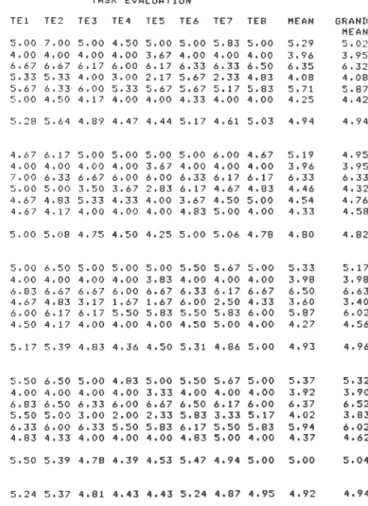
-
POST B L O C K R A T I N G F O R M E X P E R I M E N T N A M E S U B J E C T D A T E S E S S I O N B L O C K F E E L I N G S . I N D I C A T E H O W Y O U FELT D U R I N G THE P R E C E D I N G B L O C K O F T R I A L S F 1 B A D :-:-:--- : G O O D F 2 TENSE :-- - - - - : R E L A X E D F 3 S L E E P Y :-:-:-;-!---- : ALERT F 4 T I R E D RESTED F 5 U N C O M F O R T A B L E , ! : ! : : : C O M F O R T A B L E F 6 D I S C O U R A G E D : : : : : : : : S A T I S F I E D T A S K E V A L U A T I O N : I N D I C A T E Y O U R O V E R - A L L E V A L U A T I O N OF THE T A S K A N D E N V I R O N M E N T FOR THE P R E C E D I N G B L O C K O F T R I A L S B A D D I F F I C U L T U N P L E A S A N T S U B D U I N G T I R I N G D I M H A Z Y F R U S T R A T I N G - - - G O O D - - - : E A S Y --- : P L E A S A N T - - - : S T I M U L A T I N G I - - - : R E L A X I N G --- . B R I G H T : C L E A R - - - , S A T I S F Y I N G C O M M E N T S :
Fig. 1. Post block rating form.
quickly and accurately as possible. The contrast of the stimulus materials was changed before each trial by realistic techniques (see below).
Illumination was provided by a single luminaire (aperture 95x95 cm) and kept constant a t the centre of the subject's task for the entire
experiment. A performance score was calculated from both speed and accuracy measures.
Two sets of 7-point semantic scales similar to those
employed by Flynn et a18, Hawkes et a1 and
McKennan et a1 lo were used in the scaling
experiment. One set of six scales dealt with how the subject felt during the preceding "half-block" of performance trials; the other set of eight scales dealt with the subject's evaluation of the task and
environment for the same half-block (Fig. 1). The
two scaling sets were identical to those employed by Smith and Real in a similar visual performance experiment. Dividing the scales into two distinct sets was designed to help subjects more clearly differentiate their evaluation of the task from assessment of personal feelings. All scales were intended to have negative valence terms on the left and positive valence terms on the right; the better the perceived value of the attribute the higher the scale value.
Each half-block change corresponded to a change in the illumination angle or degree of polarisation of illumination. Two illumination angles were produced by rotation of the subject's work desk
about the centre of the task (0 degree veiling reflection angle and 90 degree illumination from the subject's left). Three degrees of vertically polarised illumination were produced by different luminaire panels (Plexiglas and mylar, PM, approximately
4 per cent; multilayer polariser, MP, approximately
20 per cent; linear dichroic polariser, LP, approximately 100 per cent). Two illumination angles and three degrees of polarisation produced six unique combinations; each was assigned to a half-block. Four randomly distributed examples of each type of reference sheet (black matte, black gloss, grey matte and grey gloss) were presented in a half-block. Each of the six subjects gave scale
evaluations (Fig. 1) immediately following a half-
block and before changing the illumination angle and degree of polarisation for the next half-block. Subjects did the task and the scalings during twenty-four half-blocks; six half-blocks were completed in each of four sessions. One morning and one afternoon session were conducted on two consecutive days. All experimental conditions were presented in a counterbalanced, randomised design. Further details regarding stimuli, observers and
experimental protocol may be obtained in Ref. 7.
3 Results
The basic data are given in Tables 1 and 2; entries
are means. Those in Table 1 are based upon
responses for the six half-blocks, and those in Table
Table 1. Subjective scaling results; half-blocks
FEELINGS TASK EVALUATION
SUBJECT F l F2 F 3 F4 F5 F 5 MEAN T E I TEZ TE3 TE4 TE5 TE6 TE7 TE8 MEAN GRAND MEAN 0 DEGREE S 1 4.75 5.00 4.75 4.50 5 . 0 0 5.00 4.83 4.75 6.50 5.00 5 . 3 0 5.00 5.25 5.75 5.00 5.28 5.09 PLEXIGLAS5 t MYLAR 52 4.00 4.00 4.00 3.75 4.00 4.00 3.96 4.00 4.00 4.00 4.00 3.75 4.00 4.00 4 - 0 0 3.97 3.96 S 3 6 . 7 5 6 . 2 5 6 . 7 5 6.53 6.25 6 - 2 0 6.42 7.00 6 . 0 0 6 . 0 0 6.00 6.00 7 - 0 0 5.25 5 . 5 0 6 - 0 9 6.23 54 5.50 6.00 4.50 3 . 2 5 4.50 4.50 4.71 5.75 5.25 4.50 3.00 3.50 5.25 3.25 4 - 7 5 4.41 4.54 55 5.00 5 . 5 0 4 . 5 0 5 . 0 0 5.00 5.25 5.04 4.75 4 - 7 5 5.50 4.25 4.75 3.75 3.50 4.75 4.50 4.73 S 6 5 . 0 0 5 . 0 0 4.75 4.75 4.75 4.50 4.79 4.50 3.75 4.00 4.00 4.00 5 - 0 0 4.75 4 - 0 0 4.25 4.48 MEAN 5.17 5 . 2 9 4.87 4.62 4.92 4.87 4.96 5.12 5.04 4.83 4.37 4.50 5.04 4.42 4.67 4.75 4.84 0 DEGREE LINEAR POLAROID MEAN 5 . 0 0 5.00 4 . 5 8 4.67 5.21 5.00 4.91 5.17 5.25 4.83 4.50 4.50 5.25 4.79 4.87 4.90 4.90 93 DEGREE 51 5.25 5 . 2 5 5 . 0 0 4.75 5.25 5 . 0 0 5.08 5.25 6.75 5.00 5 . 0 0 5.00 5.25 5.75 5 . 0 0 5.37 5 - 2 5 PLEXIGLASS t MYLAR 52 4.00 4.00 4.00 3.50 4 . 0 0 4.00 3.92 4.00 4.00 4.00 4.00 3.50 4.00 4.00 4.00 3.94 3.93 5 3 7.00 6.75 6.50 6.50 6 . 2 5 7.00 6.67 7.00 7.00 7.00 6.00 6.50 6.00 7.00 7.00 6 - 6 9 6.68 54 4.25 5.75 3 . 5 0 2.00 3.75 5.75 4.17 5.25 5.75 3.75 3 . 7 5 2.00 6.00 3.00 5.00 4 - 3 1 4 - 2 5 S 5 5.75 6 . 2 5 5.25 5.50 5.75 6.25 5.79 6 . 2 5 6.25 6 . 2 5 5 . 0 0 5.50 6.25 6 - 5 0 6.00 6.00 5.91 5 6 5.00 5 . 0 0 4.75 4.75 5.00 4.25 4.79 5.00 4 - 7 5 4 . 0 0 4.00 4.00 4.50 4.75 4.00 4.38 4.55 ME AN 5 . 2 1 5.50 4.83 4.50 5.00 5.37 5.07 5.46 5 - 1 5 5.00 4.62 4.42 5.33 5.17 5.17 5.11 5 - 1 0 90 DEGREE S 1 5 - 2 5 5 - 9 0 4 - 7 5 4.75 5.00 5 . 0 0 4.96 5.25 7.00 5 . 0 0 5.00 5.00 5 - 5 0 6 . 2 5 4.75 5.47 5.25 MULT ILAYER POLAR010 52 a - 0 0 4.00 4 . 0 0 3.00 4 . 0 3 4 . 0 0 3.83 4.00 4.00 4 . 0 0 4.00 3.00 4.00 4.00 4.00 3.88 3.86 S3 7 . Q C E . 7 5 7.00 6.25 6 - 5 0 7 . 0 0 6.75 7.00 7.00 6.50 6.00 6.50 6 - 0 0 7.00 7.00 6.63 6.68 54 2 - 7 5 4 - 0 0 3.50 2 . 2 5 2 - 7 5 5.50 3.46 5.25 4 - 7 5 3.00 2.25 2.00 6.00 2.50 5.25 3.87 3 - 7 0 5 5 6 - 0 0 6.50 5.7'3 6.75 6 - 0 3 6 - 0 3 6.08 6.00 6 - 5 0 6.00 5.25 5.75 6 - 0 0 6.25 6.00 5.97 6.02 56 5 . 0 0 5 . 0 0 5 . C 3 4 - 7 3 5.00 5 . 0 0 4.96 5 . 0 0 5.00 4.25 4.00 4.00 4.25 4.75 4.00 4.41 4.64 MEAN 5.00 5 . 2 1 5.00 4.54 4 . 8 7 5.42 5.01 5 . 4 2 5 - 7 1 4.79 4 . 4 2 4.37 5.29 5.12 5 . 1 7 5.04 5.02 90 DEGREE LINEAR POLAROID MEAN 5 . 1 2 5.17 4.71 4.67 5.00 5.42 5 - 0 1 5.33 5.62 4.87 4.29 4 - 4 2 5.17 5.21 5.04 4.99 5.00 OVERALL MEAN 5.09 5.19 4.77 4.62 4.94 5.20 4.97 5.24 5 - 3 7 4 . 8 1 4 . 4 3 4.43 5.24 4.87 4 - 9 5 4.92 4.94
2 are based upon responses for the four between average visual performance scores and
experimental sessions. F1 to F6 and TE1 to TE8 average task evaluation values, but there was not a
correspond to each 'feeling' scale and each 'task significant correlation between performance scores
evaluation' scale, respectively, numbered from first and feeling values. One,might conclude that, on
to last in the two sets (Fig. 1). average, subjects' task evaluation responses were
Typically (and in this experiment as well), influencing performance but that their feeling based-upon the same parameters as those
numerical values are given to stimuli (e.g. by a tick responses were not.
mark on a pre-drawn scale) by several subjects,
using a variety of scales. One usually tries to Fig. 3 shows a similar plot of the visual
simplify matters by averaging across subjects and performance data with scaling data for the four
scales under the assumption that these variables experimental sessions. In this case there was not a
are replicatesll. To test the replication assumptions significant correlation between performance scores
the data averages were broken down by subject, by and either task evaluation or feeling values.
scale, and by subject and scale. The averaged data and each breakdown are presented in turn.
3.1 Averaged data
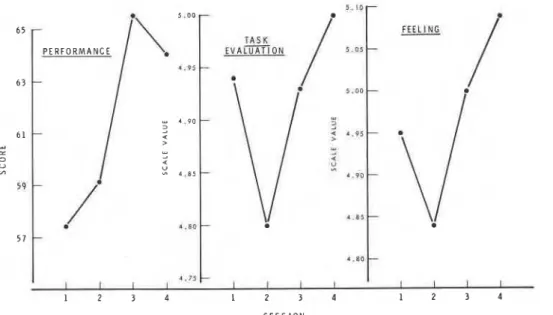
The averaged visual performance data are shown in
Fig. 2, with averaged subjective scaling data for the
six half-blocks (two orientations by three types of luminaire panels). Scaling responses were averaged across all subjects but separately across the scales for task evaluations and feelings. There was
significant correlation (r = 0.955, p
<
0.01)**Correlations were obtained between paired performance score and scaling means across half-blocks or across sessions. Significance tests were based upon the students'
't' distribution and N-2 degrees of freedom (4 df for half- blocks, and 2 df for sessions).
One might conclude that, again on average, subjects' average task evaluation and average feeling responses were not influenced by the same factors that influenced average performance in the sessions. One can see from Fig. 3, however, that there is a clear correlation between feeling and task
evaluation values (r = 0.953, p
<
0.01). indicatingthat session effects influence subjects, on the average, in the same way for feeling and task evaluation responses. This perhaps indicates a lack of differentiation between feelings and task
evaluations by subjects across sessions.
3.2 Breakdown by subject
Subjects' performance data obtained during the six half-blocks are more homogeneous than their scaling data under the same conditions (Fig. 4).
Table 2. Subjective scaling results; sessions F E E L I N G S SURJECT F 1 F 2 F 3 F 4 F5 F 6 MEAN S E S S I O N 1 S 1 5 . 0 0 5 . 0 0 4 . 0 0 4 . 1 7 5 . 0 0 4.83 4.67 S -7 4 . 0 0 4 . 0 0 4 . 0 0 3 . 6 7 4.00 4.00 3 . 9 4 5 3 6 . 8 3 h , 1 7 6 . 1 7 6 . 0 0 5 . 8 3 6 . 6 7 6 . 2 8 S 4 4 . 1 7 5 ' 0 0 3 . 8 3 2 . 1 7 4.17 5 . 1 7 4.08 S 5 5 . 0 0 6 . 3 3 6 . 0 0 h . 3 3 5 . 6 7 6 . 1 7 6 . 0 8 5 6 5 . 0 0 5 . 0 0 4 . 1 7 4.00 5 . 0 0 4 . 6 7 4.64 TASK E V A L U A T I O N G H AN11 MEAN 5 . 0 2 3 . 9 5 6 . 3 2 4 . 0 8 5 . 8 7 4 . 4 2 MEAN 4 . 9 7 4 , 0 9 4.83 4.56 4 . 6 9 5 . 0 8 4.84 5 . 0 0 5 . 0 8 4 . 7 5 4 . 5 0 4 . 2 5 5 . 0 0 5 . 0 6 4 . 7 8 4 . 8 0 4 . 8 2 MEAN 5 . 3 1 5 . 1 4 5 . 0 0 4.78 5 . 0 3 5 . 2 8 5 . 0 9 5 . 5 0 5.39 4 . 7 8 4 . 3 9 4.53 5 . 4 7 4.94 5 . 0 0 5 . 0 0 5 . 0 4 OVERALL HEAtJ 5 . 0 9 5 . 1 9 4 . 7 7 4 . 6 2 4.94 5 . 2 0 4.97 5 . 2 4 5 . 3 7 4.81 4 . 4 3 4 . 4 3 5 . 2 4 4.87 4 . 9 5 4 . 9 2 4 . 9 4
Only the absolute level of visual performance for subject No. 4 was substantially different from that of the other five subjects; his relative visual performance was similar to theirs (see below). I t would appear that subjects are quite different in their scaling responses yet similar in their visual performance responses. Further, only subject No 3 had scaling responses similar to her visual
performance responses (r = 0.982, p
<
0.001) and to the visual performance responses averagedPERFORMANCE 2 Y A - 0 " . PM .A* B - 0 " . M P C - on. LP D - 90". PM E - 9 0 ° . M P F - 90". LP
across all subjects (r = 0.974, p
<
0.001). Because only one subject's task evaluation scale responses correlated with performance, one might conclude that the significant correlation mentioned above between average performance and average task evaluation scalings was fortuitous. This point is amplified in Fig. 5. Deleting an individual subject's data can seriously affect the shape of the scaling curves and thus the conclusions one might reach about all subjects' subjective impressions of theHALF-BLOCK
Fig. 2. Visual performance and subjective scaling data for the six experimental half-blocks averaged across subjects and scales.
S E S S I O N
Fig. 3. Visual performance and subjective scaling data for the four experimental sessions averaged across subjects and scales.
P E R F O R M A N C E
-
PI g 55 A - 0 ' . PM VI B - O 0 . M P C - 0 " . L P 5 0 D - 9 0 " . PM z E - 90". M P T A S K - / / - 6 . 0i
5 . 5 i3 . s t l ,
1 , 1 SUBJECT 0.1 .-4 0 - 2 A.5 35 4 ~ 1 , 1 1 11 .O 1 0 - 3 A - 6 2 . 5 A B C D E F A B C D E F 3 - 0 1 I I,
*
A B C D E F H A L F - B L O C KFig. 4. Visual performance and subjective scaling data for the six experimental half-blocks averaged across scales but not across subjects.
0 A L L S U U l E C T S FEEL 1 NG ,.a*@ - ,* I' --*' - P - ' I I I I l l d . 5 t l I I I I I I 1 I I l I A B C D E F A B C D E F A B C D E F H A L F - B L O C K
Fig. 5. Deletion of some subjects' data from the averaged data in Fig. 2.
T A S K EVALUATION cr--& H--.~ F E E L I N G ,+--a / 1 2 3 4 1 2 3 4 1 2 3 4 S E S S I O N
Fig. 6. Visual performance and subjective scaling data for the four experimental sessions averaged across scales but not across subjects.
H A L F - B L O C K
Fig. 7. Visual performance and subjective scaling data for the six experimental
half-blocks averaged across subjects but not across scales.
experimental conditions. This is in contrast with deletion of the performance data for the same subjects; deletion shows little effect on the relative
performance curves.
*
Results similar to those obtained across half-blocks were also obtained across sessions. Performance data for the six subjects were quite similar, although the subjective scaling data for both task evaluations and feelings were idiosyncratic (Fig. 6). This examination also leads one to doubt the validity of averaging across subjects' scaling data because of the marked dissimilarities across sessions. As with the half-block data, only subject
No. 3 had a significant correlation between
performance scores and scale values across sessions. In this case, however, it was the average feeling
*The absolute number of data points deleted in Fig. 5 are different for performance and for scaling responses, but the proportion of data deleted is the same.
scale values that correlated well with her visual
performance during the sessions (r = 0.970, p
<
0.05) and with the average visual performance for
all subjects during the four sessions (r = 0.994, p
< 0.01).
In sum, then, averaging subjects' visual
performance data for the six half-blocks and the four sessions seems appropriate because the relative performance data are so similar. On the other hand, averaging subjective scaling data across subjects seems inappropriate because their data are so idiosyncratic. Further, only one of six subjects (S3) had subjective scaling responses that seemed to be influenced by the same parameters affecting visual performance. (For the six half-blocks this subject's
perceptions were reflected in the over-all task
evaluation averages; for the four sessions her
perceptions were reflected in the feeling scale
averages.) Averaging across subjects' scaling responses can, therefore, be risky; unless
unperceptive or uncooperative subjects' responses conditions. The differences among subjects and are averaged out the idiosyncratic behaviour of their use of the seven-point scales are revealed in
these subjects can alter the scaling response curves this tabIe. Subjects 2 and 4 gave no scale values and thus the inferences drawn about the factors that could confidently be correlated with
influencing subjective responses. performance. Yet there were marked dissimilarities
in the behaviour of the two. Subject No. 2 marked
3.3 Breakdown by scale
Examination of individual scales, averaged across subjects, provides a result similar to that drawn for averaging across subjects. Fig. 7 shows
performance scores with task evaluation and feeling rating scales for the six half-blocks. Most scaling curves were not similar to the performance curve, but four task evaluation scales show a significant correlation with performance. Specifically, the scales T E l , 'bad-good' (r = 0.874, p
<
0.05), TE2, 'difficult-easy' (r = 0.946,<
0.01), TE7, 'hazy- clear' (r = 0.994, p<
0.001), TE8, 'frustrating- satisfying' (r = 0.905, p<
0.02) have shapes similar to those for performance. None of the feeling scale curves resembled those for performance across half-blocks.Only one feeling scale, 'tired-rested' (F4). is similar to that for performance across sessions (r = 0.952, p
<
0.05). No task evaluation scales were similar to performance scales across sessions. I t wouldtherefore be inappropriate to average across scales in many cases because scales, like subjects, do not always appear to be replications.
3.4 Breakdown by scale and subject
Table 3 shows the important relations between visual performance and scaling for each subject and each scale. Entries are the significant correlations (p
<
0.01) between scaling responses and visual performance responses under the same experimentalTable 3. Correlations and significance probabilities between visual performance and each rating scale for each subject*.
HALF-BLOCKS
Scale Correlation Significance
Subject 1 bad-good (Fl) 0.9301 0.004
bad-good (TE1) 0.9911 0.001
Subject 3 discouraged- satisfied 0.9224 0.004
difficult -easy 0.9766 0.001 unpleasant -pleasant 0.9109 0.006 dim
-
bright -0.9816 0.001 hazy -clear 0.9821 0.001 frustrating-satisfying 0.9885 0.001 Subject 5 bad-good (Fl) 0.8804 0.010 tense-relaxed 0.9797 0.001 bad-good (TE 1) 0.9345 0.003 difficult -easy 0.9885 0.001 tiring -relaxing 0.9571 0.001 hazy - clear 0.9312 0.003Subject 6 bad-good (TE1) 0.9874 0.001
difficult -easy 0.9719 0.001
dim- bright -0.8876 0.009
SESSIONS
Subject 3 tired -rested 0.9944 0.003
uncomfortable-comfortable 0.9988 0.001
Subject 4 discouraged - satisfied -0.9845 0.008
*Only the probabilities of chance less than or equal to 0.01 are included.
the fourth interval on the scales almost exclusively throughout the experiment (Tables 1 and 2); on the other hand, subject No. 4, whose results also lacked any clear correlation between scaling and
performance responses, was extremely erratic in his
scaling responses. I t is probably by chance alone that his responses on F6 'discouraged-satisfied', Table 3, were correlated significantly with his visual performance scores across sessions. Two facts support this hypothesis. First, no other scaling response from this subject was correlated with performance, even for those scales that were
effectively used by the other subjects (e.g. TI31 and TE2, Table 3). Second, it is unlikely that the factors leading to better performance by this subject would also lead to more 'discouragement' on his part, as implied by the negative correlation between responses in F6 and those in visual performance. Two subjects, S3 and S5, used the scales very effectively, based upon the number of scale responses that were correlated with performance under the same conditions. Subject No. 3 was probably the 'best' subject because she exhibited several significant correlations between visual performance and scaling responses across the six half-blocks and across the four sessions. Her scaling behaviour was so consistent for the half-blocks that it was revealed in her average scaling responses (Section 3.2). As well, this subject was the only one to exhibit scaling responses (F4 and F5) similar to performance responses across the four sessions.
Subject 5's responses to several scales also correlated well with performance, but unlike those of subject 3 they were not consistent enough to produce a correlation between her average scaling responses and her performance responses. I t should be noted that subjects 3 and 5 did not always use the same scales in the same manner. This indicates that while they were basing their scaling responses on the same experimental parameters, as indicated by common correlations with performance, they were using different vehicles (i.e. scales) to express them.
Although subjects 1 and 6 used some of the scales effectively, fewer scales correlated with performance than did those from subjects 3 and 5. The former two subjects seemed to prefer (based upon a high level of significance) the 'bad-good' task evaluation scale (TE1) to scale the experimental parameter (contrast) associated with half-block changes (as had subject 5). Subjects 1 and 5 used the 'bad-good' feeling scale ( F l ) in the same way. Like the
averaged scaling responses across sessions (Section 3.1) this may be another indication that these subjects did not clearly differentiate between task evaluations and personal feelings.
This hypothetical inability of some subjects to be objective in separating 'feelings' from 'task
evaluations' in scaling responses could have serious consequences for those assuming that scaling responses are unbiased. This has been a topic of discussion for many years12 and one that must be considered when the responses of subjects in scaling experiments are applied. In short, without proper calibration procedures one cannot be sure that subjects' responses are unbiased.
A special note should be made of the 'dim-bright' scale (TE6). Subjects 3 and 6 had a high negative
correlation between responses on this scale and performance across the six half-blocks. Before conducting the experiment the author had assumed that the subjects' scaling responses would pertain to their perceptions of background brightness (which was kept constant throughout the experiment). This assumption was based upon subjects' responses in an earlier experiment1 in which background luminance was changed experimentally. I t appears from the results
obtained in this experiment, however, that the two subjects were evaluating the experimentally manipulated target-brightness. Importantly, then, an investigator's intended meaning for scales like brightness, spaciousness or comfort may not be interpreted in the same way by the subjects. Flynn
et a18 pointed out that the investigator must sometimes rely upon his own 'ingenuity and background knowledge' to ascertain the bases of subjective scaling responses. This reliance upon one's own creativity and experience for
interpretation is actually a form of subjective scaling by the investigator and therefore can be potentially biased. (The responses on the 'dim- bright' scale in this experiment are examples of this investigator's incomplete background knowledge). A calibration procedure reduces the subjectivity needed by the investigator and thus allows a more
objective assessment of subjects' reasons for responding.
4 Conclusions
This experiment indicates that subjects use scales differently. Some used scales effectively, although several used different scales to reflect the same perceptions. One subject did not use the scales to indicate any change in experimental parameters, but almost exclusively marked one interval on all scales throughout the experiment. Another subject was so erratic in his responses that he seriously altered the shape of the average response curves. Finally, in evaluating the same aspect of a task, two subjects exhibited a negative correlation between visual performance and responses on one scale and a positive correlation between
performance and responses on other scales. Averaging these idiosyncratic scaling responses eliminated many of the subtle yet important differences in scaling behaviour. I t was therefore concluded that in many cases it is erroneous to assume, without checks (i.e. a calibration procedure), that subjects and scales can be considered replications.
5 Discussion
The major advantage of subjective scaling is that aspects of the environment not readily measurable by electrophysiological or psychophysical
techniques yet potentially influential to the over-all effectiveness of a room (like pleasantness or
spaciousness) can be evaluated. In this experiment subjects were required to make assessments of task characteristics associated with contrast (across the six half-blocks) or with learning and fatigue (across the four sessions). Perhaps these are less interesting requirements for subjects, but they can be
calibrated against a performance measure.
Without a calibration of scaling responses it is not possible to ascertain unequivocally whether
subjects are influenced by experimental parameters or by extraneous factors. I t may be difficult to find an independent measure of, say, pleasantness or spaciousness that could be used to calibrate
subjective scaling responses to these environmental characteristics. Nevertheless, another set of scaling responses obtained under standard conditions might be used to compare (i.e. calibrate) subjective scaling responses under new, untested situations. At the very least, it seems prudent in light of the large individual differences obtained in this experiment to cull subjects who cannot or will not use subjective scales with less esoteric, yet testable, changes like photometric contrast. Although, it is possible that subjective responses calibrated in this manner may not reflect more complicated
environmental aspects like pleasantness or spaciousness, it is much more likely that these subjects can make subjective assessments than can subjects who do not demonstrate sensitivity by any testable criterion.
Finally, it seems worth considering the
establishment of standard calibration procedures Lighting Research & Technology
for subjective scaling. Firstly, it would eliminate References contamination of results by uncooperative,
unperceptive or misunderstanding subjects.
Secondly, i t would facilitate comparisons of results obtained by other laboratories. The specific criteria chosen to calibrate subjects, whether with
performance measurements or other means of scaling, need to be addressed by a large community interested in lighting design engineering. I t seems wise, meanwhile, to avoid using subjects a s scaling instruments without demonstrating first that they are sensitive to the variables manipulated by the investigator.
Acknowledgments
The author would like to thank B. Guzzo for running subjects, A. Hsu for computer assistance, and P. Boyce for his comments on the manuscript. This project was funded jointly by the Illuminating Engineering Research Institute of North America and by the National Research Council of Canada, Division of Building Research.
Smith, S. W. and Rea, M. S., Presented a t 19th CIE Session, Kyoto, Paper No. P-79-35 (1979). Flynn, J. E. and Spencer, T. J., J. Illum. Engng. SOC. 6 (3). 167 (1977).
Weston, H. C., Industrial Health Research Board, HMSO, London, Report 87 (1945). Bodmann, H. W., Int. Light. Rev., 13, 41 (1962). Boyce, P. R., Ltg. Res. & Technol., 5 (3), 125 (1973).
Smith, S. W. and Rea, M. S., J. Illum. Engng. SOC., 8 (1) 47 (1978).
Rea, M. S., J. Illum. Engng. Soc., 10 (93) (1981). Flynn, J. E., Hendrick, C., Spencer, T. and Martyniuk, O., J. Illum. Engng. Soc., 8 (2), 95 (1979).
Hawkes, R. J., Loe, D. L. and Rowlands, E., J.
Illum. Engng. Soc., 8 (2), 111 (1979).
lo McKennan, G. T., Parry, C. M. and Tilic, M., Paper BM presented a t CIBS National Lighting Conference, Canterbury (1980).
l 1 Nunnally, J. C., Psychometric Theory, New York,
McGraw-Hill (1967).
l 2 Cain, W. S. and Marks, L. E., Stimulus and
Sensation, Boston, Little, Brown and Co. (1971).
T h i s publication is being d i s t r i b u t e d by t h e Division of Building R e s e a r c h of t h e National R e s e a r c h C o u n c i l of Canada. I t s h o u l d n o t b e r e p r o d u c e d i n whole o r in p a r t without p e r m i s s i o n of t h e o r i g i n a l p u b l i s h e r . T h e D i - v i s i o n would b e glad t o b e of a s s i s t a n c e i n obtaining s u c h p e r m i s s i o n .
P u b l i c a t i o n s of t h e D i v i s i o n m a y b e obtained b y m a i l - ing t h e a p p r o p r i a t e r e m i t t a n c e (a Bank, E x p r e s s , o r P o s t Office M o n e y O r d e r , o r a cheque, m a d e p a y a b l e t o t h e R e c e i v e r G e n e r a l of Canada, c r e d i t NRC) t o t h e N a t i o n a l R e s e a r c h C o u n c i l of Canada, Ottawa. K1A OR6. S t a m p s a r e n o t a c c e p t a b l e .
A l i s t of a l l p u b l i c a t i o n s of the Division i s a v a i l a b l e and m a y b e obtained f r o m t h e P u b l i c a t i o n s Section, Division of Building R e s e a r c h , N a t i o n a l R e s e a r c h C o u n c i l of Canada, O t t a w a . KIA OR 6.