HAL Id: inserm-00635382
https://www.hal.inserm.fr/inserm-00635382
Submitted on 12 Sep 2012HAL is a multi-disciplinary open access
archive for the deposit and dissemination of sci-entific research documents, whether they are pub-lished or not. The documents may come from teaching and research institutions in France or abroad, or from public or private research centers.
L’archive ouverte pluridisciplinaire HAL, est destinée au dépôt et à la diffusion de documents scientifiques de niveau recherche, publiés ou non, émanant des établissements d’enseignement et de recherche français ou étrangers, des laboratoires publics ou privés.
Jean-Michel Hupé, Cécile Bordier, Michel Dojat
To cite this version:
Jean-Michel Hupé, Cécile Bordier, Michel Dojat. The Neural Bases of Grapheme-Color Synesthesia Are Not Localized in Real Color-Sensitive Areas.: No localized correlate of synesthetic colors. Cerebral Cortex, Oxford University Press (OUP), 2011, epub ahead of print. �10.1093/cercor/bhr236�. �inserm-00635382�
For Peer Review
The Neural Bases of Grapheme-Color Synesthesia Are not Localized in Real Color Sensitive Areas
Journal: Cerebral Cortex Manuscript ID: CerCor-2010-01054.R2 Manuscript Type: Original Articles Date Submitted by the
Author: n/a
Complete List of Authors: Hupé, Jean-Michel; Université de Toulouse & CNRS, CerCo
Bordier, Cécile; INSERM U836 & Université Joseph Fourier, Grenoble Institut des Neurosciences (GIN)
Dojat, Michel; INSERM U836 & Université Joseph Fourier, Grenoble Institut des Neurosciences (GIN)
Keywords: fMRI, human vision, synaesthesia, V4, VBM
For Peer Review
The Neural Bases of Grapheme-Color Synesthesia Are not Localized in Real
Color Sensitive Areas
Jean-Michel Hupé (1)*, Cécile Bordier (2), Michel Dojat (2)
(1) CerCo, Université de Toulouse & CNRS, Toulouse, France
(2) Grenoble Institut des Neurosciences (GIN) - INSERM U836 & Université
Joseph Fourier, Grenoble, France
*corresponding author
CerCo, Université de Toulouse - CNRS
Place du Dr Baylac
CHU Purpan, Pavillon Baudot
31300 Toulouse
tel: 33 (0)5 81 18 49 43
email : Jean-Michel.Hupe@cerco.ups-tlse.fr
Running title: No localized correlate of synesthetic colors
3 4 5 6 7 8 9 10 11 12 13 14 15 16 17 18 19 20 21 22 23 24 25 26 27 28 29 30 31 32 33 34 35 36 37 38 39 40 41 42 43 44 45 46 47 48 49 50 51 52 53 54 55 56 57For Peer Review
Abstract
The subjective experience of color by synesthetes when viewing achromatic letters and numbers supposedly relates to real color experience, as exemplified by the recruitment of the V4 color center observed in some brain imaging studies. Phenomenological reports and psychophysics tests indicate however that both experiences are different. Using fMRI, we tried to precise the degree of coactivation by real and synesthetic colors, by evaluating each color center individually and applying adaptation protocols across real and synesthetic colors. We also looked for structural differences between synesthetes and non-synesthetes. In 10 synesthetes, we found that color areas and retinotopic areas were not activated by synesthetic colors, whatever the strength of synesthetic associations measured objectively for each subject. Voxel-based morphometry revealed no white or gray matter difference in those regions when compared to 25 control subjects. But synesthetes had more white matter in the retrosplenial cortex bilaterally. The joint coding of real and synesthetic colors, if it exists, must therefore be distributed rather than localized in the visual cortex. Alternatively, the key to synesthetic color experience might not lie in the color system.
Keywords
fMRI; human vision; synaesthesia; V4; VBM 3 4 5 6 7 8 9 10 11 12 13 14 15 16 17 18 19 20 21 22 23 24 25 26 27 28 29 30 31 32 33 34 35 36 37 38 39 40 41 42 43 44 45 46 47 48 49 50 51 52 53 54 55 56 57
For Peer Review
Some people experience supplemental sensations for specific stimulations. These various experiences are referred to as « synesthesia », or union of the senses, since the end of the XIXth century (Text S1). Here we focus on much studied grapheme-color synesthesia, which concerns 1 to 5 people in 100 (Simner et al. 2006; Suarez de Mendoza 1890). The question at stake is not the reality of the synesthetic experience, but its nature. Since the early 2000’s, cognitive studies have applied psychophysical tests to measure objectively the synesthetic associations described in subjective reports. Modified versions of the Stroop task revealed longer response times when naming the color of graphemes that elicited incongruent synesthetic color experiences, compared to those that did not (Dixon et al. 2000; Mattingley et al. 2001). Stroop effects revealed therefore a systematic association between graphemes and colors, but with no indication about the nature of this association (Blake et al. 2005; Elias et al. 2003; Hubbard and Ramachandran 2005). In order to demonstrate the perceptual nature of the synesthetic experience, psychologists looked for standard perceptual effects in synesthesia with psychophysics methods, like visual search tasks (Blake et al. 2005; Palmeri et al. 2002; Ramachandran and Hubbard 2001, 2001; Rich and Mattingley 2002; Robertson and Sagiv 2005). Better performances by synesthetes (Hubbard et al. 2005; Palmeri et al. 2002; Ramachandran and Hubbard 2001) led to the suggestion that binding of synesthetic colors to graphemes was not only ‘perceptual’ but also preattentive. However, most studies, in particular those involving more than one or two subjects, showed that synesthetic binding of color did require attention (Laeng et al. 2004; Nijboer and Van der Stigchel 2009; Sagiv et al. 2006; Ward et al. 2010). Moreover, several studies showed that early perceptual mechanisms were not involved in grapheme-color synesthesia (Edquist et al. 2006; Gheri et al. 2008; Hong and Blake 2008; Rothen and Meier 2009). 3 4 5 6 7 8 9 10 11 12 13 14 15 16 17 18 19 20 21 22 23 24 25 26 27 28 29 30 31 32 33 34 35 36 37 38 39 40 41 42 43 44 45 46 47 48 49 50 51 52 53 54 55 56 57
For Peer Review
Synesthetic experience of colors is therefore not equivalent to color perception. But what do synesthetes mean when they claim that they see achromatic graphemes with colors? The answer depends on synesthetes, as discovered by Flournoy (Flournoy 1893) on the basis of subjective reports. Photisms, as he called the subjective experience of synesthetic colors, are described either as felt, thought or experienced as mental images – which can be said to be ‘projected’ (in the outside world), or not. But Flournoy (1893) proposed to classify photisms simply as a function of their intensity – leaving open the difficult question of possible qualitative differences in the way synesthetes experience their photisms. On the basis of questionnaires, modern cognitive neuroscience has used the distinction between ‘projectors’ and ‘associators’ (Dixon et al. 2004), thus implying a qualitative difference. It has been suggested that only projectors would exhibit advantages in visual search tasks (Dixon and Smilek 2005), but none of the ‘projectors’ that we or others have tested (Edquist et al. 2006; Ward et al. 2010), showed any advantage of the sort originally described for one or two synesthetes (Hubbard et al. 2005; Ramachandran and Hubbard 2001); Ward and colleagues (Ward et al. 2010) even showed that a group of nine ‘projectors’ was not any better than a group of 27 ’associators’. It should be emphasized that questionnaires do not allow us to characterize unambiguously the qualitative nature of the subjective synesthetic experience. Edquist and colleagues (Edquist et al. 2006) had reported contradictory responses when submitting the questionnaire several times or when slightly modifying the precise formulation of the questions. We have a very similar experience of lack of consistency with questionnaires or even after hours of semi-directed interview (Text S2). Thus, we refrain from using the ‘associator/projector’ classification on the basis of questionnaires (Dixon et al. 2004; Rouw and Scholte 2007, 2010; Ward et al. 2010; Ward et al. 2007), noting that in any case it is an over-simplification of the diverse phenomenology, as described by Flournoy (1893). 3 4 5 6 7 8 9 10 11 12 13 14 15 16 17 18 19 20 21 22 23 24 25 26 27 28 29 30 31 32 33 34 35 36 37 38 39 40 41 42 43 44 45 46 47 48 49 50 51 52 53 54 55 56 57
For Peer Review
Here we quantified the intensity (Flournoy 1893) of the synesthetic experience by measuring the association strength between graphemes and colors using variants of the Stroop test, since by construction Stroop tests measure interferences and therefore the strength or automaticity of associations. We computed a unique, objective, measure of synesthetic strength for each synesthete (see Methods).
Another way to obtain objective information on the nature of synesthesia is to study the brain of synesthetes. A few functional Magnetic Resonance Imaging (fMRI) studies showed an overlap of activation (measured as variations of the BOLD signal) for colored stimuli and achromatic graphemes (Hubbard et al. 2005; Rich et al. 2006; Sperling et al. 2006) as well as read (Weiss et al. 2001) or heard (Nunn et al. 2002) words in synesthetes. Such activation of the ‘color center’ (V4 for the most commonly accepted denomination, see Text S3) was taken as an objective validation of subjective reports of color experience. In the study by Hubbard and colleagues (Hubbard et al. 2005) individual variability of the phenomenological experience was even correlated to the amplitude of BOLD activation by graphemes in retinotopic areas. Such an involvement of the real color sensitive system in the experience of synesthetic colors and its modulation by the intensity of the synesthetic experience suggest a strong analogy between the experience of real and synesthetic colors. However, other studies did not reveal any significant activation of the ‘real color sensitive areas’ by synesthetic colors (Paulesu et al. 1995; Rouw and Scholte 2010; Weiss et al. 2005). Using EEG, one study observed more activation by auditory stimuli in the fusiform gyrus for auditory-visual synesthetes compared to controls (Beeli et al. 2008), but another did not (Goller et al. 2008). EEG (and MEG alike) would anyway lack the spatial resolution to test whether the same population of neurons is involved for both real and synesthetic color experience.
3 4 5 6 7 8 9 10 11 12 13 14 15 16 17 18 19 20 21 22 23 24 25 26 27 28 29 30 31 32 33 34 35 36 37 38 39 40 41 42 43 44 45 46 47 48 49 50 51 52 53 54 55 56 57
For Peer Review
Other studies have looked for structural differences in the brain of synesthetes using either diffusion tensor imaging (DTI) (Hanggi et al. 2008; Jancke et al. 2009; Rouw and Scholte 2007) or voxel-based morphometry (VBM) on T1-weighted MRI (Hanggi et al. 2008; Jancke et al. 2009; Rouw and Scholte 2010; Weiss and Fink 2009). On the one hand, finding local increases of white matter (WM) with VBM or greater anisotropic diffusion (indicating more coherent WM) with DTI in the brain of synesthetes compared to non-synesthetes would support the hypothesis of synesthesia being due to additional connections between (possibly neighboring) regions that are normally not connected to each other (Flournoy 1893; Hubbard and Ramachandran 2005; Suarez de Mendoza 1890). Rouw and Scholte (Rouw and Scholte 2007) found indeed greater connectivity for synesthetes in the right inferior temporal cortex (near the fusiform gyrus i.e. close to a real color sensitive region), especially ‘for ‘projectors’ compared to ‘associators’, suggesting a causal link between the amount of specific increased connectivity and the strength or nature of synesthetic associations. However Jancke and colleagues (Jancke et al. 2009) did not observe any connectivity difference between synesthetes and controls. On the other hand, increased gray matter (GM) in the brain of synesthetes in regions sensitive to real color would support the hypothesis that the same specialized regions code synesthetic colors in addition (thus requiring more neurons) to real colors. Such a result was obtained by Jancke and colleagues (Jancke et al. 2009) and marginally by Weiss and Fink (Weiss and Fink 2009) but not by Rouw and Scholte (Rouw and Scholte 2010) or Hanggi and colleagues (Hanggi et al. 2008). Other structural differences between synesthetes and controls were also observed in these studies, but they were not in ‘color regions’ and not systematic across studies.
At the end, careful reading of the relevant literature casts some doubt on the textbook story that synesthetes activate ‘color area V4’ when viewing achromatic graphemes (but experiencing 3 4 5 6 7 8 9 10 11 12 13 14 15 16 17 18 19 20 21 22 23 24 25 26 27 28 29 30 31 32 33 34 35 36 37 38 39 40 41 42 43 44 45 46 47 48 49 50 51 52 53 54 55 56 57
For Peer Review
color) and on structural brain differences reported between synesthetes versus non-synesthetes.
The goal of the present study was twofold: testing with fMRI whether the real color sensitive areas of synesthetes were involved in their experience of synesthetic colors and looking for structural differences between synesthetes and non-synesthetes. Since these questions have been tested several times with mixed results, we performed several improvements while keeping close to the published literature.
(1) We took into account the individual variability both of the localization and the number of color centers (Text S3). Also, like Hubbard and colleagues (Hubbard et al. 2005) we performed a full retinotopic mapping in each synesthete in order to define regions of interest (ROIs) functionally and not depend on anatomical variability.
(2) Like Hubbard et al. (2005) we took into account individual differences in the experience of synesthetic colors, paying much attention to phenomenological reports and trying to get an objective measure with psychophysics tests. Since Hubbard et al. (2005) used tests whose validity have been questioned, we used a robust and objective measure of the strength of the synesthetic color associations.
(3) We combined individual ROI and full-brain group analyses (then strictly controlling for statistical risks due to multiple comparisons), in order to avoid possible ‘pinhole’ interpretations (most published studies using the ROI approach did not indicate the behavior of voxels outside of the ROIs).
(4) fMRI activation of the same voxels by real and synesthetic colors is not enough to prove that the same neurons are involved, given the relatively weak anatomical resolution of the BOLD signal (≈ 3mm). We added an adaptation protocol in order to measure 3 4 5 6 7 8 9 10 11 12 13 14 15 16 17 18 19 20 21 22 23 24 25 26 27 28 29 30 31 32 33 34 35 36 37 38 39 40 41 42 43 44 45 46 47 48 49 50 51 52 53 54 55 56 57
For Peer Review
possible cross-adaptation effects when mixing real and synesthetic colors. Unfortunately, these critical recordings revealed as unnecessary, because, to start with, we did not find any region that was activated both by real and synesthetic colors. The whole experiment and results are available as a technical report (www.cerco.ups-tlse.fr/~hupe/synesthesia_adaptation.html).
(5) In order to find structural markers of synesthesia, we used state-of-the-art algorithms in still delicate VBM methodology and applied strict statistical criteria.
Materials and Methods
Subject selection
We used the data of twenty-five control subjects (mean age 30 years, range 21-59 years, all right-handed, 10 women) for the VBM analysis and 10 synesthetes (mean age 36 years, range 26-56 years, all right-handed, 7 women) for all analyses. All subjects were without past or current brain disease, had no detected cognitive deficit and had higher education level. All 10 synesthetes spontaneously contacted the authors. After filling up a questionnaire, they were selected for the present experiment on the basis of their synesthetic associations. We selected grapheme-color synesthetes who had enough different color associations for our purpose. All of them reported strong grapheme-color associations as well as other synesthetic associations, as described in Text S2. Experiments were performed following project approval by the Institutional Review Board of Grenoble and written consent from the subjects.
Additional inclusion criteria for synesthetes
Visual perception 3 4 5 6 7 8 9 10 11 12 13 14 15 16 17 18 19 20 21 22 23 24 25 26 27 28 29 30 31 32 33 34 35 36 37 38 39 40 41 42 43 44 45 46 47 48 49 50 51 52 53 54 55 56 57
For Peer Review
All but one synesthete had normal or lens-corrected acuity. One subject had to wear non magnetic glasses in the scanner (the quality of the ocular signal through the glasses was poor, but we were still able to detect blinks reliably in most runs). All subjects had normal color perception on the Lanthony D-15 desaturated color test (Richmond Products), except one subject who was partially color blind. This subject had progressively lost the perception of blue and green (as confirmed with the color test) after a fall in his bathroom a few years earlier. His visual world had progressively turned to shades of orange, red, yellow and gray. Before being included in the present study, he underwent a clinical anatomical 1.5T scan in Grenoble and was examined by a neurologist. No lesion was detectable. His retinotopy was normal, and we detected ‘hot spots’ of activation to colored Mondrians (see below) in V4topo bilaterally (t-values between 3 and 3.73, on the basis of 2 Mondrian runs). Other activations were present within other retinotopic areas, but not anterior to V4topo. This pattern of activation was similar to what we observed in other subjects, with the notable exception of the absence of detectable activation anterior to V4. Interestingly, this subject still reported ‘seeing’ synesthetic blue and green colors. We were very curious to observe whether parts of the ventral cortex (in particular anterior to V4) would respond to achromatic graphemes, thus still coding specifically synesthetic green and blue colors. But just like for other subjects, we did not find any reliable correlate of synesthetic colors in the ventral cortex.
Validation of synesthetic associations
We first asked synesthetes by mail to report the colors of their graphemes, using either software or scanning the printed colors. Then, before running the fMRI experiments, we asked them to pick up the colors of each grapheme, using our calibrated screen and a modified version of the Synesthesia Battery test (Eagleman et al. 2007). They were not previously informed that 3 4 5 6 7 8 9 10 11 12 13 14 15 16 17 18 19 20 21 22 23 24 25 26 27 28 29 30 31 32 33 34 35 36 37 38 39 40 41 42 43 44 45 46 47 48 49 50 51 52 53 54 55 56 57
For Peer Review
they will be asked to choose again their synesthetic colors, so we could check the consistency of their associations (Asher et al. 2006; Baron-Cohen et al. 1993), which was always excellent (no more than 1 or 2 differences; in each case and when asked about, the synesthetes indicated that two colors were possible indeed for that particular grapheme). We also asked them to tell us which associations were the strongest and we selected those graphemes for psychophysics and fMRI tests whenever possible.
Psychophysics experiments: individual measure of the strength of the synesthetic associations
We used synesthetic variants of the Stroop test, which measures interferences and therefore the strength or automaticity of associations. Stroop performance depends on volitional control, since even the original Stroop effect (difficulty to name correctly and fast the printed color of, e.g., the word ‘red’ when printed in blue or green - incongruent condition, compared to a congruent condition where it is printed in red) can disappear under training and volitional control. Moreover, there is a speed/accuracy tradeoff: subjects can slow down in order to avoid errors, and therefore being as slow for congruent and incongruent stimuli. In order to control for these effects, we used two variants of the synesthetic Stroop task: naming as quickly as possible either the color of the ink or the idiosyncratic synesthetic color (the ‘photism’) of individual graphemes (Dixon et al. 2004; Ward et al. 2007). See also the section ‘Psychophysics
experiments: details of the Synesthetic Stroop procedure and data analysis’ in Text S4. We
measured vocal response times (RT). Importantly, in order to be able to compare the performances of different subjects, who had different levels of variability and whose results were based on different number of trials, we computed the effect size (pε
2
, ‘partial eta-square’) of the differences of 1/RT rather than the differences of mean response times. Our index of synesthetic strength (“photism strength”, ps) was:
3 4 5 6 7 8 9 10 11 12 13 14 15 16 17 18 19 20 21 22 23 24 25 26 27 28 29 30 31 32 33 34 35 36 37 38 39 40 41 42 43 44 45 46 47 48 49 50 51 52 53 54 55 56 57
For Peer Review
ps = pε 2 (Incongruent-Congruent)Color - pε 2 (Incongruent-Congruent)Photism - pε 2 (Photisms-Color)Congruent(Note that if we had just measured response times and not effect sizes, the formula would have been equivalent to the difference of response times for incongruent stimuli in the color and photism task). The first term of the equation measures the strength of the interference by synesthetic colors. The second term equalizes for volitional control and speed/accuracy tradeoff. The last term is negative only when photisms are faster to name than real colors. A positive index indicated therefore a strong association between graphemes and synesthetic colors and an easier task when naming photisms (see Figure 4 for examples). We could not test our partially color-blind synesthete on this task, because he could not match his synesthetic green and blue colors unambiguously with real colors.
fMRI experiments on synesthetes
Each subject ran 3 scanner sessions within 1 or 2 consecutive days. The synesthete with the strongest synesthetic associations (syn04) came back a year later to run again the whole experiment and additional runs, so we could control that our results were not due to a lack of power (she ran 8 more synesthetic runs, 4 with the same instruction as before, 4 with another instruction – see below. The results were similar and combining all her data did not reveal any new activation). In the first session, subjects lay in the scanner without any scanning, in order to get used to the machine environment (that was their first time in a scanner for all but one of them) and chose the exact color matches of the graphemes that we selected for the adaptation protocol. We verified that they could clearly see all the stimuli and were accustomed to the different tasks we would ask them. The second session was devoted to structural scanning, 3 4 5 6 7 8 9 10 11 12 13 14 15 16 17 18 19 20 21 22 23 24 25 26 27 28 29 30 31 32 33 34 35 36 37 38 39 40 41 42 43 44 45 46 47 48 49 50 51 52 53 54 55 56 57
For Peer Review
retinotopic mapping and one or two Mondrian runs. The third session was devoted to the mapping of real and synesthetic colors and to the adaptation protocol.
MR data acquisition and preprocessing
We acquired high-resolution structural images and EPI functional data on a Bruker 3T Medspec S300 whole body scanner. Standard preprocessing steps are described in the section ‘MR data acquisition and preprocessing’ of Text S4.
Retinotopic mapping and mapping of color center (Mondrian protocol)
We mapped the retinotopic areas of each subject using standard methods (Text S4, ‘Retinotopic mapping’ section). We used a classical Mondrian protocol as a localizer of color centers (Text S4, ‘Mapping of color centers (Mondrian protocol)’ section), but we identified hot spots of color activity within each individual, rather than selecting a unique color area based on either retinotopic criteria or group analysis. We also tested several ways to select individual ROIs. But the outcome of our flexible localizationist approach was not different from naively selecting a unique ‘V4’ color area as was done in previous studies on synesthesia. We justify our flexible localizationist approach in Text S3.
Response to synesthetic colors (Synesthesia protocol)
The stimulus sequence and the protocol were exactly the same as for the Mondrian stimuli, except that colored Mondrians were replaced by graphemes and achromatic Mondrians by pseudo-graphemes. For each subject, we chose letters and numbers with synesthetic colors, avoiding synesthetic black, gray and white. We constructed pseudo-graphemes by cutting real graphemes into a few segments and rearranged them so they could not be recognized anymore 3 4 5 6 7 8 9 10 11 12 13 14 15 16 17 18 19 20 21 22 23 24 25 26 27 28 29 30 31 32 33 34 35 36 37 38 39 40 41 42 43 44 45 46 47 48 49 50 51 52 53 54 55 56 57
For Peer Review
like graphemes, while keeping similar low-level properties (segments, curves, angles and intersections: see Figure 1). We presented each pseudo-grapheme several times and asked synesthetes whether it had a synesthetic color or not. If the answer was ‘yes’ or ‘maybe’, we did not use it. In order to get 10 different pseudo-graphemes, we sometimes had to add Greek or Persian characters. Stimuli were black on a gray background, they were presented centrally and extended about 1 degree diameter, with a maximum height of 1.4 deg.
< PLEASE INSERT FIGURE 1 ABOUT HERE >
We did not want the synesthetes to pay more attention to graphemes than pseudo-graphemes, which may occur in the absence of specific instruction, because most synesthetes enjoy experiencing the synesthetic colors of the graphemes (the activation observed by Weiss and colleagues (Weiss et al. 2005) in the intraparietal cortex might correspond to such increase of attention for graphemes). Before each run, we showed a grapheme and a pseudo-grapheme and asked subjects to remember them so they could press a button each time they saw them. Each target was presented 3 times randomly within the 3.30 min sequence. Targets were different for each of the two runs. In order to control that our lack of activation by synesthetic colors was not due to such procedure, we asked syn04 to run four more runs with a different task when she came back for an additional scanning session: she now had to press a button each time she experienced a synesthetic color, and another button each time she did not. Not surprisingly, button presses corresponded systematically to graphemes and pseudo-graphemes. We obtained the same (absence of) results.
The analysis was the same as for the Mondrian stimuli. We sometimes observed individual subject activations corresponding to the graphemes (and synesthetic colors) at the 0.05 FDR 3 4 5 6 7 8 9 10 11 12 13 14 15 16 17 18 19 20 21 22 23 24 25 26 27 28 29 30 31 32 33 34 35 36 37 38 39 40 41 42 43 44 45 46 47 48 49 50 51 52 53 54 55 56 57
For Peer Review
level (conjunction contrast as for the Mondrian protocol), but we did not find any consistency across subjects (Text S4, ‘Grapheme response in individual subjects (Synesthesia protocol)’ section). We performed the group analysis the same way as for the Mondrian protocol.
Reliability of our fMRI measurements
fMRI studies examining the reliability of fMRI measurements (Bennett and Miller 2010; Specht et al. 2003) have questioned the reproducibility of results obtained in different fMRI studies. Such variability may explain why some but not all studies observed a synesthetic response in color areas. In fMRI, between subject variability is typically larger than within subject variability (Bennett and Miller 2010), and it was invoked to explain the variable activation of V4 in different studies on synesthesia. Hence (Hubbard et al. 2005) advocated taking into account the diverse phenomenology of synesthetes for the interpretation of fMRI data. Following them we computed an index of synesthetic strength. Within subject variability of the BOLD response may however also hamper the generalization of fMRI results. We therefore estimated the reliability of our signals. This can be performed only when we do have some signal, that is for stimuli leading to BOLD activation. We used the results of our Mondrian protocol since these pattern drive the neurons in retinotopic areas. We measured the reliability in area V4 since its involvement was at stake in our study. V4 was defined on the basis of retinotopic mapping to avoid any circularity bias. Since we had several scans (runs) of Mondrian stimuli, we could compare the variability of t-values obtained in each run independently to the global T-value obtained across all runs for each subject:
R = (T – Σi (|ti-tav|)/n) / T * 100
for i = 1 to n runs, with tav the average of t values within each run i
3 4 5 6 7 8 9 10 11 12 13 14 15 16 17 18 19 20 21 22 23 24 25 26 27 28 29 30 31 32 33 34 35 36 37 38 39 40 41 42 43 44 45 46 47 48 49 50 51 52 53 54 55 56 57
For Peer Review
Such measure estimates the percentage of reliability R (100% is obtained when all runs produce the exact same p value, 0% indicates the total lack of reproducibility between runs).
When contrasting colored and gray Mondrian stimuli against the fixation point, we obtained strong BOLD activation in left V4 (Tav = 7.6, range [3.75 12.33]) and right V4 (Tav = 7.8, range
[5.43 10.69], including the outlier value 1.04 for subject syn05). The average reliability of our 10 synesthetes was 84% in left V4 (range [59% 97%]) and 78% in right V4 (range [68% 96%], including outlier values 18% for syn05 and 54% for syn03). Such measures should be considered as conservative, since repetitions of these scans were not performed to assess reliability (like done for example by Specht et al. 2003); rather, we had a minimum number of repetitions of the stimuli in order to detect effects, but we split these repetitions across several short scans in order to prevent fatigue to subjects.
Voxel-based morphometry
Data Processing
We analyzed the structural images through a data processing pipeline implemented in SPM8. First, using the Unified Segmentation procedure (Ashburner and Friston 2005), we segmented each structural image in the subject’s native space by attributing to each voxel a probability of being in white matter (WM), gray matter (GM) and cerebrospinal fluid (CSF). This procedure estimates globally on the whole brain a mixture of Gaussians with spatial priors. Brain skull extraction and bias field estimation, important steps of the VBM pre-processing pipeline (Acosta-Cabronero et al. 2008), are embedded into the procedure ensuring that neither skull nor large veins contaminated the calculation of probability tissues maps. Then we used DARTEL (Ashburner 2007), a diffeomorphic image registration procedure that warps the individual tissue 3 4 5 6 7 8 9 10 11 12 13 14 15 16 17 18 19 20 21 22 23 24 25 26 27 28 29 30 31 32 33 34 35 36 37 38 39 40 41 42 43 44 45 46 47 48 49 50 51 52 53 54 55 56 57
For Peer Review
probability maps into a common study specific reference space. The procedure iteratively computes deformation fields for each individual structural image. Then, these fields were applied to each individual structural image, that was resampled using trilinear interpolation and averaged to create a study-specific anatomical template. We then applied an affine registration for transformation into the MNI space. To counterbalance local deformations, expansion or contraction, induced by diffeomorphic registration and affine transformation, the tissues’ probability values were scaled by the Jacobian determinants of the deformations (“modulation step” (Good et al. 2001)). Finally, we smoothed these “modulated” tissues probability maps using a 6mm FWHM Gaussian kernel (same pattern of results with an 8mm kernel).
Statistical Analysis
We compared the regional tissue probability maps (modulated and smoothed as described above) of controls and synesthetes by performing a voxel-wise univariate analysis using the General Linear Model as implemented in SPM8. Global brain size can vary a lot across subjects (mostly in correlation to subject size), so our statistical tests included brain volume as a factor of non-interest. Age slightly differed between the two groups (29.8 vs. 36.4, p=0.082), and our synesthete group had more women (7/10 vs. 10/25 in our control group). Both factors may generate local differences not related to synesthesia, so we also included sex and age as factors of non-interest. In order to calculate the global brain volume, we used the modulated images by summing together the GM and WM probabilities of all voxels (remember that each subject had the same number of voxels, since all brains fit within the same study specific template, but their probabilities of being in WM, GM or CSF did differ, and the sum of the probabilities in each voxel was no longer equal to 1 because of the modulation procedure). To avoid possible edge effects between different tissue types, we applied an absolute intensity threshold mask of 0.1 on each 3 4 5 6 7 8 9 10 11 12 13 14 15 16 17 18 19 20 21 22 23 24 25 26 27 28 29 30 31 32 33 34 35 36 37 38 39 40 41 42 43 44 45 46 47 48 49 50 51 52 53 54 55 56 57
For Peer Review
tissue probability. We first contrasted both groups using a Student T-test considering as statistically valid only individual voxels that had a p value <0.0001 and forming clusters that consisted of more than 70 continuous voxels (70 mm3, corresponding to a sphere of diameter just over 5 mm, matching roughly the 6 mm smoothing size). The family-wise error (FWE correction for multiple comparison) measured at the cluster level indicated that such criteria allowed us to identify clusters that reached a corrected risk level close to 0.05 (see Table 1). In a second step, to investigate the possible bilateral increases of some regions (spatial correlation justifying relaxing the FWE correction) we increased the p value threshold at the individual voxel to 0.0002 and decreased the minimum cluster size to 40 mm3. We projected the detected spatial tissue differences between the two groups onto the study-specific structural image transformed into the MNI space as described above.
Results
Grapheme response within the color centers
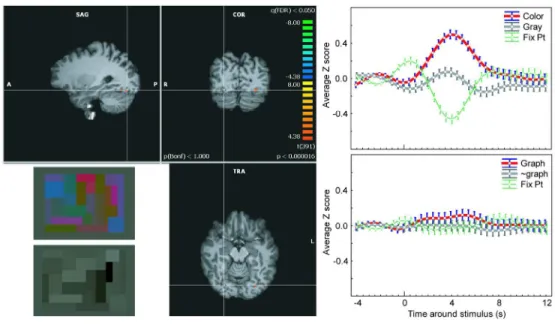
We defined individual regions of interest (ROI) to select voxels that responded the most to color stimuli, independently of their exact anatomical location: we adjusted statistic thresholds individually in order to define for each subject ROIs within and anterior to retinotopically defined V4 (‘V4topo’). Figure 2 (Left) shows a representative example of 3 of the 4 color centers obtained for one synesthete at the FDR (False Discovery rate) level of 0.05. For this subject, hot spots were present bilaterally in V4topo and in two clusters anterior to V4topo only on the right side. These two clusters may lie in what Brewer and colleagues (Brewer et al. 2005) defined as VO1 and VO2. We defined 35 ROI across our 10 synesthetes. We verified that the average BOLD signal was much stronger for color than for achromatic stimuli (top right part of Figure 2). However, on average, these very regions failed to respond to achromatic graphemes that yet 3 4 5 6 7 8 9 10 11 12 13 14 15 16 17 18 19 20 21 22 23 24 25 26 27 28 29 30 31 32 33 34 35 36 37 38 39 40 41 42 43 44 45 46 47 48 49 50 51 52 53 54 55 56 57
For Peer Review
elicited the vivid subjective experience of synesthetic color (bottom right part of Figure 2): beta weights (that correspond to the correlation strength between BOLD signal and model predictors) were not significantly larger for graphemes than pseudo-graphemes (F(1,25) = 2.37, p = 0.14, pε
2
= 0.09 (partial effect size); test on the difference of beta weights within each of the 35 ROIs with the variable ‘subject’ being a random factor). BOLD modulation was equally absent for achromatic pseudo-graphemes (that triggered no synesthetic color) and fixation point.
< PLEASE INSERT FIGURE 2 ABOUT HERE >
We considered the possibility that only a subset of these color hot spots be involved in synesthetic color perception, and that their anatomo-functional location differed between subjects, but beta weights were not significantly larger for graphemes than pseudo-graphemes in any of the 35 color ROIs at the non-corrected 0.01 significance level. Likewise, we did not observe any tendency for a larger grapheme response either on the right or the left side, or in V4 or anterior to it.
Color and grapheme responses in retinotopic areas
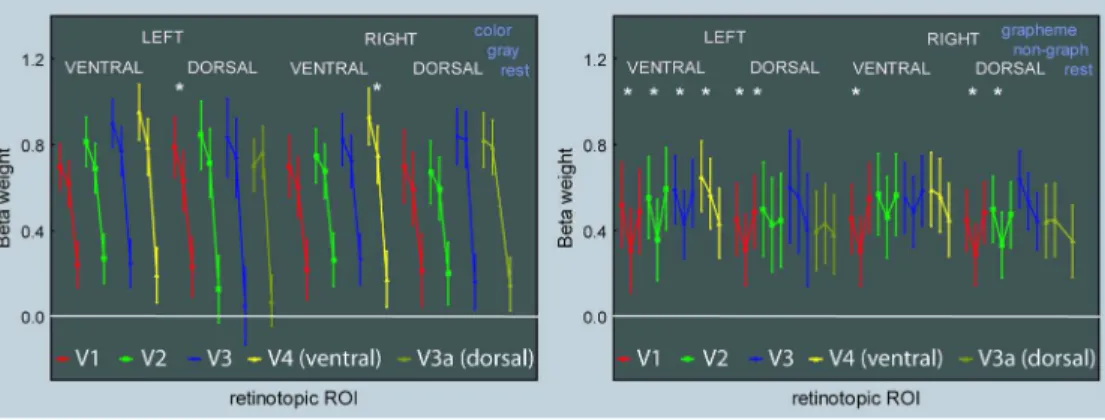
For each subject we used retinotopic mapping techniques in order to define areas V1 to V4, on each side and both ventrally and dorsally. Ventrally, area V4 represents a full hemifield and has no dorsal counterpart (Brewer et al. 2005; Wandell et al. 2007). Dorsally, area V3a represents also a full hemifield (Larsson and Heeger 2006; Wandell et al. 2007). Areas V3b, LO1, LO2 (Larsson and Heeger 2006), VO1 and VO2 could not be identified on every subject. We computed the beta weights within each ROI for the Mondrian and synesthetic protocols (Figure 3). 3 4 5 6 7 8 9 10 11 12 13 14 15 16 17 18 19 20 21 22 23 24 25 26 27 28 29 30 31 32 33 34 35 36 37 38 39 40 41 42 43 44 45 46 47 48 49 50 51 52 53 54 55 56 57
For Peer Review
< PLEASE INSERT FIGURE 3 ABOUT HERE >
The whole retinotopic visual cortex responded significantly more to Mondrians than to the fixation point (Wilcoxon paired comparisons, N = 10), and more to colored than gray Mondrians, except V3a, in agreement with the results of Brouwer and Heeger (Brouwer and Heeger 2009) showing color decoding power in all retinotopic areas except V3a/b. The difference between both conditions was significant in dorsal left V1 and right V4, as well as in the average of V4. Beta weights were weak for both graphemes (that triggered synesthetic colors) and pseudo-graphemes (that did not), since they were never significantly larger than for the fixation point. On average, however, beta weights were significantly weaker for pseudo-graphemes than for graphemes in V1, V2, V3 and V4 (not V3a).
Individual differences among grapheme-color synesthetes: brain-behavior correlations?
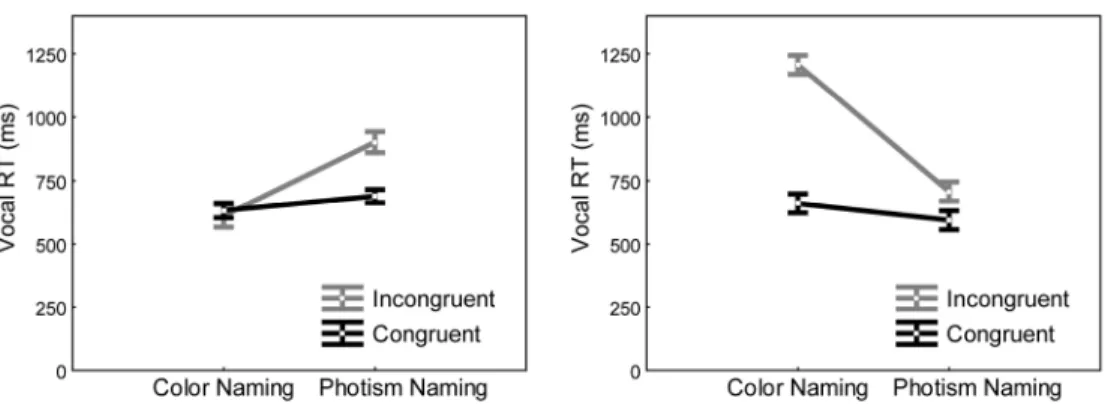
The strength of the synesthetic grapheme-color associations differed between our subjects. Hubbard and colleagues (Hubbard et al. 2005) observed that the stronger the phenomenological synesthetic color experience, the larger the signal in retinotopic V4 for graphemes compared to pseudo-graphemes. We expected therefore to observe such a positive correlation in our data. Our outstanding question was which color centers, within V4 or anterior to it, would show the stronger correlation. We measured objectively the strength of synesthetic associations with two variants of the Stroop test, where subjects had to name as quickly as possible either the real or the synesthetic color (the ‘photism’) of a grapheme displayed either with the color of her/his synesthetic association (congruent trials) or a different color (incongruent trials). Figure 4 displays the results obtained for 2 subjects with either relatively weak or very strong 3 4 5 6 7 8 9 10 11 12 13 14 15 16 17 18 19 20 21 22 23 24 25 26 27 28 29 30 31 32 33 34 35 36 37 38 39 40 41 42 43 44 45 46 47 48 49 50 51 52 53 54 55 56 57
For Peer Review
associations. For each subject, we derived a single index of synesthetic strength from these data (see Methods).
< PLEASE INSERT FIGURE 4 ABOUT HERE >
We first computed non parametric Spearman correlation coefficients between photism strength and the BOLD response to synesthetic colors within each retinotopic area. The synesthetic BOLD response was estimated by the difference of beta weights for graphemes and pseudo-graphemes, as proposed by Hubbard et al. (2005) (of course, such a ‘response’ does not dissociate between photism and grapheme signal, but only photism signal could, supposedly, correlate to photism strength). No positive significant correlation was observed in any of the retinotopic areas. In left and right V4, correlation coefficients were negative (p=0.42 and p=0.12, respectively), contrary to our hypothesis. Negative correlations were even significant (p ~= 0.02) when using non-parametric tests (but not parametric tests) in left ventral V1, V2 and V3, as well as in right ventral V1 and V2. These correlations were mainly driven by a weaker grapheme response for synesthetes with the strongest associations.
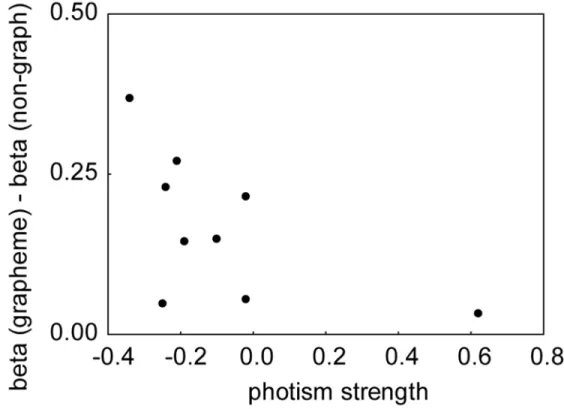
Similarly, we found no correlation in the individual color centers (Figure 5).
< PLEASE INSERT FIGURE 5 ABOUT HERE >
Group analyses
We explored whether regions outside the visual cortex responded more to graphemes than pseudo-graphemes. Such regions would have been possible candidates for coding synesthetic colors, as long as they did not code graphemes in non-synesthetes. But we did not need to run 3 4 5 6 7 8 9 10 11 12 13 14 15 16 17 18 19 20 21 22 23 24 25 26 27 28 29 30 31 32 33 34 35 36 37 38 39 40 41 42 43 44 45 46 47 48 49 50 51 52 53 54 55 56 57
For Peer Review
experiments on a control group of non-synesthetes because we did not find any significant activation when performing a random effect analysis on 10 synesthetes for the contrast (graphemes – pseudo-graphemes), even at a very liberal statistical threshold (p < 0.001, uncorrected, minimum extent threshold = 50 voxels, corresponding to a minimum T value of 4.3). Note however that our functional volumes, oriented parallel to the calcarine sulcus, did not cover the full brain, how much was missing depending on subjects. Missing parts were located in the anterior regions of the temporal cortex, the very top of the parietal cortex and lower parts of the frontal cortex. We also computed a group correlation between photism strength and the response difference for each voxel between graphemes and pseudo-graphemes. Voxels showing a positive correlation would have been likely to code specifically synesthetic colors. But we found no significant voxel when controlling for multiple comparisons (FDR or FWE correction, SPM8 or SnPM – non-parametric – analysis).
Voxel-based morphometry
We compared the local distributions of White Matter (WM) and Gray Matter (GM) in the brains of our 10 synesthetes to the brains of 25 non-synesthetes. For WM analysis, 2 clusters reached our statistical threshold (Table 1), one in the right retrosplenial cortex that survived the strict FWE correction for multiple comparisons, the other one in the depth of the left superior temporal sulcus (STS) reaching a corrected significance level close to 0.05 (also note that the STS increase was a bit smaller for women – significant interaction in the STS ROI between group and sex, p = 0.047; average increase for women only was 3.8mm3, pε
2 = 0.52). The size of the WM
increase was around 5%. Exploratory analysis of our data at a higher threshold (Figure 6) revealed that the retrosplenial activation was likely bilateral. As an additional statistical control, 3 4 5 6 7 8 9 10 11 12 13 14 15 16 17 18 19 20 21 22 23 24 25 26 27 28 29 30 31 32 33 34 35 36 37 38 39 40 41 42 43 44 45 46 47 48 49 50 51 52 53 54 55 56 57
For Peer Review
each subject was randomly assigned to the control or synesthete group. We performed the analysis with random labels 10 times and did not detect any difference in WM.
< PLEASE INSERT TABLE 1 ABOUT HERE >
< PLEASE INSERT FIGURE 6 ABOUT HERE >
We did not find any significant increase of WM for control subjects compared to synesthetes, as well as no significant difference either way in GM at our statistical threshold.
We also computed a group correlation between photism strength and WM probabilities of our population of synesthetes. We found no significant correlation in any of the clusters identified above (without any correction). Whole brain group correlation between photism strength and voxel WM or GM probability revealed no significant voxel (FWE correction). We also did not find any relationship between WM probability in the RSC of synesthetes and their additional synesthetic associations (like the presence or not of personification of graphemes, number lines, multimodal associations, or the number of types of synesthesia (Ward et al. 2008): see Text S2).
Discussion
We found that none of the individual retinotopic or color areas responded to synesthetic colors, whatever the strength of the synesthetic association, and whatever the way we defined color ROIs (‘V4topo’ defined on the basis of retinotopic mapping or color areas defined in each individual as the clusters of the fusiform gyrus responding maximally to colored Mondrians). Likewise, the whole brain fMRI group analysis did not show any activation within the ‘color regions’ (even at a liberal statistical threshold) and did not reveal any other candidate region as 3 4 5 6 7 8 9 10 11 12 13 14 15 16 17 18 19 20 21 22 23 24 25 26 27 28 29 30 31 32 33 34 35 36 37 38 39 40 41 42 43 44 45 46 47 48 49 50 51 52 53 54 55 56 57
For Peer Review
the main substrate of synesthetic colors. In addition, the comparison of the gray and white matter volumes of our 10 synesthetes to 25 control subjects revealed significant increases of white matter, notably a bilateral increase in the retrosplenial cortex of synesthetes, but none in the ‘color’ regions of the visual cortex.
What do synesthetes mean when they claim that they perceive colors on achromatic graphemes? The present study does not solve this enigma, but tries hard to clarify what we can learn today from experimental data. As reviewed in the Introduction, both data from phenomenology and psychophysics now clearly indicate that the experience of synesthetic colors is far from being equivalent to the experience of real colors (for most, if not all, synesthetes), contrary to early enthusiastic claims based on surprising observations obtained but of single individuals, sometimes with poor methodological controls. Nonetheless, the experience of synesthetic ‘colors’ must bear some connection to the experience of real colors. Here we tested with both functional and structural MRI techniques whether we could reveal in the brains of synesthetes the implication of the ‘real color system’ in the experience of synesthetic colors. The answer is clearly no, and we propose below some explanations why other studies (but not all) have concluded otherwise. However, we should not conclude that synesthetic and real colors do not share any common substrate. Rather, the present work shows the methodological and conceptual current limits of localization tools based of standard fMRI to answer such a question, so we shall propose that further studies use distributed methods. In addition, our structural data revealed differences between synesthetes and non-synesthetes in brain regions that we did not expect, because located outside of the visual cortex. Such structural differences may not relate to the synesthetic experience of colors, if synesthetes as a group possess additional, typical characteristics, related for example to yet to be discovered 3 4 5 6 7 8 9 10 11 12 13 14 15 16 17 18 19 20 21 22 23 24 25 26 27 28 29 30 31 32 33 34 35 36 37 38 39 40 41 42 43 44 45 46 47 48 49 50 51 52 53 54 55 56 57
For Peer Review
specific personality traits. Moreover, we observed no correlation between the magnitude of the WM increase and the strength of the color association. Alternatively (or in addition), ‘color’ may not be the decisive characteristic of synesthetic ‘color’ associations. Dann (Dann 1998) in his remarkable and thorough review of the literature on synesthesia of both past centuries had emphasized that the ‘meaning’ of synesthesia was probably ‘meaning’. For a synesthete, a synesthetic association ‘makes sense’ without any ‘legitimate’ (objective or consensual) reason, hence the structural differences we observed may be related to the complex construction of ‘meaning’ by the brain, involving not only perception, but certainly at least language, memory and emotion. The retrosplenial cortex, where we discovered a seemingly robust increase of white matter in synesthetes, appears like a (the?) place of choice to build such meaningful connections (see paragraph below on ‘Synesthesia and the retrosplenial cortex’).
fMRI result: comparison with previous studies
Using fMRI, we did not observe any significant activation in ‘real color sensitive areas’ by synesthetic colors (triggered by graphemes). Such a result is consistent with several published studies. Using PET Paulesu and colleagues (Paulesu et al. 1995) compared six synesthetes to six controls. Auditory words triggering synesthetic colors, when compared to tones, activated more regions in the synesthete group, but none of lower visual areas like V1 or, importantly, V4. Using fMRI and a finer control stimulus within a group of nine grapheme-color synesthetes, Weiss and colleagues (Weiss et al. 2005) found BOLD activity related to the experience of synesthetic colors only in the left intraparietal cortex. Rouw and Scholte (Rouw and Scholte 2010) compared the BOLD response of 42 synesthetes and 19 controls to graphemes that elicited colors (for the synesthetes) to graphemes that did not. They did not find any significant differential activation within the whole visual cortex. Other studies described in the Introduction found the opposite 3 4 5 6 7 8 9 10 11 12 13 14 15 16 17 18 19 20 21 22 23 24 25 26 27 28 29 30 31 32 33 34 35 36 37 38 39 40 41 42 43 44 45 46 47 48 49 50 51 52 53 54 55 56 57
For Peer Review
result, supporting the role of real color sensitive areas in synesthesia. In fact, their evidence is not clear-cut. For example, though Nunn and colleagues (Nunn et al. 2002) concluded that ‘V4/V8’ was activated by synesthetic colors, they did not observe any activation overlap between real and synesthetic colors within the group of synesthetes: heard words activated a more widespread region in the visual cortex of the group of 10 synesthetes compared to controls, including a left inferior temporal region which the authors supposed to be in the neighborhood of visual areas V4/V8. But no retinotopy was performed and real colors did not activate this region in their group of synesthetes. Sperling and colleagues (Sperling et al. 2006) observed a stronger BOLD signal in retinotopically defined V4/V8 in only 2 out of 4 synesthetes and they did not control significance for multiple comparisons. Rich and colleagues (Rich et al. 2006) observed activity for synesthesia-inducing characters (contrasted to gray squares inducing no synesthesia) in their group of 6 synesthetes in the left medial lingual gyrus (but not in V4/V8), but the peak p value was only 0.008 (non-corrected), and they report the results only in their ‘color’ regions of interest. Rouw and Scholte in their 2007 study had reported a significantly stronger BOLD response in the fusiform gyrus of 18 synesthetes compared to 18 controls (for the contrast between graphemes that elicited colors for synesthetes to graphemes that did not). The anatomical location was however about 1.5 cm lateral to typical V4 coordinates (no retinotopy and no color localizer was performed), and this effect was lost in their 2010 study when they included more synesthetes. Finally, Hubbard and colleagues (Hubbard et al. 2005) observed a stronger response for graphemes compared to false fonts in all visual areas and for both 6 controls and 6 synesthetes. They stressed that only retinotopically defined V4 showed a stronger differential between both conditions in synesthetes than in controls, but the significance was borderline (the authors report a p < 0.05 obtained with a bootstrap test; by using the individual values shown in their Figure 6, we found out that such a result – precisely, p 3 4 5 6 7 8 9 10 11 12 13 14 15 16 17 18 19 20 21 22 23 24 25 26 27 28 29 30 31 32 33 34 35 36 37 38 39 40 41 42 43 44 45 46 47 48 49 50 51 52 53 54 55 56 57
For Peer Review
= 0.042 with a studentized bootstrap (Efron and Tibshirani 1993), p = 0.056 with bias correction and acceleration (Efron and Tibshirani 1993) – was obtained with a one-tailed test, that is assuming a priori larger values for synesthetes; we obtain p = 0.093 with a non-parametric two-tailed Mann Whitney test). All in all, studies supporting the role of V4 in synesthetic colors had to relax their statistical criteria to values close or even above p = 0.001 – a threshold that allows to generate ‘active’ voxel clusters from random variations of BOLD measure (Bennett et al. 2010). Procedures that control strictly for multiple comparisons are usually too conservative because they rely on the false assumption of independence of the BOLD response in different voxels (O'Toole et al. 2007). The problem is that the degree of correlation between voxels is unknown and must depend on the task. There is therefore no way to know how to balance correctly alpha (false positive) and beta (false negative) statistical risks, so only conservative criteria can be relied upon. A common justification to poor control of the statistical risk is that a
priori hypotheses were made. We point here to a possible confusion between ‘a priori’
information and ‘hypotheses’. An example of a priori information is the presence of stronger BOLD response in ventral areas for colored Mondrians compared to gray ones, because there is now a very large body of evidence, obtained with various methods and on many subjects, confirming such a result. The question at stake, then, is which exact region in each individual shows a larger response to colored Mondrians (we adopted this strategy to identify ‘color areas’ in each subject, and increased the statistical threshold accordingly). An example of a ‘hypothesis’ is whether color areas respond to synesthetic colors. Since the published evidence is not clear-cut, this cannot yet be considered as ‘a priori information’. By increasing the statistical threshold, authors performed a circular reasoning error. And researchers citing such studies as justifying a priori information propagated the original error. Therefore, we emphasize that no study so far had proven the implication of the real color system in synesthesia. Our 3 4 5 6 7 8 9 10 11 12 13 14 15 16 17 18 19 20 21 22 23 24 25 26 27 28 29 30 31 32 33 34 35 36 37 38 39 40 41 42 43 44 45 46 47 48 49 50 51 52 53 54 55 56 57
For Peer Review
results are therefore not contradictory with all the published evidence. In addition, only a couple of studies really tested the implication of the color system. Studies comparing the grapheme responses of synesthetes to those of controls but without testing directly the involvement of the real color system, and finding more activation for synesthetes, cannot be conclusive, since we expect that synesthetes would process graphemes more, because most of them simply enjoy experiencing the synesthetic colors of graphemes. More attention devoted to graphemes would generate stronger BOLD response. Finally, a common argument put forward to relax statistical thresholds is the potential lack of power. Had we tested more synesthetes, could we have found synesthetic response in color areas? The answer is no. Our conclusion of the absence of involvement of so-called ‘color areas’ in the experience of synesthetic color is not based on not reaching an arbitrary statistical threshold. Rather, we measured the size of the synesthetic response within color areas (Figure 2) and found it to be too small to be of any interest, whatever its possible statistical significance. The reliability of our fMRI measurements (Bennett and Miller 2010; Specht et al. 2003) was on average around 80%, as estimated in retinotopic area V4 for the response to Mondrian stimuli (see Methods, Reliability of our fMRI
measurements). Moreover the negative trend (while a positive trend was expected) between
synesthetic strength and synesthetic response (Figure 5) would require too large a number of additional subjects in order to be possibly reversed.
VBM result: comparison with previous studies
The lack of agreement between published VBM studies on synesthesia, as well as between those and ours, may be due to the methods used for data processing, especially for realignment of all structural scans in a common space and brain tissues segmentation, and also to differences between thresholds or methods used to correct (or not) for multiple comparisons 3 4 5 6 7 8 9 10 11 12 13 14 15 16 17 18 19 20 21 22 23 24 25 26 27 28 29 30 31 32 33 34 35 36 37 38 39 40 41 42 43 44 45 46 47 48 49 50 51 52 53 54 55 56 57
For Peer Review
when assessing the significance of the findings. In VBM, it is even more questionable than in fMRI to relax the statistical threshold, because there is no obvious reason for correlations between spatially distant voxels (except at the local level, where correlations can be handled by computing the family-wise error at the cluster level). We note that no analysis that corrected for multiple comparisons (therefore including ours) ever reported white or gray matter increase in the ‘color’ regions of synesthetes, or in any region whatsoever in the studies by Jancke and colleagues (Jancke et al. 2009) (24 synesthetes vs. 24 controls) and Weiss and Fink (Weiss and Fink 2009) (18 synesthetes vs. 18 controls). Rouw and Scholte (Rouw and Scholte 2007, 2010) (2007: 18 synesthetes vs. 18 controls; 2010: 42 synesthetes vs. 42 controls) did not seem to have tried correcting for multiple comparisons over the whole brain, so we do not know whether their differences are robust or not (in 2007 they observed increased anisotropy in 4 clusters by thresholding t>3 at the voxel level; in 2010, they observed increased GM for synesthetes in the left superior parietal lobe by thresholding p<0.05 at the voxel level; they apparently did not use brain size as a cofactor; WM differences were, surprisingly, not analyzed). Hanggi and colleagues (Hanggi et al. 2008) studied only one synesthete and found interesting WM and GM differences when compared with 37 controls (none around ‘color areas’). Our group study may however be the first one to report robust differences (that is that survive corrections for multiple comparisons) in the brains of a group of synesthetes. It may look surprising that if our difference, observed within a small population (10 vs. 25), is related to synesthesia, it was not detected in previous studies that applied less stringent statistical criteria and tested larger populations. But in fact only one study measured local WM differences the same way as we did, and for only one synesthete (Hanggi et al. 2008); she had interval-taste and tone-colour synesthesia, not grapheme-color synesthesia, suggesting that increased WM in the retrosplenial cortex might be specifically related to language processing (see below). Other 3 4 5 6 7 8 9 10 11 12 13 14 15 16 17 18 19 20 21 22 23 24 25 26 27 28 29 30 31 32 33 34 35 36 37 38 39 40 41 42 43 44 45 46 47 48 49 50 51 52 53 54 55 56 57
For Peer Review
studies used DTI to measure fractional anisotropy (FA), which is not a direct measure of local WMdensity (both measures should be correlated but sensitivity differences are likely, as shown in the study by (Hanggi et al. 2008) who used both measures). We should also consider the possibility that divergences are attributable in part to differences between the studied synesthetes’ populations. We selected synesthetes who reported the subjective experience of strong associations between graphemes and colors, and we happened to select in this way synesthetes who also experienced other types of association (Text S2). We do not know whether that was also the case for the synesthete populations in other studies.
Distributed coding of synesthetic colors
In the present study, we used the same localizationist approach as in previous studies on synesthesia because it had generated promising results. We however refined this approach by defining color ROIs individually (Text S3), while all previous studies on synesthesia had used the same ROI for all synesthetes (defined either after a group contrast and spatial smoothing or on the basis of retinotopy). We therefore tested whether or not the neural substrates of synesthetic colors were localized in the visual cortex. The interpretation of our negative result is that either synesthetic colors are localized outside of the visual cortex (we did not find such evidence, but our experimental design was not optimal to detect activations outside of the visual cortex; in particular, increasing the size of the synesthete population may be necessary to reveal such activations), or that they are distributed, possibly within the visual color system. This latter is not necessarily localized: we could wonder indeed whether it is more legitimate to restrict color perception to a (possible) end-point of processing or to consider the whole, distributed, process. Distributed processing of synesthetic associations would in fact make more sense, since it may seem odd that a unique, specific region of the visual cortex had specialized to 3 4 5 6 7 8 9 10 11 12 13 14 15 16 17 18 19 20 21 22 23 24 25 26 27 28 29 30 31 32 33 34 35 36 37 38 39 40 41 42 43 44 45 46 47 48 49 50 51 52 53 54 55 56 57
For Peer Review
code random associations between graphemes and colors – these associations being made by children possibly at a late developmental stage (Simner et al. 2009). In fact, we did observe in our data some encouraging signs that distributed coding of synesthetic colors may be found in the visual cortex: even though graphemes did not elicit any stronger response than the fixation point in any of our ROI, we did observe significantly larger beta weights for graphemes than pseudo-graphemes (Figure 3). Since this difference is hidden in noise it is difficult to interpret, but it corresponds to what we could expect if synesthetic colors were coded in a sparse fashion within the visual cortex. Such a difference could also be due to a distributed coding of graphemes rather than synesthetic colors (Hubbard and colleagues did observe in 2005 a stronger response to graphemes than pseudo-graphemes in most visual areas of their non-synesthete controls as well), but we did also measure significant (though borderline) ‘adaptation in noise’ for both real and synesthetic colors (see technical report available at www.cerco.ups-tlse.fr/~hupe/synesthesia_adaptation.html, in particular Figure 3). A critical test could be to identify the voxels that exhibit a biased response in favor of graphemes (compared to pseudo-graphemes), and test in synesthetes whether these voxels display a biased response toward the specific color reported by synesthetes for each grapheme. The question of shared neuronal representations for real and synesthetic colors could therefore be assessed with voxel-based pattern classification approaches. Such techniques would have two advantages: they do not make any localizationist assumption, and they do not suffer from the ill-posed problem of correcting for multiple comparisons of signals correlated to an unknown degree (O'Toole et al. 2007).
Synesthesia and the retrosplenial cortex
3 4 5 6 7 8 9 10 11 12 13 14 15 16 17 18 19 20 21 22 23 24 25 26 27 28 29 30 31 32 33 34 35 36 37 38 39 40 41 42 43 44 45 46 47 48 49 50 51 52 53 54 55 56 57
For Peer Review
Our structural analysis revealed white matter increases in the retrosplenial cortex (RSC) and the left STS of synesthetes. Since our population groups were small (10 vs. 25), such observations require to be confirmed on larger groups before being sure it is related to synesthesia (and other more subtle structural differences may also be discovered when testing larger groups). Our discovered locations could however open a different way of thinking about synesthesia. The increase of WM in the left STS was just significant but it lies within a typically multimodal region. The increase of WM in the RSC was bilateral and clearly above chance level on the right side, so we are more confident that it should be found in other synesthetes. Interestingly, an increase of BOLD response in the RSC had been observed (but no correction for multiple comparisons was applied) by Weiss and colleagues (Weiss et al. 2001) in a single subject who experienced synesthetic colors for personally familiar names. In the same vein, Nunn and colleagues (Nunn et al. 2002) observed activation for hearing words (compared with tones) in synesthetes but not in controls in the left posterior cingulate (Brodmann areas 23 and 31, adjacent and strongly connected to the RSC (Vann et al. 2009)). The possible role of the retrosplenial cortex in synesthesia was therefore already proposed, for example by Ward (Ward 2004).
The numerous particularities of the RSC (Brodmann areas 29 and 30 (Vann et al. 2009)) make it an ideal candidate region to explain various synesthetic associations. It has functional and anatomical links with the memory system (hippocampal formation and parahippocampal region) and is involved in emotion processing (Maddock 1999). A synesthetic association can be considered as a memorized (arbitrary and idiosyncratic) association loaded with emotional content (the feeling of obviousness). Also of particular interest, in the monkey the RSC sends some connections to area V4 (Kobayashi and Amaral 2007). The RSC may therefore link visual attributes (color, texture, shape) to emotion and memories. Of relevance for the frequent 3 4 5 6 7 8 9 10 11 12 13 14 15 16 17 18 19 20 21 22 23 24 25 26 27 28 29 30 31 32 33 34 35 36 37 38 39 40 41 42 43 44 45 46 47 48 49 50 51 52 53 54 55 56 57
For Peer Review
involvement of language in synesthesia, Awad and colleagues (Awad et al. 2007) showed with PET that the RSC was involved in basic speech production and comprehension, in connection to memory. Additionally, the implication of the RSC in representing familiar associations and relating objects to their context (Bar 2004) echoes the hypothesis that ‘personification and individualization of icons’, a frequent type of synesthesia, ‘is yielded by an overactivity of neurobiological processes generating contexts’, in relation, again, to emotion and memory (Emrich, Neufeld, Sinke, Zedler & Dillo. UK Synaesthesia Association Annual Conference, Brighton, UK, 2010). The RSC is also with the posterior cingulate cortex a main hub of the default network (Buckner et al. 2008). The default network is active ‘when individuals are engaged in internally focused tasks’ (Buckner et al. 2008), in particular when they engage semantic memory (Wirth et al. 2011). The RSC is specifically involved when shifting ‘attention from the external world to internal mentation’ (Buckner et al. 2008) – a formulation that could well describe the synesthetic experience, an internal representation triggered by an external stimulus. We did not observe any default network BOLD activation by synesthetic colors; however, we did observe a surprising and significant negative correlation between synesthesia-related BOLD activity in the early visual cortex and the strength of synesthetic associations. Such a negative correlation could correspond to a stronger disengagement of stimulus (graphemes) processing for synesthetes with stronger, self-generated, associations. Finally, the default network matures during development (after age 7-9 (Fair et al. 2008)), which leaves room for acquisitions of synesthetic associations during development (Simner et al. 2009). Functional connectivity networks, derived from task-free fMRI data, while indicating a similar ‘small-world’ topology at a global level between 7-9-y-old children and young-adults, revealed several key differences in local organization (Supekar et al. 2009). For instance, children had a lesser degree of functional hierarchy and a different interregional functional 3 4 5 6 7 8 9 10 11 12 13 14 15 16 17 18 19 20 21 22 23 24 25 26 27 28 29 30 31 32 33 34 35 36 37 38 39 40 41 42 43 44 45 46 47 48 49 50 51 52 53 54 55 56 57