A Color Spatial Display
Based on a Raster Framebuffer and Varifocal Mirror
by
Kenneth M. Carson
B.S.E.E., Massachusetts Institute of Technology 1982
Submitted to the Department of Architecture in partial fulfillment of
the requirements for the degree of
Master of Science in Visual Studies
at the
Massachusetts Listitute of Technology
February 1985copyright (c) Massachusetts Institute of Technology 1984
Signature of author ... Kenneth M. Carson Department of Architecture Tuesday, 25 September 1984 Certified by ... ,... ... Accepted by Chairman,
Professo9 Andrew Lipp man Associate Professor of Media Technology Thesis Supervisor
Professor Nicholas Negroponte Departmental Committee for Graduate Students
1 sOF TECHNOLOGY
MITLibrar-es
Document Services Room 14-0551 77 Massachusetts Avenue Cambridge, MA 02139 Ph: 617.253.2800 Email: [email protected] http://Iibraries.mit.eduldocsDISCLAIMER OF QUALITY
Due to the condition of the original material, there are unavoidable
flaws in this reproduction. We have made every effort possible to
provide you with the best copy available. If you are dissatisfied with
this product and find it unusable, please contact Document Services as
soon as possible.
Thank you.
The images contained in this document are of
the best quality available.
A Color Spatial Display
Based on a Raster Framebuffer and Varifocal Mirror
byKenneth M. Carson
Submitted to the Department of Architecture on September 25, 1984 in partial fulfillment of the requirements for the degree of
Master of Science in Visual Studies.
Abstract
A very simple 3D color display has been constructed. It consists of a 2D display viewed in a rapidly vibrating varifocal mirror. The changing focal length of the mirror is responsible for providing the depth; when the mirror is forward, the image appears closer, and when the mirror is back, the image appears further away. The mirror motion is synchronized with the refresh of the 2D monitor to form stable spatial images. The mirror is simply a bass drum with a commercially available aluminized mylar drum head on one side and a hifi woofer on the other side to provide the driving force. The 2D display is a standard black and white X-Y plotting monitor with a Tektronix liquid crystal color shutter to provide red/green sequential color. The X-Y plotting monitor is driven with signals from a 24-bit raster graphics framebuffer. In total, this is a remarkably inexpensive spatial display, and the first of its kind to incorporate multicolor imagery.
This paper surveys much of the work in 3D that has led to the techniques employed in the project. The bass drum spatial display is described in detail, including hardware, software, and other practical concerns of its design, plus techniques for realtime interaction. Applications that require a good spatial display are discussed as motivation for this work.
Thesis Supervisor: Andrew Lippman Title: Associate Professor of Media Technology
Table of Contents
Introduction 5
Chapter One: Survey of Three Dimensional Imaging 7
1.1 Depth perception cues 8
1.1.1 Physiological cues 8
1.1.2 Psychological cues 10
1.2 Stereoscopic displays ii
1.3 Autostereoscopic displays 17
Chapter Two: Previous Varifocal Mirror Displays 24
2.1 Theory of operation 24
2.2 Early experimentation with varifocal mirror displays 28
2.3 SpaceGraph 30
2.4 UNC raster driven varifocal display 34
2.4.1 Vector display from raster framebuffer 34
2.4.2 Realtime interaction 36
Chapter Three: Color Varifocal Display 38
3.1 Hardware 39
3.2 Software 43
3.2.1 Image definition 43
3.2.2 Image rendering 44
3.2.3 Realtime interaction via lookup table manipulation 47
3.3 Design concerns and problems 51
3.3.1 The monitor and color shutter 51
3.3.2 Video quality 53
3.3.3 The mirror 53
3.4 Future work
55
Chapter Four: Spatial Display Applications
58
4.1 Seven reasons for a spatial display
58
4.2 Spatial imaging applications
60
4.2.1 Geological applications
60
4.2.2 Medical applications 60
Appendix: Mirror Optics 63
Acknowledgements 65
Introduction
Visual telecommunication, communication remote in either time or space, is becoming increasingly important as technology makes it available. Vision is perhaps our most important sense for experiencing the world and is trusted to provide us
accurate, farreaching, reliable information about our surroundings. The invention of photography (1839) has made possible very believable, undistorted views of reality. Prior to photography, all visual images were subject to an artist's interpretation, resulting in images that were usually strongly effected by the artist's point of view. Now visual images can present a more impartial message, because photography easily provides an accurate record of what the photographer observes.
Motion pictures take the realism of photographs one dimension closer to the experience of being there. Movies and television allow one to "witness" events displaced in time or space. The experience can be so believable and real that it is easy to forget the distinction between the event itself and the record of the event.
A natural step for visual communication to take is toward spatial images. Just as a color display- presents greater amounts of information in a more realistic and easier to understand form than a monochrome display, a spatial display presents more information, more realistically and understandably than a 2D display.
The communication improvement of a spatial image display over a flat display can be compared to the gains of the telephone over the telegraph. The telegraph (1835) was the first invention to provide instantaneous long distance communication. It would seem that the telephone (1876) was not nearly as significant a breakthrough since its function is essentially the same. The telephone, though, clearly has features which make it much more useful than the telegraph. First, the user interface is simple and direct. It does not require learning a special
language or set of codes. Secondly, telephone communication is very real, very personal. Natural conversation allows the distance between the speakers to be forgotten. A spatial display is able to significantly enhance visual communication, just as the telephone significantly improved long distance communication.
In this information age, computers play essential roles in telephony, publishing, television, and most other forms of telecommunication. Computers are now becoming a communication appliance themselves, used for electronic mail and information retrieval of all sorts. The direct human-machine interaction associated with computing has evolved tremendously from the days of punch cards, paper tape, and teletypewriters. Today, voice recognition, various 2D and 3D spatial pointing devices, and image scanners can be used for input, with voice synthesis, robot manipulation, and high resolution color images for output. A spatial display under computer control promises even better and more natural human-machine communication.
Chapter one of this paper describes some of the many approaches to 3D imaging that have been tried. Particular attention is paid to those approaches that led to the development of varifocal mirror displays. Previous varifocal mirror display systems are examined in chapter two. The varifocal mirror color display built here at the Architecture Machine Group is described in detail in chapter three. The fourth chapter considers what a spatial display can be useful for and why it is a topic worth pursuing. The Appendix contains the mathematical details of varifocal
Chapter One
Survey of Three Dimensional Imaging
Throughout the century people have been interested in 3D viewing techniques and have made sporadic improvements to the technology. These techniques have ranged from the straight-forward stereo image pair with viewer, to sophisticated white light holograms. There are many ways to characterize the different 3D viewing systems. Every approach has its limitations and its strengths.
The number of different views and viewpoints provided is a major characteristic which can distinguish the approaches. Stereoscopic displays show the viewer only one point of view. A different image is presented to each eye providing binocular parallax, but the image doesn't change as the viewer- moves. Autostereoscopic displays present a complete spatial image, in which it is possible to see the righthand side of objects by moving to the right, or the lefthand side by moving left (see Figure 1-1).
Other important characteristics serve to differentiate 3D displays. Some require special glasses for viewing. The illumination requirements of some require viewing in a special environment. Some of the displays can show color images as easily as one can change from black and white film to color film, but others cannot display color at all. The image size and possible audience size can be restricted. Some of the techniques are more easily adapted for motion pictures than others. And, of course, the cost of the different displays varies widely.
The first section of this chapter describes the different cues used for depth perception. The various 3D displays provide different combinations of the natural cues. The second section of this chapter reviews several stereoscopic display
Hologram or other autostereoscopic
B display aperture Reconstructed
A -- b image a d- _g ~c
I-~---- DY Rays defining solid angle of observation CFigure 1-1: Autostereoscopic viewing [Rawson 691.
techniques. The last part of this chapter describes several autostereoscopic displays.
1.1 Depth perception cues
Okoshi describes ten cues to visual depth perception [Okoshi 76]. The four most important cues are physiological in nature. The remaining six are psychological, dependent on knowledge and experience.
1.1.1 Physiological cues
The muscular tension exerted by the eye to change focus can be interpreted to determine distance. This cue is known as accommodation, and is only useful for distances less than two meters. Accommodation is a monocular cue, requiring only one eye to derive depth information.
When focused at infinity the eyes are parallel, but when viewing anything closer, the paths intersect. The muscles which rotate the eyeballs in order to align the two images provide a cue known as convergence. This cue is strongest for close
objects, since it depends on the angular disparity between the eyes. A one degree difference in angle between the eyes' line of sight corresponds to a change of viewing from infinity to 3.58 meters as well as the change from 25 to 23.4 cm.
Figure 1-2: Points of convergence for equal angle increments.
The different point of view presented to each eye is interpreted to provide depth information. This cue is known as binocular parallax. As the eyes are converged viewing some point, the surrounding points do not match precisely. A closer point will appear farther to the right in the left eye and farther to the left in the right eye. Farther points appear more to the right in the right eye and more to the left in the left eye. Notice the difference between the two views in the stereogram of Figure 1-3. Since the distance between points on the retinal image is dependent on the angular displacement of the objects, there is finer depth resolution for near objects than there is for far. While a displacement of 0.8 mm is detectable at 1 m, at 100 m the displacement must be at least 8 m to be detected. Binocular parallax is generally considered the most important depth cue.
Multiple points of view seen from a single eye can be interpreted in the same way as views from two eyes. This is called monocular movement parallax, and is
Figure 1-3: Simple stereogram [Lane 82].
most apparent when the observer is changing point of view rapidly.
1.1.2 Psychological cues
The following psychological depth cues depend on knowledge and experience in viewing. Retinal image size can be used to evaluate depth when the objects are of known size. Experience provides the viewer with a sense of how large real world objects should be. The appearance of objects becoming smaller in the distance is called linear perspective.
r r r r' r~ r i,
Figure 1-4: Example of linear perspective.
Distant objects tend to be less clear than near objects, due to haze. This effect is known as areal perspective. Overlapping outlines of objects provide depth information. In Figure 1-5, the simplest interpretation of the outlines provides depth relationships. Experience allows interpreting shades and shadows for depth information. Lighting is known to usually come from above, so shadows can
Figure 1-5: Overlap implied by simple outlines [Okoshi 76].
distinguish concavity from convexity. The texture gradient of a regular surface, such as brick, also provides depth information.
1.2 Stereoscopic displays
The simplest of 3D displays are those which provide distinct flat images to each eye from a single point of view. This is analogous to stereo music, in that it requires separate recordings of the same scene from slightly different points of view. The records are very similar to each other, and when viewed (or listened to) individually provide a traditional flat image. But when viewed (or listened to) in combination, the subtle differences spring to life with a startling spatial effect. The analogy can be carried further to illustrate the limitation of stereoscopic displays. When listening to stereo sound through headphones, the orientation of the sound source doesn't change with the listener's head motion, rather the sensation is that the sources move with the head. With only two images available in a stereoscopic display, it is impossible to provide a sense of motion parallax. Instead, it is rather confusing to interpret the lack of motion parallax when binocular parallax is present.
Every type of stereoscopic display must solve the problem of providing a separate image to each eye.
stereoscope (1838) used mirrors to allow viewing potentially very large distinct images.
Figure 1-6: Wheatstone and Brewster stereoscopes [Lane 82].
Brewster used prisms to allow viewing side-by-side stereo pictures (1849). The parlor stereoscope improved upon this by incorporating convex lenses to. put the image plane beyond the effective range of accommodation as a depth cue. Without accommodation as a conflicting cue, the various psychological cues are accepted to provide more depth information.
Lef t Lens
eyeLeft-eye
Virtual images are fused by each eye in this region Retinal -images Right Right-eye eyeobject gr Lens
Anaglyph stereo displays use different colored light to distinguish between the two views. Colored glasses must be worn in order to filter out the unwanted image from each eye.
RED RIGHT RYE
CYAN Z= CYAN
Figure 1-8: Anaglyph projection display [Lane 82].
The colors must be spectrally distinct, typically red and green or red and blue are used. This system doesn't require special optics to allow convergence of the images since the images can be presented on top of each other. The images are spectrally distinct, rather than spatially distinct as with the stereoscope. Simple anaglyphs are incapable of presenting color images, and viewing results in unacceptable eye strain because of the extreme adaptation required to compensate for the color shift between the eyes. Another problem is that it is unusual for the image colors to perfectly match the filters in the glasses. This filter mismatch results in incomplete image discrimination to each eye, or crosstalk. Both eyes see a ghost of the image intended for the other eye. The advantage of anaglyphs is that they are inexpensive; they can be adapted for print, projection, and television with no special equipment required.
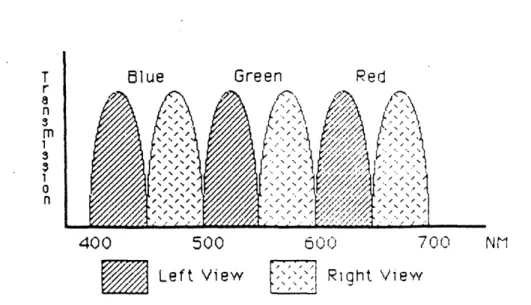
Spectral encoding could work in color if good filters could be found that allowed separating two distinct bands of red, green, and blue (see Figure 1-9). This would provide each eye with unique RGB images. Such a system would probably solve the eyestrain problem since each eye would be receiving a color image, but the
T Blue Green Red
M
//X
400 500 600 700 NM"'
Left View
Riqht View
Figure 1-9: Filters for color anaglyph display.
system would no longer be easily compatible with print and television since 6 spectrally unique primaries are needed.
Another approach to stereoscopic viewing uses orthogonally polarized left and right images. Glasses must be worn with the corresponding polarization to separate the left and right images.
RIGHT EYE
POLARIZER
JD POLARIZING 'LASS.S
Figure 1-10: Polarized stereo projection [Lane 821.
This approach is very similar to the anaglyph system, but rather than using separable colors, separable light polarization is used. This technique allows displaying full
color images, but there are disadvantages with this approach. The glasses substantially reduce the light level, thus requiring more light from the source. Incomplete image separation can occur if viewers do not maintain perfect upright orientation of their glasses. In projection systems, special screens must be used to maintain the polarization of the light. There is no simple way to use polarization with existing television equipment. Though it is possible to make reflected light viewable prints, known as vectographs, the technique is not a standard printing process.
A time multiplexed display can be used for television. The two fields which compose a video frame can each be used to present an image to only one eye. The viewer watches this display with special PLZT (lead (Pb) Lanthanum Zirconate Titanate) glasses which alternately open and close each eye in synchrony with the
video display.
NERCEPT TELEVISION
RIGHT CAMERA MONITOR % TELEVISED OBJECT IMAGE
VIRTUAL IMAGE LEFT PLZTPZ SHUTTER ALEFT CAMERA I IMAGE RIGHT PLZT RIGHT TELEVISION SHUTTER CAMERA
LEFT TELEVISION CAME RA
Figure 1-11: PLZT stereo television system [Fisher 81].
This results in each eye seeing an image composed of half the normal number of lines, i.e. half the vertical resolution. In addition the refresh rate is 30 Hz rather than the effective 60 Hz provided by interlace, and thus flicker is a problem. The glasses are not very efficient, passing only about 20% of the available light. The PLZT ceramic is sandwiched between orthogonal polarizers and when activated applies a quarter wave rotation to the light, thus passing it through the second polarizer. The
FRONT UNEAR POLARIZER AXIS Of
POLARIZATION
Figure 1-12: PLZT shutter assembly [Fisher 81].
video system and monitor are completely unmodified, but the glasses are expensive. [Schmandt 82] Lenny Lipton has developed a stereoscopic television system which uses PLZT glasses and televisions modified for an increased refresh rate to eliminate the flicker problem.
A simple approach to stereo viewing free from glasses, proposed by F.E. Ives in 1903, is called the parallax stereogram. The parallax stereogram is based on the general idea of a parallax barrier, which allows viewing only small strips of the entire image from any one point of view (see Figure 1-13). The geometry is such that each eye sees a distinct image from a spatially interwoven pair of images.
Lenticular-sheet binocular pictures are another variety of 3D imaging which require no special glasses. The lenticular sheet is an array of cylindrical lenses whose focal plane is the back surface of the sheet (see Figure 1-14). The lenses act to spatially interlace the binocular views in much the same was as the parallax stereogram.
L0
L
F igure 1-13: Parallax stereogram [Lane 82].
Left-eye image Right-eye image Right eye Left eye Lenticular sheet
Figure 1-14: Lenticular-sheet binocular viewing [Okoshi 76].
1.3 Autostereoscopic displays
An autostereoscopic display is a 3D display in which the scene can be viewed
from many different angles, and from each angle a slightly different image is seen. As one moves to the left, more of the left side becomes visible. The perspective and
point of view change with the viewing position.
the first 3D process to produce accommodation cues as well as parallax and convergence depth cues. In normal photography every point on the film stores a light intensity corresponding to the light intensity of a point in the scene. In holography each point stores a light intensity and a direction from which that intensity is to be viewed. This information is encoded as an optical interference pattern. When recording an image, the interference pattern is generated by the intersection of a laser reference beam and the coherent illumination reflected by the scene being recorded.
L Half mirror Y Object O0 z Photographic plate se L Observer
Virtual image Hologram
Figure 1-15: Arrangement for recording and viewing a hologram [Okoshi 76].
The image of the scene is reconstructed from the interference pattern by illuminating the hologram with coherent light from the same direction as the reference beam used during the recording process.
There are numerous drawbacks to holography, some caused by the use of coherent light. Real daylight scenes cannot be directly recorded and images are monochromatic and appear grainy. The high resolution film is expensive and the image information storage is highly redundant, so traditional holography is not an economical recording process. There are many new developments in holography
which attempt to overcome these problems. These include white-light recording or reconstruction, color holography, and projection holography.
A more complicated parallax barrier than used for parallax stereograms can display images with multiple points of view. These images are known as parallax panoramagrams.
Figure 1-16: Parallax panoramagram [Lane 82].
In a similar manner, lenticular-sheet binocular images can be expanded to autostereoscopic images. For every point of view the lenses select and magnify appropriate image strips. When viewed from extreme angles, the lenses select image strips from adjacent lenticules. Thus the image repeats itself periodically, creating viewing zones (see Figure 1-17). Both of these processes are sensitive to motion parallax in only the horizontal direction, and image resolution is traded for additional viewpoints.
Lenticular-sheet spatial viewing techniques are a simplification of integral photography which was developed in 1908 by M.G. Lippmann. This technique uses
Figure 1-17: (a) One view of a lenticular sheet, (b) repeated lenticular viewing zones [Lane 82].
a fly's-eye lens sheet, a sheet of many thousands of convex lenses which focus on the back plane of the sheet. A photographic emulsion on the back of the lens sheet captures a tiny image for each lens.
Illumination Fly's-eye lens Photographic plate
O b ject i ma g e
HU.U U
Figure 1-18: Recording and reconstruction of an integral photograph [Okoshi 76].
Each image captured is from a slightly different point of view. After processing, the scene is reconstructed by viewing through the lenses. The reconstructed scene provides two dimensions of motion parallax. The original recording is a pseudoscopic image, one in which the depth information is reversed. The final image is created by rerecording the pseudoscopic image. Good quality lens sheets are difficult to make, so not much has been done with integral photography.
The time multiplexed stereoscopic television technique previously described has been extended into an autostereoscopic display system, still using the PLZT shutter glasses for viewing. A computerized system linked to a 3D head tracker determines the appropriate image for the current viewing position and directs the retrieval and display of this image from a large store of images on optical video disc [Fisher 82]. As computer graphic technology improves, this technique could be employed with realtime image synthesis to provide the images, thus greatly reducing the tremendous visual database otherwise required for even a simple scene.
In 1958 Withey reported on the first autostereoscopic display in which the image was formed by a 2D display that was rapidly scanned in the third dimension
[Withey 58]. His display consisted of a cathode ray tube in which the fluorescent screen was rapidly oscillated in the z dimension inside a vacuum tube.
VIEWING GLOBE. SCREEN ELECTRON GUN GUIDE --- EVE METAL Oscilating ENVELOPE gun screen .RVN gun RODSENOID GUIDE SLEEVE PERMANENT
BARREL CAM MAGNET CAM FOLLOWER ARPNG
STATORLOWER
ROTOR BEARING
VIBRATION ISOLATOR GLASS TUBE
Figure 1-19: Withey's display (a) simplified, (b) detailed [Rawson 69], [Withey 58].
The electron beam drew the desired image on the 18cm screen as it swept out its 3cm of depth. Since the motion was within a vacuum tube, it was possible to move such a large display at up to 30 Hz, with nearly silent operation.
ITT Laboratories developed a scanning spatial display in which the screen rotated at about 20 Hz [Aviation Week 60]. The images were generated on a fixed 2D CRT and optically projected onto a rotating screen.
Rotating ' mirror sran system High-brightness Brightened CRT spot
Figure 1-20: ITT rotating mirror spatial display [Rawson 69].
A similar effect has since been achieved with a spinning 2D array of LEDs [Jansson 80]. See Figure 1-21 for a diagram of the LED display. The resolution and intensity of these displays decrease away from the axis of rotation.
A device, the Synthalyzer, has been developed to project spatial images [de Montebello 77]. In the Synthalyzer, frames of 16mm film are projected onto a rotating screen whose height varies, thus stacking the frames to form a solid image (see Figure 1-22). Sixty-five frames are mounted on a transparent drum which rotates at about 1200 RPM, providing a complete spatial image with 65 planes 20 times per second. The frames are illuminated by a strobe to avoid motion blur. A mask can be manipulated to obscure portions of the image, highlighting arbitrary planar slices.
BELL JAR LED
ARRAY
COOLING WIRES FRO
AIR INLET HUB COOLING Al I ARRAY R DUCTS BOARDS - - - CIRCUIT BOARD CONNECTORS BASE
Figure 1-21: Rotating LED array mechanism [Jansson 80].
-'-3 PROJECTION SCREEN
MASK
i-Figure 1-22: The Synthalyzer [Lane 82].
CYLINDE!
COOLING AIR OUTLET
Chapter Two
Previous Varifocal Mirror Displays
In 1961 Muirhead reported on a very simple design for varifocal mirrors with large variability of focal length [MLirhead 61]. His mirror design consists of a metalized plastic film stretched over a rigid frame with an airtight cavity on the back side. When suction is applied to the cavity, the mirror flexes back, acting as a concave spherical mirror. Similarly, under pressure the mirror surface becomes convex.
ROD BASE
METALED -AR-PRESSURE
OR VACUUM
NO. PRESSURE APPLIED SUCTION APPLIED PRESSURE APPUED PLANE MIRROR CONCAVE MIRROR CONVEX MIRROR
Figure 2-1: Muirhead's varifocal mirror design [Muirhead 61].
This mirror design is the basis for varifocal mirror spatial displays [Traub 67]. The pressure variation required behind the membrane is easily supplied by conventional hifi woofers.
2.1 Theory of operation
An autostereoscopic image can be generated by using a 2D point plotting random scan monitor and a rapidly vibrating stretched-membrane varifocal mirror. When the reflection of the monitor is viewed in the mirror, the distance to the image is dependent on the focal length, or position, of the mirror. When the mirror is
convex, the image is closer than it would be in a lat mirror, and when the mirror is concave, the image is farther.
Sequence of images formed in the
'varifocal mirror"
Figure 2-2: Varifocal mirror spatial display [Rawson 69].
To form an autostereoscopic image, the mirror must oscillate through the range of focal lengths at a rate that exceeds the flicker threshold of human perception. At such high speeds, images drawn on the display will be perceived as stable if the mirror motion is synchronized with the drawing. Persistence of vision merges the points into a stable image just as a picture on a television tube appears stable. The points drawn on the monitor appear at positions in space which depend on the exact position of the mirror when the points are displayed.
The image generated is transparent, nearer parts of the image do not block farther parts. Because light is additive, there is no way to portray an image with properly hidden surfaces. In traditional computer graphics, hidden surfaces are obscured by not drawing them, but in the spatial display this approach would accurately present only a single point of view.
The arrangement works in essentially the same way as Withey's system, which used an oscillating screen. The essential difference is that instead of moving the screen, an oscillating mirror is used to move the image of the screen. There is a significant mechanical advantage in using the varifocal mirror rather than moving the screen. Very small displacements of the mirror cause large changes in its focal length, which cause the image to move substantially. Image displacement of 10 to
100 times the mirror displacement are typical.
The spatial image is bounded by the volume swept out by the surface of the monitor as the mirror oscillates. This volume is not a rectangular solid, but rather it
is the frustrum of a rectangular pyramid, with the narrow end toward the viewer. This shape results in anomalous perspective in which near objects appear smaller,
and far objects appear larger.
CRT Object size: constant a. b, n
Varifocal mirror Eye
Beam s plitter
"Anomalous" perspective (a1(y)
Figure 2-3: Increasing lateral magnification with depth [Rawson 69].
This is an undesirable side effect of using the changing focal length to amplify the mirror displacement. To correct this anomalous perspective, the image must be distorted before display (see Figure 2-4). One aspect of this distortion is that the planes of the image must be shrunk according to their depth, to cancel the
size: a (1/ Magnification)
Eve a b' c
Normai perspective (a) S)y)
Figure 2-4: Scaled CRT image corrects lateral magnification [Rawson 69].
Another effect of the anomalous perspective is that the image position is a nonlinear function of the mirror displacement.
a a a a a a
Figure 2-5: Nonlinear placement of image planes [Rawson 69].
This problem has been handled in several different ways, ranging from distorting the mirror motion [Rawson 68], to changing the display refresh speed [Stover 81]. (See the Appendix for mathematical details of the mirror optics.)
Image planes
Figure 2-6: Linear placement of image planes [Rawson 69].
2.2
Early experimentation with varifocal mirror displays
Traub, working at MITRE, was the first to propose applying Muirhead's simple varifocal mirror to volumetric display [Traub 67]. He reports development of displays using four different kinds of image source. In the first, an oscilloscope was used to display 3D Lissajous figures (see Figure 2-7). The second image source was a computer which generated an air-traffic control simulation (see Figure 2-8). A ground reference map and mobile aircraft at various depths were displayed. Another computer generated display showed mathematical functions in 3D as an aid for mathematicians to more fully understand the nature of the functions. The third image source consisted of color photographic slides mounted on a spinning wheel which were stroboscopically projected onto a rear projection screen in front of the mirror. The high speed slide arrangement ran with the mirror oscillating at 30 Hz and 10 slides displayed for each cycle of the mirror, to provide 10 planes of depth. Images were displayed only for one stroke of the mirror. The slides and mirror were photoelectronically synchronized. The fourth image source was a bank of NIXIE tubes which presented a spatial numerical display, which could be altered in real time.
Figure 2-7: Stereo view of Traub's oscilloscope with Lissajous pattern [Rawson 69].
Figure 2-8: Stereo view of Traub's air-traffic control simulation [Rawson 69].
A computer generated spatial movie system was developed at Bell Labs
[Rawson 69]. A high speed 16 mm movie projector displayed a sequence of 15
frames for every forward sweep of the mirror on a rear projection screen, followed
by 15 opaque frames for the backward sweep. Thus, the image displayed had 15
planes of depth. The projector ran at
450
frames/second, so the overall refresh rate
was 15 frames/second, just barely above the flicker threshold. Special timing pulses
were put on the film, to allow synchronizing the free-running projector with the
mirror oscillations.
High-speed 16L
movie projector
Figure 2-9: Varifocal mirror movie display system [Rawson 69].
A sawtooth waveform was used to drive the mirror, correcting the nonlinear depth
versus mirror displacement to provide uniform spacing of the 15 frames forming the
spatial image [Rawson 68]. They found that the high frequency components of
nonsinusoidal driving waveforms excited multimodal oscillations in the mirror.
Component frequencies over 200 Hz were unsuitable. A nearly linear image
displacement sweep was achieved for almost 90% of the oscillation period.
2.3 SpaceGraph
A varifocal mirror style spatial display was developed into a robust marketable
form by Bolt Beranek and Newman during the late 1970s. The design was licensed
to Genisco, and was introduced as a product at SIGG RAPH '81 in Dallas.
The SpaceGraph incorporated several important features.
Of particular
interest is the mirror design, the solution to anomalous perspective, and the different
display modes.
Figure 2-10: Rigid mirror in BBN's SpaceGraph [BBN 80].
Lawrence Sher, the SpaceGraph designer, did not consider the standard
stretched membrane varifocal mirror to be robust enough for commercial use, so he
developed a rigid plastic mirror with a fundamental resonant frequency of 30 Hz.
The mirror is supported by a concentric hinge about which it oscillates. When
excited by a hifi woofer running at 30 Hz, the center flexes back and forth while the
edges flex the opposite direction. This combination of forward and backward
motion produces a cancellation of acoustic energy. The clean sinusoidal motion of
the mirror avoids undesirable harmonics, also reducing the noise of the system [Sher
-4
-4
-
(/
IFigure 2-11: Mirror motion resulting from edge and concentric support.
SpaceGraph uses special purpose electronics to correct for anomalous perspective [Stover 81]. The depth dependent lateral magnification is corrected for in hardware as the digital X and Y signals are converted to analog. Performing this function with special electronics reduces the software overhead considerably. The nonlinear image depth versus mirror displacement is corrected by using a variable rate clock for the display data. The clock runs fastest when the image depth is changing fastest. C 0 C
k
Rt
0
1/60
1/30
Time (seconds)
Figure 2-12: Variable clock rate vs. time for linear arrangement of planes. Correcting for anomalous perspective in this manner provides the very important
benefit of uniform point distribution in the computational and display space. Objects can be moved forward or backward in the display without scaling the object description data, since the scaling occurs in the display process.
There were three different display modes for SpaceGraph as BBN developed it [Sher 80]. The difference between the modes is how many spatial dimensions are swept rather than plotted (see Figure 2-13). For all three modes the depth, Z, is swept through its range of values. In the first mode, X and Y are plotted as Z is swept. In the second mode, Y is plotted as X and Z sweep. In the third mode X, Y, and Z all sweep.
For Modes A, B, or C,
WAIT for z-sweep to get to desired z-value
Mode A Mode B Mode C
WAIT for x-sweep WAIT for y-sweep Plot (xIy) to get to desired x to get to desired y
Time
Intensify beam to WAIT for x-sweep desired brightness Plot y to get to desired x
intensify beam to Intensify beam to desired brightness desired brightness
Figure 2-13: BBN SpaceGraph modes of operation [Shershow 80].
The first mode is a vector style display which is useful for relatively sparse images constructed from line segments. The second mode is a tine-base oscilloscope in which a surface is displayed. The third mode is a raster display, appropriate for images involving many points. One advantage of scanning is that memory is not needed to store the scanned dimension parameters, but an intensity value must be stored for each unique location scanned by. For example, in the raster mode the X and Y signals are generated by a function and thus do not need to be stored in the memory along with the intensity information, but intensity information must be
stored for every (X,Y,Z) combination displayable. Scanning is efficient only when most of the positions scanned have non-zero intensity. Another advantage of scanning is that the beam deflection of the CRT is known to be small, so the monitor can be run faster, displaying more points than if the display speed were determined by a worst case beam deflection of the screen diameter. The SpaceGraph marketed by Genisco provided for only the vector and raster modes.
2.4 UNC raster driven varifocal display
The University of North Carolina pioneered the use of nonspecialized hardware for varifocal mirror display refresh [Fuchs 82a]. In addition they have made remarkable progress in the area of realtime interaction with the varifocal mirror display [Fuchs 82b].
2.4.1 Vector display from raster framebuffer
A standard 24-bit raster framebuffer is used to provide the control signals for a point plotting CRT. The framebuffer is used as a digital store of information which produces high-speed analog output from this information. The red video signal controls the X deflection, the green signal controls the Y deflection, and the blue signal controls the intensity. Each pixel on the framebuffer represents a position and intensity on the point plotting display. The lateral resolution is limited to 256 by 256 since the controlling signals are 8-bit values. Normal video frame rate provides for 30 Hz refresh of the image.
The depth location in the spatial display is determined by when the point is displayed on the 2D monitor with respect to the mirror motion. With a framebuffer designed for standard 30 Hz two-field interlaced video, output is scanned left to right for each line. The lines are organized for display by field; first all the even lines then all the odd lines. In other words, a point stored at the beginning of line 0
Figure 2-14: A picture (top left) and the video image of its transformation
(top right) which when viewed on a video waveform monitor (bottom) appears
as the original picture. This is another example of framebuffer memory used
for nonraster scan display.
in the framebuffer will be displayed at the opposite extreme of the viewing space
from a point stored at the beginning of line 1 (see Figure 2-15).
Most vector display systems use a display list whose length determines the
refresh rate; longer lists refresh less often. A varifocal mirror display has a refresh
rate fixed by the rate of the mirror oscillation. For a sparse image the display spends
very little time actually drawing. In addition, when driven by a raster framebuffer
about 10% of the display time is lost due to video blanking for retrace. This isn't
1st FIELD VERTICAL RETRACE
Xp
- -V
2nd FIELD VERTICAL RETRACE
Figure 2-15: Interlaced video
2 4 6 2nd FIELD RASTER SCAN
raster scan pattern [Conrac 80].
much of a disadvantage since most of that time is spent at one extreme or the other of the available depths.
2.4.2 Realtime interaction
Using an Ikonas framebuffer with graphics processor and interfaced through the host computer, realtime cursor movement, translation, scaling, spatial windowing, and intensity windowing are 82b].
a 3D joystick image rotation, possible [Fuchs
The framebuffer memory is divided into two display regions to allow double buffering, and the remainder of the memory is used for the 3D object definitions (see Figure 2-16). The graphics processor constructs new images based on the display list and joystick interaction. The 3D manipulations are performed by standard 4x4 transform matrices.
The display draws for only one direction of the mirror sweep to simplify image
buffer currently displayed on CRT
buffer currently being built
Figure 2-16: Framebuffer organization [Fuchs 82b].
generation and sweep alignment. The space is divided into 64 slabs of uniform thickness for simplicity of image rendition, but each contains a variable number of points due to the anomalous perspective. The mirror sweeps the depth with a continuous waveform, so no two points are really at the same depth, but the resolution of depth perception is believed to be coarse enough for 64 levels to appear continuous. The graphics processor maintains pointers to the next free element of each slab so that points can easily be assigned a position in the framebuffer as they are drawn.
An interactive cursor is drawn in slots reserved at the end of each slab. This approach facilitates drawing and erasing of the cursors since the usual buffer allocation routines can be circumvented.
Chapter Three
Color Varifocal Display
Figure 3-1: Stereo view of the color varifocal mirror display.
A color spatial display system has been developed using the varifocal mirror
technique of scanning depth from a 2D monitor. Special purpose hardware was
avoided by using the raster framebuffer approach developed at the University of
North Carolina [Fuchs 82a]. The reflection of the monitor in the vibrating mirror
sweeps out a volume of space while presenting a sequence of 2D images
corresponding to planes of depth. The mirror motion is synchronized to the display
of 2D images and run at 30 Hz so that a stable spatial image is perceived.
Persistence of vision stabilizes this scanned image just as it does a normal television
image.
This chapter describes in detail the color display system developed by the
Architecture Machine Group at MIT. First the equipment used for the display will
be described. Then two aspects of the software will be examined: static image
generation and realtime interaction. Third comes a discussion of the issues which
were found to be important in the design and development of this display system.
Finally, the chapter concludes with a look at future directions for color varifocal mirror display research.
3.1 Hardware
Framebuffer
Bass Drum
Red X.-Y Monitor
Blue
-Color Shutter)iae
Image
SpacepcField Function
Detector Generator Audio Amp
HD
VD
-JL
Figure 3-2: System block diagram.
The varifocal mirror used in the display was obtained in a very simple manner. A 24 inch Ludwig bass drum with an Evans aluminized mylar mirror drum head was purchased. This easily satisfied the need for a reflective stretched membrane, since a drum is simply a membrane stretched over a resonant cavity. No complicated design or machining of parts was necessary to attach or tension the mirror, as that is part of the functionality of the drum. The head tension was adjusted for the best single mode oscillation possible when driven at the desired frequency. The head on the other side of the drum was replaced with a wooden ring to support an 18 inch
Cerwin Vega speaker which provides the driving force for the mirror oscillations.
A Tektronix model 608 X-Y display monitor with a Tektronix liquid crystal color shutter produces the 2D image. This is a small high resolution point plotting
Figure 3-3: Bass drum spatial display, front and rear stereo views.
monitor. Despite its small size
(4x5
inch), this monitor was chosen because of the
availability of a color shutter. The color shutter is an electronically controlled
two-state optic filter. A TTL signal causes it to switch between its red and green
transmissive states. The monitor is monochrome, but appears either red or green
when viewed through the color shutter (see Figures 3-4 and
3-5).
Any combination
of these two 'primary colors may be obtained by drawing a point with the
appropriate intensity of first one color and then, after switching the shutter, drawing
the other color. The color gamut'ranges between red, brown, orange, yellow, and
green. The color shutter provides brilliant hues unimpeded by a shadow mask.
A 24-bit raster framebuffer provides the refresh signals for the point plotting
monitor. The red output drives the X deflection input on the monitor, the green
LINEAR R,G COLOR A12 LC POLARIZER
PHOSPHOR POLARIZER RETARDER
Figure 3-4: Liquid crystal color shutter [Vatne 83].
0%L
350 450 550 650 WAVELENGTH (nm)
Fig. 2. Polarizer/phosphor spectra: --- green polarizer; red polarizer; - phosphor spectrum.
Figure 3-5: Spectral response of color shutter and monitor [Vatne 83].
results in X and Y resolution of 8 bits each or 256 positions. Eight bits of intensity information was found to be much more than was useful for this display with typical images. For this reason, most of the intensity framebuffer is usually used to provide various forms of realtime interaction, see section 3.2.3.
The 24-bit framebuffer is actually implemented as three 8-bit Datacube VG-123 framebuffers in separate Sun Microsystems model 1/100U 68000-based workstations interconnected by Ethernet. Software has been developed to allow the
use of any or all of the franebuffers from any machine as though they are all present locally [Hourvitz 84], [Carson 84].
The spatial display system is designed to have the red color shutter output correspond to the even video field and the green shutter output correspond to the odd field. The shutter requires a TL signal to control its color. A simple field detector circuit was built to supply the signal to the color shutter. The circuit must not only detect the vertical retrace interval, but must also differentiate between the even and odd fields. The simplest signals available to derive this signal were horizontal drive (HD) and vertical drive (VD), which are both 5 Volt negative signals active during their corresponding intervals. The circuit uses two monostables to uniquely identify the vertical interval which is preceded by half a scan line rather than a full line.
(a)
VERTICAL VERTICAL
1st FIELD PULSE 2nd FIELD PULSE 1st FIELD
%/2H %/2H H H
(b)
SERRATED
HORIZONTAL EQUALIZER VERTICAL EQUALIZER HORIZONTAL PULSES PULSES PULSE PULSES PULSES
|--VERTICAL BLANKING INTERVAL-+
Figure 3-6: (a) Relationship between HD and VD for 1st and 2nd field, (b) detail of vertical blanking interval [Conrac 801.
The first monostable triggers on VD and has a duration of greater than half a scan line and less than a full line. The second monostable triggers on the occurrence of HD and the first monostable active, with a duration of one field. This only occurs at
the beginning of every other vertical interval. It is important to detect the beginning of the vertical interval rather than the end because the color shutter requires about 2 msec to switch from green to red, which is a little longer than the vertical interval
[Tektronix 84].
The field dependent signal is also used to run the mirror in sync with the video display. A Tektronix FG 504 signal generator is phase locked to the 30 Hz TTL square wave and outputs a synchronous sine wave. The function generator also has a phase adjustment which allows proper alignment of the beginning of the mirror's oscillation with the video field. The output of the function generator is amplified by a low wattage Crown D-75 amplifier and fed to the speaker.
3.2
Software
3.2.1 Image definition
Images are defined in a left-handed floating-point space, ranging from (0, 0, 0) in the near lower left corner to (1.0, 0.75, 0.75) in the rear upper right corner (see Figure 3-7). This region is not cubic, but rather reflects the 4:3 aspect ratio of the monitor surface with the depth equal to the height. A 4x4 transformation matrix may be defined to alter the definition space. The lowest level display routine plots points in device coordinates. Images can be defined by points of specific amounts of red and green in the floating-point space. In addition, routines exist for specifying lines which may be solid or dotted, with or without end points, and of any color.
The duration of a single raster framebuffer pixel is very short, so each pixel is repeated at least once to allow the point plotting beam to pause and more sharply define each point. The number of pixels repeated for each point is variable. More repeating produces a sharper and brighter image, but reduces the total number of points that can be plotted. Dotted lines have this same tradeoff of sharpness and
(1,0.75,0.75)
Y
Z
(0,0,0)
Sx
Figure 3-7: Image definition space.
brightness for spatial resolution, so the degree of dottedness is adjustable. The continuity of a line can easily be seen without plotting every point along the line. In this vector style display it is necessary to be able to specify lines without endpoints because a single vertex connected to many lines would otherwise be drawn with each line, becoming much too bright. This problem does not exist in a raster display because the output scan passes every point only once, and only a single memory location can be related to that point.
3.2.2 Image rendering
The software corrects for the anomalous perspective of the display in two steps. The X and Y values of the input points are scaled according to depth to correct for the lateral magnification increase with depth caused by the mirror. The problem of equally spacing planes of depth has two components. Depth is a nonlinear function of the mirror displacement and the mirror displacement is a sinusoidal function of time'. The software divides the framebuffer memory into 64 parallel slabs of equal depth2. The number of points within each slab is chosen so
1See the appendix for a detailed analysis of the mirror optics.
Figure 3-8: Stereo views of text with the mirror off and on.
that each slab is of equal thickness. All the points within a slab are treated as though
they are at the same depth, even though the continuous motion of the mirror places
every point at a unique depth. The number of slabs is chosen so that the resolution
of depth perception is lower than the slab spacing.
Points defining the image in floating-point space are transformed by a 4x4
matrix into device space. The X and Y positions are then scaled by values stored in
a lookup table indexed by Z. The next step is to write the X, Y, and intensity data
into the framebuffer at the proper location for
Z.
Pointers are maintained to the next
available memory location in each slab. Unfortunately it is very easy to completely
fill one slab. In that case neighboring slabs are checked for space, and in the worst
case the point is discarded. When slab overflow is a problem, the pixel repeat
parameter can be adjusted and solid lines can be changed to dotted lines.
Figure 3-9: Red, green, and blue framebuffer contents for Figure 3-1.
Lines are drawn by first transforming the endpoints to device coordinates, and
then performing a three dimensional DDA interpolation to determine what points to
draw. The points are then drawn as described above, but without any additional
coordinate transformations.
Figure 3-10: Example of a 2D line generated by a DDA algorithm [Newman 79].
The color of a point is specified by two 8-bit values corresponding to red and
green. The color shutter is switched at the video field rate, with the even
framebuffer lines corresponding to red and the odd lines corresponding to green.
The even video field corresponds to the motion of the mirror from the near extreme
to the far extreme, while the odd 'field corresponds to the motion from far to near. A
symmetric set of slabs are defined for each field as illustrated. If a point contains a
non-zero amount of red, it must be placed in the even field slab of the correct depth.
If it contains a non-zero amount of green, it must be placed in the odd field slab of
Even Field Odd Field (Red) (Green) Line 0 1 2 4 3 '4~* Line 471 47 6*" 65 ' 473 *-- 5 S~~6 7* 475 *-44 3 477 - 20 479 1
Figure 3-11: Slab positions in framebuffer.
displayed first in red by the even field during the back stroke of the mirror, and then in green by the odd field during the forward stroke of the mirror such that the two points spatially overlap. The refresh rate is fast enough that spatially overlapping red and green points are perceived as the linear combination of the two color intensities, according to Grassman's second law (see Figure 3-12) [Sproson 83]. A point containing both red and green is not necessarily stored in symmetric red field and green field framebuffer positions, because points of pure red or pure green are not required to have corresponding zero intensity entries in the other field.
3.2.3 Realtime interaction via lookup table manipulation
It takes 5 to 20 minutes to render an image on this system. Efforts have not been taken to optimize the code, but it is unlikely that the process could become fast enough to be considered interactive. The extensive floating-point arithmetic involved is the major bottleneck given the hardware used. Manipulation of the framebuffer color matrix lookup table is very fast though, and several types of realtime interaction can be achieved with this approach.
It is possible to select and display an image in realtime from among a group of pre-rendered images. With this technique all the possible images are always in the
0.5 VI 0.3-u' v' fL R 0.469 0.528 37.9 G 0.120 0.56 73.3 0.1 0.1 0.3 0.5 U,
Figure 3-12: The color shutter gamut extends from red to green [Vatne 83]. display, and all but one are displayed with zero intensity. This approach involves a tradeoff between temporal resolution and spatial resolution; the more images to be selected from, the fewer points available for each of those images since the total number of points in the display is fixed. Another tradeoff with this approach is between the number of images selected from and the number of intensity levels that the images can use. Many types of images can be displayed with a single intensity level. Unlike raster graphics in which only 8 arbitrary single bit images may be selected from, the point plotting display system allows up to 256 different images to be selected from. This many images are possible because no two points can spatially overlap in the framebuffer; points that spatially overlap in the display are distinct in the framebuffer. Raster graphics cannot support more than 8 simultaneous images because points that spatially overlap in the display must also overlap in the framebuffer and cannot be distinguished without reserving a bit plane for each image.
The ability to select between images in the spatial display is actually more analogous to selecting between images on a raster display by using hardware zoom
Figure 3-13: Head with pre-rendered lip positions selectable in realtime.
Stereo views with (a) lips closed, (b) lips open.
and pan features to make a fraction of the image memory fill the screen. Increasing
the number of images to select between requires reducing the amount of image
memory available for each, and thus increases the amount of zoom required to fill
the screen with an image. More zoom implies lower spatial resolution for each
image.
Hardware zoom and pan can be used in the spatial display framebuffer to
provide more points per image than possible with just output lookup table
manipulations. Since pixels need to be repeated at least once anyway, a hardware
horizontal zoom factor of two does not reduce the possible spatial resolution.
Vertical zoom cannot be used because it would eliminate the difference between the
two fields which is needed to separately control the green image during the forward
motion of the mirror and the red image during the backward motion.
Selecting between pre-rendered images can be an interactive process, or it can
be used to present a short repeated loop of animation.
It is possible to select a restricted horizontal and/or vertical region for display
by simply adjusting the output lookup table of the X and/or Y data. All the points
outside of the region of interest are set to draw at position zero. This realtime
windowing operation provides profile views and permits seeing obscured parts of
the image.
Figure
3-14:
Head with realtime X windowing to select cross sections.
Stereo views with (a) mirror off, (b) mirror on.
Another interesting use of the intensity framebuffer and lookup table is to
provide realtime shading of the image as though a light source were moved about
within the scene (see Figure 3-15). To achieve this effect, the intensity slots are
assigned based on the surface normal of the point being diawn, rather than the
intensity value of the point [Sloan 79]. With an 8-bit intensity framebuffer the
surface normals must be quantized to 255 different directions. To view a scene
rendered this way requires calculating an output lookup table based on the desired
position of illumination. Lambert's cosine law is applied to determine intensity
values for each surface normal. Once the data is calculated, the shading can be
altered in realtime.
.. .... ... ... *
. ...
.. .: ... ..
![Figure 1-6: Wheatstone and Brewster stereoscopes [Lane 82].](https://thumb-eu.123doks.com/thumbv2/123doknet/14372903.504631/13.918.138.743.201.442/figure-wheatstone-brewster-stereoscopes-lane.webp)
![Figure 1-12: PLZT shutter assembly [Fisher 81].](https://thumb-eu.123doks.com/thumbv2/123doknet/14372903.504631/17.918.216.655.88.379/figure-plzt-shutter-assembly-fisher.webp)
![Figure 1-15: Arrangement for recording and viewing a hologram [Okoshi 76].](https://thumb-eu.123doks.com/thumbv2/123doknet/14372903.504631/19.918.228.616.408.701/figure-arrangement-for-recording-and-viewing-hologram-okoshi.webp)
![Figure 1-16: Parallax panoramagram [Lane 82].](https://thumb-eu.123doks.com/thumbv2/123doknet/14372903.504631/20.918.219.675.322.659/figure-parallax-panoramagram-lane.webp)
![Figure 1-19: Withey's display (a) simplified, (b) detailed [Rawson 69], [Withey 58].](https://thumb-eu.123doks.com/thumbv2/123doknet/14372903.504631/22.918.147.741.544.877/figure-withey-s-display-simplified-detailed-rawson-withey.webp)
![Figure 1-20: ITT rotating mirror spatial display [Rawson 69].](https://thumb-eu.123doks.com/thumbv2/123doknet/14372903.504631/23.918.214.732.237.576/figure-itt-rotating-mirror-spatial-display-rawson.webp)
![Figure 1-21: Rotating LED array mechanism [Jansson 80].](https://thumb-eu.123doks.com/thumbv2/123doknet/14372903.504631/24.918.190.733.107.542/figure-rotating-led-array-mechanism-jansson.webp)
![Figure 2-3: Increasing lateral magnification with depth [Rawson 69].](https://thumb-eu.123doks.com/thumbv2/123doknet/14372903.504631/27.918.213.661.557.798/figure-increasing-lateral-magnification-depth-rawson.webp)
![Figure 2-4: Scaled CRT image corrects lateral magnification [Rawson 69].](https://thumb-eu.123doks.com/thumbv2/123doknet/14372903.504631/28.918.180.677.100.393/figure-scaled-crt-image-corrects-lateral-magnification-rawson.webp)
