HAL Id: lirmm-03168302
https://hal-lirmm.ccsd.cnrs.fr/lirmm-03168302
Submitted on 12 Mar 2021HAL is a multi-disciplinary open access
archive for the deposit and dissemination of sci-entific research documents, whether they are pub-lished or not. The documents may come from teaching and research institutions in France or abroad, or from public or private research centers.
L’archive ouverte pluridisciplinaire HAL, est destinée au dépôt et à la diffusion de documents scientifiques de niveau recherche, publiés ou non, émanant des établissements d’enseignement et de recherche français ou étrangers, des laboratoires publics ou privés.
design and implementation choice
Rabab Bouziane, Erven Rohou
To cite this version:
Rabab Bouziane, Erven Rohou. Deliverable D2.1 - Report on selected relevant metrics: design and im-plementation choice. [Research Report] Inria Rennes – Bretagne Atlantique. 2016. �lirmm-03168302�
D2.1 – Report on selected relevant metrics: design and
implementation choice
Version 2.0 (2016) Final Public Distribution Main contributors:R. Bouziane and E. Rohou (Inria)
Project Partner Contact Information
Cortus S.A.S Inria
Michael Chapman Erven Rohou
97 Rue de Freyr Inria Rennes - Bretagne Atlantique
Le Génésis Campus de Beaulieu
34000 Montpellier 35042 Rennes Cedex
France France
Tel: +33 430 967 000 Tel: +33 299 847 493
E-mail: michael.chapman@cortus.com E-mail: erven.rohou@inria.fr LIRMM Abdoulaye Gamatié Rue Ada 161 34392 Montpellier France Tel: +33 4 674 19828 E-mail: abdoulaye.gamatie@lirmm.fr
Table of Contents
1 Summary 1
2 Introduction 2
3 Performance metrics 4
3.1 CPU time . . . 4
3.2 Miss rate/ hits rate / misses per instruction . . . 4
3.3 Number of cycles per instruction . . . 5
3.4 Branch misprediction rate . . . 5
3.5 Average Memory Access Time . . . 6
3.6 Access Per Cycle . . . 7
4 Energy metrics 7 4.1 Power . . . 7
4.2 Energy . . . 8
4.3 Energy Delay Product . . . 9
4.4 Resynchronization time . . . 9
4.5 Activity level for a program region . . . 10
5 Non volatile memories 10
6 Conclusions and future work 12
1
Summary
The present deliverable surveys a number of metrics found in literature, which are considered as relevant for assessing performance and energy consumption during our studies conducted within the CONTINUUM project. These metrics are summarized in the following table:
Metric Description
CPU time CPU execution time (cycles, seconds) Miss rate Number of misses per total cache access
Hit rate Number of hits per total cache access Misses per instruction Number of misses per instruction
Number of cycles per instruction Time required for an instruction to be executed (cycles, sec-onds)
Miss penalty Number of cycles consumed while a cache miss occurs (cy-cles, seconds)
Branch miss prediction rate Frequency of untaken branches
Average memory access time Average latency to access a data (cycles, seconds)
Access per cycle Num. of memory accesses per cycle at certain level, e.g. L1
Energy Total energy consumption (Joules)
Power Energy per unit of time (Watts, Joules/second) Energy Delay Product Figure of merit correlated with the energy efficiency Activity level at a given time Number of instructions executed at a given point in time
Resynchronization time Time required for a resource to get back from sleep state to active state (cycles, seconds)
Read/Write ratio Read/Write ratio in a memory
2
Introduction
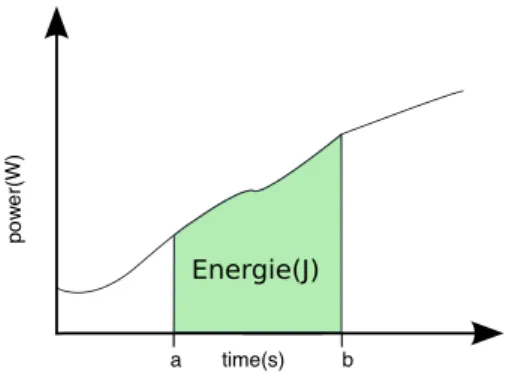
Today, high-performance computation has become appealing for scientific/intensive applications that are running on high performance microprocessors. The number of cores and processors frequency have been increasing through the last years. Frequency and energy consumption are two proportional terms related by the supplied voltage of a processor, i.e., the energy consumption in CMOS circuit has a direct relationship with working frequency f and the square of the supplied voltage V , as defined in the following relation: P = CV2f , where P is the power and C is capacitance. P is expressed in Watts. Hence, increasing the frequency leads to increase the power consumption of the processor. Let us recall that power is the rate at which energy is consumed or produced. In the context of calculus, power is the derivative of energy, while the latter is the integral of power (see Figure 1).
Figure 1: Energy as the integration of power over time: Energy =RabP (t)dt
Energy consumption and power dissipation became an important design constraint in today’s high-performance microprocessors. The gap existing between processor high-performance and memory per-formance makes memory-access an influencing perper-formance factor in high-end computing. Several researchers [2, 15] have identified the memory components as the energy bottleneck of an entire system. For that reason, different memory hierarchies have been proposed to reduce the energy con-sumption of memory’s subsystems and the most famous ones are SRAM caches and scratchpad memories.
Nevertheless, SRAM caches suffer from high leakage power, which dominates the total energy consumption in the on-chip memory system. To mitigate this problem, new non-volatile memory technologies such as phase-change RAM (PRAM) and spin-torque transfer magnetoresistive RAM (STT-RAM) have seen the light of day. They are prominent technologies that are used as alternative on-chip memories with the advantages of low leakage and high density. Yet, non-volatile memories are also suffering from their limited endurance, higher write latency and energy.
On the other hand, compilers, traditionally, are not directly exposed to energy aspects. However, with all the weight given to energy consumption, it is worthy to investigate how the compiler optimizations could have tremendous impacts on the overall energy consumption. As the main factor for activity on processor and memory systems, software has a signification effect on the energy consumption of the entire system. Still, developing new power-aware compiler optimizations and combining them with performance-oriented compiler optimizations is the focus of several researches.
Furthermore, in order to optimize compilers for a specific objective, performance models and metrics are the primary keys that help to make efficient transformations to the program code. Indeed, these keys indicate to the compiler which transformations should be selected to achieve the goal whether in terms of performance or energy or even both. The common metrics used in literature are time and energy per access in memory hierarchy. Although these two metrics often behave similarly, moving down in memory levels makes both time and energy increase, which let us conclude that a memory architecture that has a good performance has also a good energy consumption. In spite of that, this conclusion may lead us to incorrect interpretation for the following reasons:
• time and energy do not increase in the same way,
• the performance is a worst-case quantity but the power is an average-case quantity [3] which means that improving performance for some critical computations may surprisingly be the cause of an increase in energy consumption. The notion of critical path has been used in many performance models. A critical path is a sequence of instructions or activities that will influence over the whole program execution time. In the context a performance, if an optimization is performed based on the non-critical path, performance is not affected and the optimization could be beneficial. However, in the context of power/energy, this is unreliable. Any activity, whether on or off the critical path will play a part in the overall power dissipation and energy usage [11].
As software execution corresponds to performing operations on hardware, as well as accessing and storing data. It requires power dissipation for computation, storage and communication. Beside the fact that the energy consumed during execution is very important, reducing the code size and thus, the storage cost of a program, is the classical goal of compilers. The energy cost of executing a program relies on the machine code and the target machine. Therefore, for a target architecture, energy cost is bound to machine code and consequently to compilation. Hence, it is the compilation process itself that strikes energy consumption. Traditional optimizations such as common sub-expression elimination, partial redundancy elimination, silent stores elimination or dead code elimination increase the performance of a program by reducing the work to be done during program execution [14, 1]. Clearly, reducing the workload may also result in power/energy savings. Memory hierarchy optimizations play with latency and data placement. Optimizations such as loop tiling and register allocation try to keep data closer to the processor in order be accessed more faster. Memory optimizations may also contribute to reduce energy consumption. Loop tiling tries to keep a value in an on-chip cache instead of an off-chip memory and register allocation optimization try to allocate data in a register instead of the cache. Both techniques allow to save power/energy due to reduced switching activities and switching capacitance [11].
A good compiler is a compiler based on efficient metrics. So definitely, bad metrics will directly affect performance as well as energy. At this stage of work, we focus on metrics that we intend to use in our future work. There is a fundamental difference in the models and metrics used for performance (CPU and memory) and those for power/energy optimizations. While memory is the bottleneck for performance, how to measure and evaluate memory systems has become an important issue facing the high performance computing community. In the following sections, we will detail the metrics that are the most commonly used in literature.
3
Performance metrics
3.1
CPU time
CPU execution time is the time required to complete the execution of a program. It is measured in clock cycles/seconds and it is expressed as follows:
CP U time = I ∗ CP I ∗ T
where I is the number of instructions in program, CP I is the average cycles per instruction and T is the clock cycle time. Furthermore, CP I can be detailed as:
CP I = CP Iexecution + CP Imemstall where
CP Imemstall = M em accesses per instruction ∗ M iss rate ∗ M iss penalty. Therefore, CP U time becomes:
CP U time = I ∗ (CP Iexecution + CP Imemstall) ∗ T.
3.2
Miss rate/ hits rate / misses per instruction
Miss-rate (MR), hit-rate (HR) and misses per instruction are often used to measure the performance of a certain cache configuration. The miss-rate is the number of misses per total cache access and the hit-rate is the number of cache hits per total accesses. They are computed as follows:
HR = no. of hits
total no. of accesses
M R = no. of misses total no. of accesses
Given the above definitions, the number of misses per instruction (MPI) is therefore equal to: M P I = M emory accesses per instruction ∗ M R
Besides the miss rate, hits rate and the number, the cache size is an important factor as well. It involves area and miss rate. Large cache size means higher hit rate and lower miss rates in instructions cache as well as data cache. If the cache line size is increased, then the miss rate is reduced. If the number of cache lines is increased, then the miss rate can be reduced if the block size or the degree of set associativity is also increased. Here, we differentiate direct-mapped caches and set-associative caches.
A direct-mapped cache with a large block size performs better than a set associative cache of the same size. Increasing block size improves the instruction cache hit rates.The effect on the hit rate of a data cache while increasing the block size is not as apparent as in the instruction cache. In the other hand, a set associative cache with a large degree of set associativity does better than a direct-mapped cache of the same size. Increasing the degree of set associativity improves the data cache hit rates. The effect on the hit rates of an instruction cache while increasing the degree of associativity is in contrary not as apparent as in the data cache [22].
We should note that even if large cache size means higher hit rate, larger size caches are more expensive and slightly slower than smaller caches due to the larger number of control gates.
3.3
Number of cycles per instruction
A single machine instruction may take one or more CPU cycles to terminate. The average CPI of a program is the average CPI of all instructions executed on a given CPU design. It is expressed by:
CP I = CP U clock cycles inctructions count
Several code optimizations focus on reducing the number of cycles needed to run an application, but they might not decrease consumed energy as well, as they can create very complex transformations that may increase the energy used by the processor for computation. Another form of this metric is its inverse: Number of Instructions Per Cycle IPC. It has been widely used as a major performance evaluation metric in the computer architecture community. It reflects the overall performance in terms of the number of executed instructions per cycle:
IP C = 1
CP I
When a profiler tells you that the average CPI is equal to 2,that means that IPC is equal to 12 = 0.5. This level of performance would be rather bad for modern superscalar CPUs that can reach 4 Instructions Per Cycle (Intel). Therefore, the ideal CPI for modern processors is 14 = 0.25
Moreover, the impact of a miss on CPI is the cost of a cache miss in terms of time. In the literature, it is known as the miss penalty. For example, the miss penalty on the cache L1 correspond to the required time to access data in the lower level of cache L2. It is equal to:
M iss P enaltyL1 = Hit LatencyL2 ∗ Hit RateL2 + M iss RateL2 ∗ M iss P enaltyL2
3.4
Branch misprediction rate
Branch prediction is a fundamental component of modern pipelined architectures. It resolves a branch hazard by predicting which path will be taken to avoid stalling. The cost of stalling is directly related to CPI. Branch misprediction rate is a system performance metric because it relies on predictor accuracy. If a misprediction occurs, the entire pipeline needs to be flushed. There are dynamic and static methods for branch prediction. Dynamic branch prediction depends on program behaviour. It uses information
about taken or not taken branches collected at run-time to predict the outcome of a branch. It is implemented in hardware. The most common algorithm is based on branch history. On the other hand, static prediction is the simplest branch prediction technique because it does not require information about the dynamic history of a program execution. It predicts the outcome of a branch based uniquely on the branch instruction. The simplest predictors predict which branch is always taken or to which one is always not taken. Another way is to use a profiler and some training input data to predict the branch direction that was most frequently taken.
3.5
Average Memory Access Time
The Average Memory Access Time (AMAT) is a metric that allow to analyze memory system performance. AMAT is the conventional metric to measure and analyze the influence of locality on data access latency [8]. It can be used recursively to measure the impact of locality throughout all layers of the memory hierarchy and is widely used in memory system design and optimization. AMAT depends on three terms: hit latency, miss rate, and miss penalty. It is calculated by taking the product of miss rate and miss penalty and adding it to the hit latency:
AM AT = Hit LatencyL1 ∗ Hit RateL1 + M iss RateL1 ∗ M iss P enaltyL1. Then, the M iss P enaltyL1 can be replaced by its formula:
AM AT = Hit LatencyL1 ∗ Hit RateL1+
M iss RateL1 ∗ (Hit LatencyL2 ∗ Hit RateL2 + M iss RateL2 ∗ M iss P enaltyL2) On the other hand, AMAT is in accordance with data access whether it is a hit or a miss, which means that the memory only supports sequential accesses and do not support multiple simultaneous accesses. For this reason, AMAT has been extended to take into consideration the modern memory systems. The new metric is called Concurrent-AMAT (C-AMAT). It combines the influence of data locality and concurrency. C-AMAT can be applied recursively to each layer of the memory hierarchy and reduces to AMAT when there is no data concurrency. C-AMAT uses two new parameters, hit concurrency and miss concurrency. It also introduces the notion of a pure miss, which is a miss that contains at least one pure miss cycle. A pure miss cycle is a miss cycle that does not overlap with a hit cycle. Using pure misses, C-AMAT adapts the definition of miss rate and average miss penalty of AMAT to pure miss rate and pure average miss penalty, as follows:
M iss rate = total no. of pure misses total no. of accesses The average miss penalty, considering only pure miss accesses is:
AM P = sum of total pure miss cycles total no. of pure misses
which is used in turn to define C-AMAT as expressed below: C − AM AT = Hit T ime
Ch
∗ Hit Rate + M iss Rate ∗AM P Cm
where Ch represents hit concurrency and Cm represents miss concurrency.
C-AMAT is based on the following assumptions [23]:
1. reducing the number of pure misses is more relevant to the context of performance’s improve-ment,
2. as data locality doesn’t always improve performance, optimizations ought to balance between data locality improvement and concurrency.
3.6
Access Per Cycle
Based on the concept of IPC, which is a widely used system-performance metric, designed to measure CPU performance but does not reflect memory performance, Access Per Cycle is proposed to evaluate memory performance. It can be applied at each level of memory hierarchy, i.e, L1, L2,... It is calculated as the quotient of the overall memory accesses requested at a certain memory level (load/store) by the total cycles required by these accesses at that level. Let M denote the total data access (load/store) at a certain memory level, and T denote the total cycles consumed by these accesses. According to the definition, AP C is expressed by:
AP C = M T
A special characteristic of APC is that it separates memory evaluation from CPU evaluation and therefore allows to evaluate better data-intensive applications. System performance should correlate with memory performance, and if a memory performance metric does not correlate with system performance then this metric is probably missing important characteristics of memory system. Thus, correlation between IPC and APC is used to verify the correctness of APC. Wang et al. [25, 24] showed that among other memory metrics (Hit Rate, Hits Per 1K Instruction, Average Miss Penalty and Average Memory Access Time), APC has the highest correlation with IPC.
4
Energy metrics
4.1
Power
A processor works at a given power expressed as Watt (W). There are several factors contributing to the CPU power consumption. The two major types of power dissipations occurring in a CMOS circuit are: dynamic power consumption and static dissipation. The former one is due to the charging and discharging of capacitance or due to the switching activities of the circuit and the latter is due to transistor leakage currents. The power consumption of a circuit CMOS is represented by: P = CV2f where C is the effective load capacitance, v the supply voltage and f the clock frequency. According to
this relation, we can see that the power consumption of the processor depends linearly on the effective capacitance, supply voltage and clock frequency. Thus, by changing the voltage and frequency, the power dissipation of the processor can be managed. For this reason, different techniques that aim to minimize the power consumption such as Dynamic Voltage/Frequency Scaling and Dynamic Power Management, try to adjust the voltage/frequency in order to conserve power or to reduce it.
4.2
Energy
As explicit as it is, the energy metric represents the energy consumption of a system. Different formulas have been proposed to estimate the energy consumed by a system using other performance metrics. Most of today’s processors include dedicated hardware performance counters for debugging and measurement. These counters allow to create power models and measure the energy more precisely. Isci et al. in [10] proposed a runtime power modelling methodology based on using hardware performance counters to estimate component power breakdowns for the Intel Pentium 4 processor. In asymmetric multi-core architectures in which we are interested, it integrates cores with different power and performance characteristics, which makes mapping workloads to appropriate cores a challenging task.
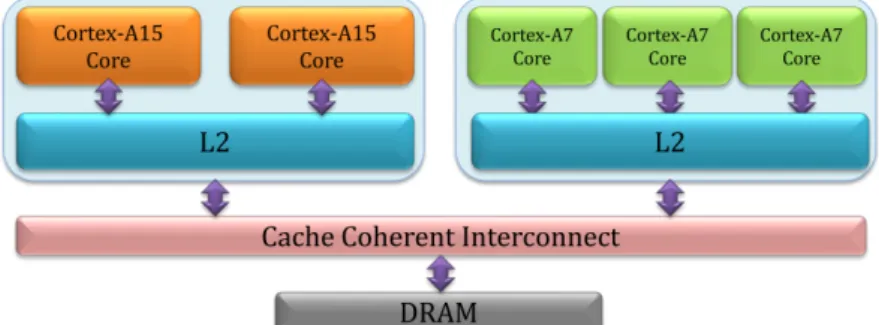
Figure 2: Big.LITTLE architecture
Pricopi et al. [17] develop power-performance model for commercial asymmetric multi-core: ARM big.LITTLE (see Figure 2). Power and performance are modelled differently. While performance modelling is a combination of mechanistic and empirical modelling, power modelling is based on regression analysis. The aim is to predict, at runtime, the power, performance behaviour of an application on a target core (big or little), given its execution profile on the current core, where the cores share the same ISA but has heterogenous micro-architecture. A simple linear regression model is used to estimate the power consumption in terms of available performance counters. However, the performance counters available on one core are not the same available on the other core. For example, the big core provides the L2 cache write access counter but the small core does not provide it. Moreover, on asymmetric cores, the memory hierarchy and the branch predictors may not be identical across different core types, as it is the case in ARM big.LITTLE.
In big.LITTLE platform, the small cores are superscalar in-order, power efficient Cortex-A7 processors. Thus, there is no need to model power for the small cores. In contrary, the big cores (out-of-order A15) are very energy-demanding. That’s why it is essential to model application-specific power
consumption on A15. The power consumption of A15 depends on the pipeline behaviour and the memory behaviour of the application. The power consumption in the memory hierarchy is determined by the number of L1 Inst, L1 Data, L2, and memory access. The small cores are connected to a simpler cache system in order to increase the power efficiency, while the big cores are connected to a more complex memory that supports higher memory throughput, which increases the overall performance. The main challenge to tackle in estimating the power consumption of an application on the big core while running it on the small core is that we have to predict the access profile. In order to predict the CPI value of core P2 while running on core P1, the values of the following performance counters need to be predicted: number of first level data and instruction cache miss (missL1D, missL1Inst), number of last level cache miss (missL2) and the number of branch mispredictions (missbr). Pricopi et al. proposed a combination of compile-time analysis, mechanistic modelling, and linear/non-linear regressions to create an accurate model that estimates the cache miss and branch misprediction rates on the target core, solely from the information available on the current core.
Therefore, energy can be computed relying on power models and estimation of factors such as missL1D, missL1Ins, missL2 and missbr or relying on hardware counters. The unity of measurement is Joules(J). In this work, as a concrete measurement of energy consumption, we will use the simulator developed by LIRMM that gives the overall consumed energy [6]. It consists of a combination of three simulators: gem5, NVSim and McPAT, that are all performance-based frameworks.
4.3
Energy Delay Product
The energy delay product concept is based on the trade off existing between performance and energy consumption. It is a metric that considers both time and energy. It is defined as: EDP = E ∗ t [12]. The graph illustrated in Figure 3 represents the energy curve and the delay curve. We observe that as VDD is scaled down, the delay decrease and the energy consumed increased. However, the
EDP curve reaches a minimum before the energy curve. Therefore, EDP is minimized between the minimum energy and the minimum delay. Hence, choosing the optimal VDDedp for EDP depends on the weight given to energy and delay. If the weight of energy is bigger than the weight of performance, VDDEnergy will tend to be decreased aggressively, which means that one can trade increased delay for lower energy. In the contrary, if performance has the bigger weight, then the emphasis will be on the delay and VDDDelay will be greater than VDDEnergy. The overall can be summarized as: VDDEnergy < VDDedp < VDDDelay.
4.4
Resynchronization time
The modern processors support different operating modes (power modes/energy modes), each con-suming a different amount of energy. Memories and other peripherals are also equipped with this feature (e.g., the RDRAM technology provides up to six power modes) [5]. The power reduction is determined by which regions of the chip are turned off and how they are turned off. This is directly re-lated to the latency (resynchronization time), which is determined by how long these regions need to transition back to the active state once the idle period is over. For this reason, the low power modes must be enabled and disabled at the right time, to avoid the cost of resynchronization, which is defined as the number of cycles required to get back to active state
Figure 3: Energy Delay Product
4.5
Activity level for a program region
Another possible metric for energy is the activity size at a given point during program execution and total amount of activities for a program region [11]. For an optimizing compiler, the activity size could be the number of executed instructions at a given point. Assuming that each instruction is associated with a certain amount of power, scheduling instructions and reordering them may have an impact on the power consumption at a certain time. This could be useful in case of partitioning code for an heterogeneous architecture and region-based compilation where the compiler is allowed to partition the program into new set of compilation units called regions.
5
Non volatile memories
Emerging non-volatile RAMs (NVRAMs), and generally non-volatile memories (NVM), have zero standby power, high density and non-volatility, which are useful features [13, 26]. However, they also have the following limitations:
• relatively long and asymmetric access latencies, compared to conventional DRAM, • high dynamic power consumption for write operations,
• limited write endurance.
Based on these characteristics, there are three categories of NVRAMs:
• NVRAMs with long access latencies for both read and write operations (e.g., PCRAM and Flash memory),
• NVRAMs with long write latencies and read access latencies comparable to DRAM (e.g., STT-RAM),
In the CONTINUUM project, we focus more on the second category because it represents prominent opportunities. STT-RAM have been recently considered for cache-level integration. The RRAM technology is not mature enough for consideration in our forthcoming studies, which will largely focus on the cache memory hierarchy. There are already some existing design exploration frameworks [18, 20, 19] that could support these studies. We will partly rely on them by adopting tools like gem5 [4] and NVSim [7] for simulation and evaluation.
Different approaches have been proposed to mitigate the limitations of NVMs. The most common idea is to manage thoroughly the writes operations with the objective of reducing the number of writes activities on NVRAMs. Whence, hybrid memory systems were rigorously been studied and several approaches were proposed, based on data placement and data migration from NVRAM to the other type of memory. To stay in the context of metrics, hybrid memories will be discussed in futur works with more details. According to the characteristics of NVRAMs, the number of writes and Read/write ratio are used in order to benefit from them and quantify their opportunities.
The read/write ratio is inversely proportional to the number of writes. Thus, a higher read/write ratio signifies less intensive write program/benchmark. Several existing studies have proposed approaches to mitigate the cost of write operations. Basically, the common idea is to minimise the number of write operations on NVRAM. Zhou et al. [27] proposed early write termination (EWT) to reduce high write energy for MRAM. The EWT technique was proposed to detect and terminate redundant write operations to remove unnecessary write operations.
Hu et al. [9] proposed two optimization techniques: write-aware scheduling and recomputation. These two techniques aim to minimize write activities on NVRAM while speeding up the completion time of programs and extending NVRAM’s lifetime.
Smullen et al. [21] presented an approach for redesigning NVRAM (e.g., STT-RAM) cells to reduce the high dynamic energy and slow write latencies. They used the retention time which is the time that indicates how long the data can be kept in a NVRAM cell after it had been stored. Reducing the retention time leads to lower write current, hence, to less consuming write operations. Other important approaches are also presented in the context of hybrid memories, typically, using SRAM and NVRAMS and migrating as much as possible write operations to SRAM.
6
Conclusions and future work
This deliverable presented some relevant metrics accordingly to literature. Measuring power and energy is not an obvious task. Different factors contribute in the energy consumption of an entire computing system. Choosing the right factors is the first step towards an efficient energy measurement. The next step consist in specifying and designing energy-aware optimizations using NVMs as shown in our very recent work [16]. We want to investigate new compilation techniques that allow us to exploit the advantages of emerging non-volatile memory technologies.
References
[1] Aho, A. V., Sethi, R., and Ullman, J. D. Compilers: Principles, Techniques, and Tools. Addison-Wesley Longman Publishing Co., Inc., Boston, MA, USA, 1986. ISBN 0-201-10088-6.
[2] Bellas, N., Hajj, I. N., Stamoulis, G. D., and Polychronopoulos, C. D. Architectural and compiler support for energy reduction in the memory hierarchy of high performance microprocessors. In Proceedings of the 1998 International Symposium on Low Power Electronics and Design, 1998, Monterey, California, USA, August 10-12, 1998, pages 70–75, 1998.
[3] Benini, L. and Micheli, G. d. System-level power optimization: Techniques and tools. ACM Trans. Des. Autom. Electron. Syst., 5(2):115–192, April 2000. ISSN 1084-4309. doi: 10.1145/ 335043.335044. URL http://doi.acm.org/10.1145/335043.335044.
[4] Binkert, N., Beckmann, B., Black, G., Reinhardt, S. K., Saidi, A., Basu, A., Hestness, J., Hower, D. R., Krishna, T., Sardashti, S., Sen, R., Sewell, K., Shoaib, M., Vaish, N., Hill, M. D., and Wood, D. A. The gem5 simulator. SIGARCH Comput. Archit. News, 39(2):1–7, August 2011. ISSN 0163-5964. doi: 10.1145/2024716.2024718. URL https://doi.org/10.1145/ 2024716.2024718.
[5] Delaluz, V., Kandemir, M., Vijaykrishnan, N., Sivasubramaniam, A., and Irwin, M. J. Hardware and software techniques for controlling dram power modes. IEEE Trans. Comput., 50(11):1154– 1173, November 2001. ISSN 0018-9340. doi: 10.1109/12.966492. URL http://dx.doi.
org/10.1109/12.966492.
[6] Delobelle, T., Péneau, P.-Y., Senni, S., Bruguier, F., Gamatié, A., Sassatelli, G., and Torres, L. Flot automatique d’évaluation pour l’exploration d’architectures à base de mémoires non volatiles. In Conférence d’informatique en Parallélisme, Architecture et Système, Compas’16, Lorient, France, 2016.
[7] Dong, X., Xu, C., Xie, Y., and Jouppi, N. P. Nvsim: A circuit-level performance, energy, and area model for emerging nonvolatile memory. IEEE Transactions on Computer-Aided Design of Integrated Circuits and Systems, 31(7):994–1007, 2012. doi: 10.1109/TCAD.2012.2185930. [8] Dubois, M., Annavaram, M., and Stenstrm, P. Parallel Computer Organization and Design.
Cambridge University Press, New York, NY, USA, 2012. ISBN 0521886759, 9780521886758. [9] Hu, J., Xue, C. J., Tseng, W.-C., He, Y., Qiu, M., and Sha, E. H.-M. Reducing write activities on non-volatile memories in embedded cmps via data migration and recomputation. In Proceedings of the 47th Design Automation Conference, DAC ’10, pages 350–355, New York, NY, USA, 2010. ACM. ISBN 978-1-4503-0002-5. doi: 10.1145/1837274.1837363. URL http://doi. acm.org/10.1145/1837274.1837363.
[10] Isci, C. and Martonosi, M. Runtime power monitoring in high-end processors: Methodology and empirical data. In Proceedings of the 36th Annual IEEE/ACM International Symposium on Microarchitecture, MICRO 36, pages 93–, Washington, DC, USA, 2003. IEEE Computer Soci-ety. ISBN 0-7695-2043-X. URL http://dl.acm.org/citation.cfm?id=956417. 956567.
[11] Kremer, U. Low power/energy compiler optimizations, 2004.
[12] Markovi´c, D. and Brodersen, R. . . DSP Architecture Design Essentials. Springer US, 2012. URL https://books.google.fr/books?id=FIpPpaNhwIUC.
[13] Mittal, S., Vetter, J. S., and Li, D. A survey of architectural approaches for managing embedded dram and non-volatile on-chip caches. IEEE Transactions on Parallel and Distributed Systems, 26(6):1524–1537, 2015. doi: 10.1109/TPDS.2014.2324563.
[14] Muchnick, S. S. Advanced Compiler Design and Implementation. Morgan Kaufmann Publishers Inc., San Francisco, CA, USA, 1997. ISBN 1-55860-320-4.
[15] Panda, P. R., Nicolau, A., and Dutt, N. Memory Issues in Embedded Systems-on-Chip: Opti-mizations and Exploration. Kluwer Academic Publishers, Norwell, MA, USA, 1998. ISBN 0792383621.
[16] Péneau, P., Bouziane, R., Gamatié, A., Rohou, E., Bruguier, F., Sassatelli, G., Torres, L., and Senni, S. Loop optimization in presence of STT-MRAM caches: A study of performance-energy tradeoffs. In 26th International Workshop on Power and Timing Modeling, Optimization and Simulation, PATMOS 2016, Bremen, Germany, September 21-23, 2016, pages 162–169. IEEE, 2016. doi: 10.1109/PATMOS.2016.7833682. URL https://doi.org/10.1109/ PATMOS.2016.7833682.
[17] Pricopi, M., Muthukaruppan, T. S., Venkataramani, V., Mitra, T., and Vishin, S. Power-performance modeling on asymmetric multi-cores. In Proceedings of the 2013 International Conference on Compilers, Architectures and Synthesis for Embedded Systems, CASES ’13, pages 15:1–15:10, Piscataway, NJ, USA, 2013. IEEE Press. ISBN 978-1-4799-1400-5. URL http://dl.acm.org/citation.cfm?id=2555729.2555744.
[18] Senni, S., Brum, R. M., Torres, L., Sassatelli, G., Gamatié, A., and Mussard, B. Potential applications based on NVM emerging technologies. In Nebel, W. and Atienza, D., editors, Proceedings of the 2015 Design, Automation & Test in Europe Conference & Exhibition, DATE 2015, Grenoble, France, March 9-13, 2015, pages 1012–1017. ACM, 2015. URL http:
//dl.acm.org/citation.cfm?id=2757049.
[19] Senni, S., Torres, L., Sassatelli, G., Gamatié, A., and Mussard, B. Emerging non-volatile memory technologies exploration flow for processor architecture. In 2015 IEEE Computer Society Annual Symposium on VLSI, ISVLSI 2015, Montpellier, France, July 8-10, 2015, page 460. IEEE Computer Society, 2015. doi: 10.1109/ISVLSI.2015.126. URL https://doi. org/10.1109/ISVLSI.2015.126.
[20] Senni, S., Torres, L., Sassatelli, G., Gamatié, A., and Mussard, B. Exploring MRAM technologies for energy efficient systems-on-chip. IEEE J. Emerg. Sel. Topics Circuits Syst., 6(3):279–292, 2016. doi: 10.1109/JETCAS.2016.2547680. URL https://doi.org/10.1109/JETCAS. 2016.2547680.
[21] Smullen, C. W., Mohan, V., Nigam, A., Gurumurthi, S., and Stan, M. R. Relaxing non-volatility for fast and energy-efficient stt-ram caches. In Proceedings of the 2011 IEEE 17th
International Symposium on High Performance Computer Architecture, HPCA ’11, pages 50– 61, Washington, DC, USA, 2011. IEEE Computer Society. ISBN 978-1-4244-9432-3. URL http://dl.acm.org/citation.cfm?id=2014698.2014895.
[22] Su, C.-l. and Despain, A. M. Cache design trade-offs for power and performance optimiza-tion. Proceedings of the 1995 international symposium on Low power design - ISLPED ’95, pages 63–68, 1995. ISSN 0897917448. doi: 10.1145/224081.224093. URL http:
//dl.acm.org/citation.cfm?id=224081.224093$\backslash$nhttp: //portal.acm.org/citation.cfm?doid=224081.224093.
[23] Sun, X.-H. Concurrent average memory access time (c-amat), 2016. URL www.cs.iit.edu/ ~scs/research/c-amat/c-amat.html.
[24] Sun, X.-H. and Wang, D. Apc: A performance metric of memory systems. SIGMETRICS Perform. Eval. Rev., 40(2):125–130, October 2012. ISSN 0163-5999. doi: 10.1145/2381056.2381082. URL http://doi.acm.org/10.1145/2381056.2381082.
[25] Wang, D. and Sun, X.-H. Apc: A novel memory metric and measurement methodology for modern memory systems. IEEE Trans. Comput., 63(7):1626–1639, July 2014. ISSN 0018-9340. doi: 10.1109/TC.2013.38. URL http://dx.doi.org/10.1109/TC.2013.38.
[26] Zhao, J., Xu, C., Chi, P., and Xie, Y. Memory and storage system design with nonvolatile memory technologies. IPSJ Transactions on System LSI Design Methodology, 8:2–11, 2015. doi: 10.2197/ipsjtsldm.8.2.
[27] Zhou, P., Zhao, B., Yang, J., and Zhang, Y. Energy reduction for stt-ram using early write termination. In Proceedings of the 2009 International Conference on Computer-Aided Design, ICCAD ’09, pages 264–268, New York, NY, USA, 2009. ACM. ISBN 978-1-60558-800-1. doi: 10.1145/1687399.1687448. URL http://doi.acm.org/10.1145/1687399. 1687448.