CHARACTERIZATION OF CONSOLIDATION AND CREEP PROPERTIES OF SALT LAKE CITY CLAYS
by Nicky Si Yan Ng
Bachelor of Science in Civil Engineering University of Alberta, Edmonton, Alberta, CANADA
June, 1996
Submitted to the Department of Civil & Environmental Engineering in Partial Fulfillment of
the Requirements of the Degree of
MASTER OF SCIENCE IN CIVIL & ENVIRONMENTAL ENGINEERING at the
Massachusetts Institute of Technology June, 1998
Signature of Author
Department of Civil & Environmental Engineering February 17, 1998
Certified by
Professor Charles C. Ladd
Professor, Department of Civil & Environmental Engineering Thesis Supervisor
Certified by
Dr. John T. Germain,&'
Principal Research Associate, Department of Civil & Environmental Engineering Thesis Co-supervisor
Accepted by
Joseph M. Sussman
Chairman, Departmental Committee on Graduate Studies
JUN 0 21998
LIBRARIES -'r
j
Department of Civil & Environmental Engineering February 17, 1998
CHARACTERIZATION OF CONSOLIDATION AND CREEP PROPERTIES OF SALT LAKE CITY CLAYS
by
Nicky Si Yan Ng
Submitted to the Department of Civil & Environmental Engineering on February 17, 1998 in partial fulfillment of the requirements for the Degree of Master of Science in Civil & Environmental Engineering
ABSTRACT
The reconstruction of the Interstate 1-15 highway embankments in Salt Lake City (SLC) involves the design and construction of bridges and embankments over 20 - 30 m of soft SLC clays. A surcharging scheme to overconsolidate the soft, layered foundation soils is required to reduce post-construction creep settlements. Seven Constant Rate of Strain Consolidation (CRSC), nine special Type B (surcharge) oedometer, two special Type C (reload) oedometer, 16 Ko-Consolidated phase of direct simple shear SHANSEP and six Ko-Consolidated phase of triaxial SHANSEP tests were run on radiographed tube samples to evaluate the consolidation and creep properties of the SLC clays.
Comparison between the end-of-primary (EOP) compression curves from continuous loading and those from incremental loading shows that continuous loading gives higher values of the maximum virgin compression ratio (CRmax), especially for S-shaped compression curves on high water content clays. Continuous loading also provides more reliable estimates of preconsolidation stress (o'p).
Data from 19 oedometer tests show that Ca/CR increases with increasing natural water content and has a mean value of about 0.042.
The thesis presents correlations for predicting the reduction in creep rate of SLC clays as a function of the amount of surcharge (AOS). These correlations show greater benefit from surcharging than reported by Ladd (1989) for other cohesive soils. The thesis also contains correlations for predicting the long-term settlements of SLC foundation clays that are overconsolidated due to aging from prior embankment construction.
Thesis Supervisor : Dr. Charles C. Ladd
Title : Professor of Civil & Environmental Engineering Thesis Co-supervisor : Dr. John T. Germaine
Title : Principal Research Associate of
Acknowledgments
This thesis would not have been done without the help and invaluable insights from several peoples. I would like to take this opportunity to acknowledge:
* Professor Ladd, my faculty advisor and thesis supervisor, for being an excellent mentor and for his patience and interest in my educational and professional development. I also like to thank Professor Ladd for advising on personal life matters and kindly providing supplemental financial support for this research.
* Woodward-Clyde Consultants (WCC) of Salt Lake City, Utah, for making the thesis possible by providing financial support for the research and technical information from tests performed by the New Jersey laboratory of WCC.
* Dr. Germaine for advising on all experimental issues, especially modification of the oedometer equipment for more precise measurements of strains.
* MIT graduate students Amy Varney and Erin Force, and MIT doctorate student Guoping Zhang for helping to complete the laboratory testing program.
* My long-time friends who have been keeping in touch: Heng, Haw, Wylie and Sal from Canada; Anthony and Sarah from Hong Kong; and Sam from Ohio.
* My funny friends at MIT: Brian, Michael, Prakash, Mike, Kit, Ahman, Anjing Kurap, Sam, Ad Cool, lbt and the lepak geng.
* Jessie for being a supportive friend and room-mate.
* Ikan for being good company and bringing peace and comfort to my mind.
* My love, Leanne, for her love, understanding, patience and support at all times. Thank you for believing in me. You will always be in my heart and I dedicate this thesis to you.
* Lastly, but not least, my family (dad, mom and Timmy) for believing in me and providing plenty of support and sound advice. You have always been in my heart during my stay here at MIT. I also dedicate this thesis to you all.
TABLE OF CONTENTS
Page No. Title page 1 ABSTRACT 2 ACKNOWLEDGMENTS 3 TABLE OF CONTENTS 4 LIST OF TABLES 9 LIST OF FIGURES 11LIST OF SYMBOLS AND NOTATIONS 17
CHAPTER
1. INTRODUCTION 23
1.1 GENERAL 23
1.2 SPECIAL SITE CHARACTERIZATION PROGRAM 24
1.3 OBJECTIVES, SCOPE AND ORGANIZATION OF THESIS 25
1.3.1 Thesis Objectives 25
1.3.2 Scope and Organization of Thesis 27
2. BACKGROUND 34
2.1 MESRI'S CONCEPT OF COMPRESSIBILITY 34
2.2 EFFECTS OF SURCHARGING ON THE REDUCTION OF THE
RATE OF CREEP 36
2.2.2 Based on the Methodology Developed by Mesri (1986) 2.3 CREEP BEHAVIOR AFTER RELOADING AN
OVERCONSOLIDATED SOIL CAUSED BY AGING
3. EXPERIMENTAL PROGRAM AND TEST PROCEDURES
3.1 EXPERIMENTAL PROGRAM 3.1.1 Overview
3.1.2 Consolidation Tests
3.1.3 Consolidation Phase of Automated SHANSEP CKo-DSS and CKo-TX Tests
3.2 GENERAL EXPERIMENTAL PROCEDURES 3.2.1 Radiography, Index Tests and Sample Extrusion 3.2.2 CRSC Tests
3.2.3 Special Incremental Oedometer Type B and Type C Tests 3.2.4 Consolidation Phase of SHANSEP Automated CKo Direct
Simple Shear (DSS) and Triaxial (TX) Tests
4. CLASSIFICATION - INDEX, STRESS HISTORY AND
CONSOLIDATION PROPERTIES
4.1 GENERAL GEOLOGY, STRATIGRAPHY AND MACROFABRIC 4.2 CLASSIFICATION - INDEX PROPERTIES
4.3 STRESS HISTORY
4.3.1 Effective Overburden Stress
4.3.2 Methods of Estimation of Preconsolidation Stress (',p) and Incremental versus Continuous Loading Tests
4.3.3 Stress History Profiles at 2400S and 600S 87
4.4 VIRGIN COMPRESSIBILITY 88
4.5 COEFFICIENT OF CONSOLIDATION AND FLOW PROPERTIES 88 4.5.1 Normally Consolidated Coefficient of Consolidation, cv(NC) 88
4.5.2 Flow Properties (Ck and kvo) 90
5. RATE OF SECONDARY COMPRESSION FOR NORMALLY
CONSOLIDATED CLAY 114
5.1 BACKGROUND 114
5.2 VALUES OF C./CR 115
5.3 DISCUSSION AND ANALYSIS 117
6. RESULTS AND ANALYSIS OF TYPE B OEDOMETER
TESTS 128
6.1 BACKGROUND 128
6.1.1 Incremental Oedometer Testing to Predict Effects of
Surcharging on Post-construction Creep Behavior 128 6.1.2 Experimental Problems During Type B Oedometer Test Program 128
6.2 RESULTS AND ANALYSIS OF SURCHARGE TESTS 129
6.2.1 Based on Methodology Developed by Ladd (1989) 129 6.2.2 Based on Methodology Developed by Mesri (1986) 134 6.3 COMPARISON AND DISCUSSION OF THE TWO METHODOLOGIES 136 6.3.1 Creep Settlement Predictions Using Ladd's Methodology 136 6.3.2 Creep Settlement Predictions Using Mesri's Methodology 137
7. RESULTS AND ANALYSIS OF TYPE C OEDOMETER
TESTS 162
7.1 BACKGROUND 162
7.2 RESULTS AND ANALYSIS OF RELOADING TESTS 162
7.3 COMPARISON AND DISCUSSION OF THE TEST RESULTS 165
8. SUMMARY, CONCLUSIONS AND RECOMMENDATIONS 173
8.1 PROJECT DESCRIPTION AND THESIS OBJECTIVES 173 8.2 PROPERTIES OF THE SALT LAKE CITY CLAYS 175 8.2.1 Consolidation Properties of the SLC Clays 175
8.2. 1.1 Stress History 175
8.2.1.2 Maximum Virgin Compression Ratio 176
8.2.1.3 Normally Consolidated Coefficient of Consolidation 176 8.2. 1.4 Permeability Change Index, Initial Void Ratio and Virgin
Compression Index 177
8.2.2 Creep Properties of the SLC Clays 178
8.2.2.1 C/CR 178
8.2.2.2 Creep Behavior as a Function of the Adjusted Amount of
Surcharge (AAOS) 179
8.2.2.3 Creep Behavior After Reloading to the Vicinity of
Preconsolidation Stress 182
8.3 RECOMMENDATIONS 182
APPENDIX 188 A. RADIOGRAPHIC LOGS OF TUBE SAMPLES USED FOR
MIT TEST PROGRAM 189
B. CONSTANT RATE OF STRAIN CONSOLIDATION (CRSC) TESTS 216
C. SPECIAL TYPE B INCREMENTAL OEDOMETER TESTS 231
D. SPECIAL TYPE C INCREMENTAL OEDOMETER TESTS 360
E. CONSOLIDATION PHASE OF AUTOMATED SHANSEP
CKo- DIRECT SIMPLE SHEAR (DSS) TESTS 399
F. CONSOLIDATION PHASE OF AUTOMATED SHANSEP
LIST OF TABLES
Table Title Page No.
1.1 Boring Locations and Undisturbed Sampling for Special
Laboratory Testing Program 30
3.1 The Scope of Consolidation Testing at MIT 68
4.1 Summary of CRSC Tests 91
4.2 Summary of MIT Incremental Oedometer Tests (2 p) 92
4.3 Summary of CKo-DSS Tests (2 p) 94
4.4 Summary of CKo-TX Tests 96
4.5 Virgin Compression Ratio of Incremental Oedometer Tests 97 4.6 Virgin Compression Ratio of Continuous Loading Tests 98
4.7 Normally Consolidated Coefficient of Consolidation for MIT
Oedometer and CRSC Tests 99
4.8 Summary of Flow Properties for CRSC and MIT Oedometer Tests (2 p) 100 5.1 Ca, CR and Ca/CR for MIT Oedometer Tests (3 p) 120
5.2 C,, CR and Ca/CR for WCC Oedometer Tests (2 p) 123
6.1 Effects of Mechanical Overconsolidation (Surcharging) on Reduction in
Creep from MIT Type B Oedometer Tests 139
6.2 Correlation to Predict Time tfit for the Settlement Predicted from
LIST OF TABLES
(Concluded)
6.3 Correlation to Predict Start of Creep Using Mesri's Methodology 141 6.4 Post-surcharge Creep Behavior at Varying t/tl using Mesri's
Methodology (3 p) 142
6.5 Calculations of Post-surcharge Creep Settlements using Ladd's
Methodology 145
6.6 Calculations of Post-surcharge Creep Settlements using Mesri's
Methodology 146
7.1 Effects of Reloading to the Vicinity of Preconsolidation Stress on the
Creep Behavior from MIT Type C Oedometer Tests 167 7.2 Calculations of Creep Settlements After Reloading to the Vicinity
LIST OF FIGURES
Figure Title Page No.
1.1 Location of Great Salt Lake Valley (from Lund, 1990) 31
1.2 Interstate Highway Map in the Great Salt Lake Valley (from Lund, 1990) 32
1.3 The Location of Design Segments 600S and 2400S
(from Wasatch Constructors) 33
2.1 Corresponding Values of Rate of Secondary Compression (Ca) and Compression Index (Ce) at Any Instant (e, o'~, t) During
Secondary Compression (from Mesri and Castro, 1987) 42 2.2 The Unique Relationship between Rate of Secondary Compression
(C,) and Compression Index (Cc) for Three Different Soils
(from Mesri and Castro, 1987) 43
2.3 Basic Concepts of the Effects of Surcharge on Secondary
Compression (from Ladd, 1989) 44
2.4 Reduction in the Rate of Secondary Compression due to Surcharging
for Data Adjusted to tr = t, (from Ladd, 1989) 45 2.5a,b Reduction in Rate of Secondary Compression due to Surcharge from
Data in Ladd (1989) 46
2.6 Mesri's Basic Concepts of the Effects of Surcharge on Secondary
LIST OF FIGURES
(Continued)
2.7 Post-surcharge Secant Creep Index for Deposits of Soft Clay and Silt
(from Terzaghi et. al. 1996) 49
2.8 Empirical Correlation between ti/tpr, at which Creep Occurs and the Effective Surcharge Ratio, R's, for Soft Clays and Organic Soils
(from Terzaghi et. al. 1996) 50
2.9 Post-surcharge Secant Creep Index for Middleton Peat
(from Mesri et. al. 1997) 51
2.10 Empirical Correlation between ti/tpr at which Creep Occurs and the Effective Surcharge Ratio, R's, for Middleton Peat
(from Mesri et. al. 1997) 52
2.11 Secondary Settlement of Clay Layer (Lo = 20 m) Loaded in the
Field to o'vf Near the Preconsolidation Stress (from Mesri et. al. 1994) 53 2.12 Secondary Settlement of a Diluvial Clay in Osaka Bay Predicted
by the C,/C, Law of Compressibility (from Mesri et. al. 1994) 54 2.13 Measurement of the Creep Behavior After Reloading to the Vicinity
of the Preconsolidation Stress for Special Type C Oedometer
Test Program 55
3.1a, b General Procedure for Special Type B Oedometer Test Program 69 3.2 General Procedure for Special Type C Oedometer Test Program 71
LIST OF FIGURES
(Continued)
3.3 Typical Radiographic Prints Illustrating Macrofabric Found in the
SLC Clays 72
3.4 MIT Automated Constant Rate of Strain Consolidation (CRSC)
Apparatus (from Wissa et. al. 1971) 73
3.5 Modified Incremental Oedometer Cell Used for Type B and C
Tests at MIT 74
3.6 Apparatus Compressibility Curves of Two Incremental Oedometer
Cells Used for MIT Oedometer Test Program 75
3.7 Probe Not Properly Aligned with the Core of the Displacement
Transducer During an Oedometer Test 76
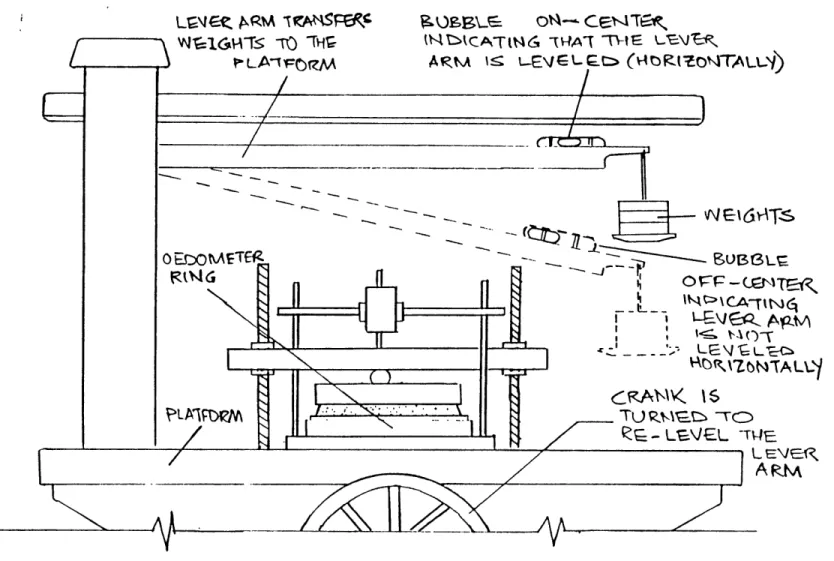
3.8 Re-leveling the Lever Arm of the Load Frame During an Oedometer Test 77 3.9 Vertical Strain versus log Time for a Typical Normally Consolidated
Load Increment with Well Defined Curvature 78
3.10 MIT Automated Modified Geonor Model 4 Direct Simple Shear
(DSS) Apparatus (from Ortega, 1992) 79
3.11 Schematic of the MIT Automated Stress Path Triaxial Apparatus
(from Estabrook, 1991) 80
4.1 General Stratigraphy for Design Sections 2400S and 600S 102 4.2 Classification - Index Properties for B-102 and B-102A (2400S) 103
LIST OF FIGURES
(Continued)
4.3 Classification - Index Properties for B-103 and B-103A (600S) 104 4.4 Arthur Casagrande's Plasticity Chart for Cohesive Soils at 2400S
and 600S. 105
4.5 Classification, Stress History and Virgin Compression Ratio at
B-102 and B-102A (2400S) 106
4.6 Classification, Stress History and Virgin Compression Ratio at
B-103 and B-103A (600S) 107
4.7 Comparison of EOP Compression Curves from CRSC and Incremental Oedometer Tests on Clay with S-shaped Virgin
Compression Line 108
4.8 Virgin Compression Ratio versus Natural Water Content 109 4.9 Normally Consolidated Coefficient of Consolidation versus Liquid
Limit from MIT CRSC and Oedometer Tests 110
4.10 Permeability Change Index and In Situ Hydraulic Conductivity
from e-log k Curves for Continuous and Incremental Loading Tests 111 4.11 Maximum Permeability Change Index versus Initial Void Ratio from
Continuous and Incremental Loading Tests 112
4.12 Final Virgin Compression Index versus Final Permeability Change
LIST OF FIGURES
(Continued)
5.1 Normally Consolidated Rate of Secondary Compression versus
Virgin Compression Ratio 125
5.2 Ca/CR versus Natural Water Content 126
5.3 Depth versus Natural Water Content and Ca/CR 127
6.1 Compression Curve for OEDB9 Illustrating Information Obtained
From Five Increments of a Type B Oedometer Test 147 6.2 Compression - log t Curves for Surcharge Load Increment (OEDB9-9)
and Normally Consolidated (without Surcharge) Load Increments
(OEDB9-8 and OEDB9-10) 148
6.3 Non-linear Post-surcharge Creep Behavior at Low AOS = 10 %, Medium
AOS = 25 % and High AOS = 35 % 149
6.4 Correlation to Predict Time tfit for the Settlement Predicted using Ladd's
Methodology to Match the Actual Settlement 150
6.5a, b Reduction in Rate of Secondary Compression due to Surcharge for MIT
Data on Salt Lake City Clay 151
6.6 Comparison in Reduction in Rate of Secondary Compression due to
Surcharge for MIT Data and Ladd's (1989) Relationships 153 6.7a, b Reduction in Rate of Secondary Compression due to Surcharge for MIT
LIST OF FIGURES
(Concluded)
6.8 Post-surcharge Displacement - log t Curve for OEDB9-9 using Mesri's
Zero Time Reference 156
6.9 Post-surcharge Creep Behavior for MIT Tests using Mesri's Methodology 157 6.1 0a,bPost-surcharge Creep Behavior for MIT Tests at Varying t/t, using
Mesri's Methodology 158
6.11 Correlation to Predict Start of Creep using Mesri's Methodology 160 6.12 Post-surcharge Creep Settlements for SLC Clay using Ladd's and
Mesri's Methodologies 161
7.1 Compression Curve for OEDC1 Illustrating Information Obtained
From Six Increments of a Type C Oedometer Test 169 7.2 Vertical Strain versus log Time Plot of OEDC 1-6B Illustrating the
Parameters Obtained from a Reload Increment Having oT'vf/o',(A) = 0.89 170 7.3 The Creep Behavior After Reloading to the Vicinity of the
Preconsolidation Stress 171
7.4 Total Settlement During Creep Following Reloading to the Vicinity
LIST OF SYMBOLS AND NOTATIONS
A AOS AAOS B AC Ca Ca'Cc(NC)
C,(Reload) Cc CKo-DSS CKo-TX CL CH Ck CR CRm1iax CRninActivity of the clay Amount of surcharge
Adjusted amount of surcharge Pore pressure parameter
Method of Arthur Casagrande to estimate o'p Rate of secondary compression
Post-surcharge rate of creep (Ladd) Post-surcharge rate of creep (Mesri)
Normally consolidated rate of secondary compression
Rate of secondary compression after reloading to the vicinity of the apparent preconsolidation stress
Virgin compression index
Ko(-consolidated direct simple shear Ko-consolidated triaxial
Clay of low plasticity Clay of high plasticity Permeability change index Virgin compression ratio
Maximum virgin compression ratio Minimum virgin compression ratio
LIST OF SYMBOLS AND NOTATIONS
(Continued)
CRSC Constant rate of strain consolidation Cv Coefficient of consolidation
cv(log t) Coefficient of consolidation determined using Casagrande's log time method
cy(NC) Normally consolidated coefficient of consolidation
cyv({t) Coefficient of consolidation determined using square root time method
1-D One-dimensional
DCDT Displacement transducer
d diameter
e void ratio
eo initial void ratio
EOP End-of-primary
GWT Ground water table H Thickness of clay layer
Hd Drainage height
H, Initial drainage height prior to consolidation
IL Liquidity index
Ip Plasticity index
LIST OF SYMBOLS AND NOTATIONS
(Continued) k, kvo LIR m MIT ml n NC OCR Oed OGSR
RR 2 r S SD SE SHANSEP SuVertical hydraulic conductivity In situ vertical hydraulic conductivity Load increment ratio
SHANSEP strength increase parameter; or the ratio of 1 - RR/CR Massachusetts Institute of Technology
Coefficient of volume change Number of data
Normally consolidated Overconsolidation ratio Oedometer
Original ground surface
Effective surcharge ratio (Mesri) Recompression ratio
Regression coefficient
Degree of saturation; or SHANSEP NC undrained strength ratio Standard deviation
Method of Strain Energy
Stress history and normalized soil engineering properties Undrained shear strength
LIST OF SYMBOLS AND NOTATIONS
(Continued)
t Time
tso Time to reach 50 % consolidation
t9o Time to reach 90 % consolidation
tl0o Actual time to reach the strain at the end-of-primary consolidation
tage Time of load increment with sustained secondary compression
ttit Time for the post-surcharge creep settlement predicted using Ladd's methodology to match the actual settlement
tj Time to reach maximum post-surcharge rebound measured since the removal of surcharge (Mesri)
t1, Time to reach maximum post-surcharge rebound measured since the application of surcharge (Mesri)
tp Time to reach the end-of-primary consolidation
tpr Time to reach end-of-primary rebound measured since the removal of
surcharge
t, Time at the removal of surcharge
Pseudo time for the initiation of post-surcharge rate of creep (C,') measured since the application of surcharge; or pseudo time for the initiation of reload rate of creep (Ca(Reload)) measured since reloading
u Pore pressure
LIST OF SYMBOLS AND NOTATIONS
(Continued)
VCL Virgin Compression Line WCC Woodward-Clyde Consultants
WL Liquid limit
wN Natural water content
w1) Plastic limit
z Depth measured from the ground surface Yt Total unit weight of soil
Yw Total unit weight of water s(Reload) Vertical strain
Ev Vertical strain
Ecv Vertical consolidation strain o~p Preconsolidation stress
G'p(A) "Apparent" preconsolidation stress developed from secondary compression ',p(AC) Preconsolidation stress estimated from the end-of-primary compression
curve using the method of Arthur Casagrande
o',(SE) Preconsolidation stress estimated from the end-of-primary compression curve using the method of Strain Energy
C7v Total vertical stress
LIST OF SYMBOLS AND NOTATIONS
(Continued)
CY'v Effective vertical consolidation stress during a load increment
G'av Final effective vertical consolidation stress after unloading to the desired overconsolidation ratio; or final effective vertical consolidation stress after reloading to the vicinity of the apparent preconsolidation stress
Uvo Total vertical overburden stress aOvo Effective vertical overburden stress
Y'vs Effective vertical consolidation stress of the surcharge load increment
p Settlement
Pc Consolidation settlement
ps Secondary compression settlement
Chapter 1
INTRODUCTION
1.1 GENERAL
The existing Interstate 15 (1-15) highway, which included numerous embankments and bridges, in Salt Lake City (SLC) was constructed during the 1960's. Construction of high embankments used controlled rates of preloading with surcharge fills and vertical sand drains to accelerate the rate of consolidation. The Utah Department of Transportation (UDOT) decided to implement reconstruction of 1-15 to increase the highway capacity, primarily by widening existing roadways via additional lanes to be constructed within the existing right-of-way. The design-build project, which is estimated to cost about one billion US dollars, involves the design and construction of new bridges and embankments over 20 - 30 m of soft SLC clays. Reduction of post-construction
settlements is a major design requirement in order to achieve a highway system that will perform significantly better than the original construction.
SLC is located in the Great Salt Lake Valley (GSLV), as shown in Figure 1.1. The map of the interstate highway grid is shown for Utah in Figure 1.2. Anderson et. al. (1994) and Lund (1990) provide an overview of the general geology of the Great Salt Lake Valley. This valley is a remnant of the ancient Lake Bonneville, an extensive glacial lake formed during the Pleistocene epoch. The deep-water Lake Bonneville sediments consist of thinly bedded fine sand, silt and clay with minor amounts of coarse sand and gravel. The post-Lake Bonneville deposits in the valley are mostly flood-plain alluvium associated with the Jordan River and its tributaries.
Since reconstruction of the 1-15 highway requires placing substantial fills (with thickness up to 10 - 15 m) over the soft SLC foundation soils in a relatively short period of time, the design involves: (1) staged construction with prefabricated vertical (wick) drain (plus geotextile reinforced fill in some cases); and (2) very extensive surcharge fills
to reduce post-construction settlements due to secondary compression. The allowable post-construction settlements range from 25 mm at the bridge abutments to a maximum of 76 mm for the remaining portions of the highway over a period of about 10 years.
Woodward-Clyde Consultants (WCC) is acting as the geotechnical consultant to Wasatch Constructors for the design, construction and monitoring of the 10-km segment of the 1-15 highway between 1-80 East and 1-80 West (Figure 1.3). Note: 1-80 West runs just south of the SLC International Airport (Figure 1.2).
In turn, WCC engaged Professor Charles C. Ladd as a consultant for advice regarding the stability and settlement issues and Dr. John T. Germaine to supervise a special program of Ko-Consolidated Undrained (CKoU) shear tests. In addition, WCC agreed to support thesis research by the author on the characterization of the consolidation and creep properties of the SLC clays.
1.2 SPECIAL SITE CHARACTERIZATION PROGRAM
The geotechnical data provided by the Utah Department of Transportation (UDOT) with the bid documents included numerous boring logs and piezocone (CPTU) profiles, but very little high quality consolidation data and no CKoU shear test data. Consequently, WCC and its partner (Terracon Consultants Western, Inc.) selected five representative locations for undisturbed sampling and special laboratory testing at MIT and by the WCC geotechnical laboratory in Totowa, NJ.
Table 1.1 summarizes the location of the borings and number of samples and comments on the extent of laboratory testing to date.
The first set of borings (B-101 through B-105) used pushed Shelby tubes for sampling and was of generally poor quality. The second set (B-102A through B-105A) used heavier weight drilling mud and fixed piston sampling that generally produced
better quality samples. All the samples (except those from B-101 and some from B-103) were radiographed at MIT prior to testing and then either kept at MIT for testing or sent to the NJ lab of WCC.
The special laboratory program had the following objectives:
1) Determination of the preconsolidation stress (',p) profiles, especially for the development of site specific correlations with the CPTU data.
2) Evaluation of consolidation properties, i.e., values of compressibility (virgin compression ratio (CR = Cc/(l+eo)), coefficient of consolidation (cv) and hydraulic conductivity (kv). Note: WCC also ran oedometer tests on horizontal samples to obtain Ch and kh.
3) Evaluation of the rate of secondary compression (Ca), the values of Ca/CR, the influence of surcharging (mechanical overconsolidation) on the reduced rate of creep behavior and the variation in creep behavior after reloading to the vicinity of U', of clay that has been overconsolidated due to aging (i.e., secondary compression since originial construction).
4) Stress History and Normalized Soil Engineering Properties (SHANSEP) Ko -consolidated undrained direct simple shear (CKoU-DSS) and triaxial (CKoU-TX) testing to obtain values of S and m for the prediction of both the initial undrained strength (s,) profile and increases in s, during staged construction. Note that S, m and s, are related to stress history (preconsolidation stress, G',, and overconsolidation ratio, OCR = Y',/cy'vc) according to the SHANSEP equation:
,/CY'vc = S (OCR)m ... Eq. 1.1
1.3 OBJECTIVES, SCOPE AND ORGANIZATION OF THESIS
1.3.1 Thesis Objectives
The prime objective is to characterize the one-dimensional (1-D) drained creep properties of the SLC clays, specifically:
(1) Values of the C,/CR ratio to check Mesri's (1986) uniqueness concept of compressibility.
(2) The influence of surcharging (mechanical overconsolidation) on reducing the rate of post-construction creep. The goal is to develop correlations for use in the design of
surcharge fills.
(3) The variation in creep behavior after reloading an aged, overconsolidated soil to the vicinity of o',.
Two types of incremental oedometer tests were run at MIT for this prime objective:
(1) Type B tests. To obtain two types of measurements, namely: Ca/CR values from load increments within the virgin compression (VC) range; and the reduced rate of creep behavior observed after unloading from load increments within the VC range (at the end-of primary (EOP) consolidation) to varying OCR. Note that the latter measurements simulate the removal of surcharge in the field by mechanically overconsolidating a normally consolidated (NC) foundation clay.
(2) Type C tests. To obtain a two types of measurements, namely: Ca/CR values as before; and the creep behavior observed after reloading to the vicinity of ',p an overconsolidated soil specimen resulting from prior aging. Note that the overconsolidation comes from one to two log cycles of secondary compression sustained during the prior load increment (that measures Ca/CR) within the VC range.
The second objective is to characterize the stress history and consolidation properties as measured from the tests with continuous loading as accomplished in Constant Rate of Strain Consolidation (CRSC) Type A tests and CKo-phase of the automated DSS and TX tests. In addition, the author also evaluated values of Ca/CR obtained from selected oedometer tests performed by the New Jersey laboratory of WCC.
1.3.2 Scope and Organization of Thesis
Chapter 2 summarizes background information on previous research on the rate of secondary compression, with emphasis on:
(1) Influence of surcharging (mechanical overconsolidation) on reducing the rate of creep. The chapter presents two approaches developed for the design of surcharge fills: (a) Ladd's (1989) methodology, as presented in Stewart et. al. (1994); and (b) Mesri's (1986) methodology.
(2) Influence of reloading to the vicinity of o'p (caused by aging) on the creep behavior of peat (Mesri et. al. 1997). Note: published work in this topic of research is scarce.
Chapter 3 presents the scope of the author's experimental program (plus MIT's SHANSEP testing) and describes the testing procedures for the following:
(1) Radiography. Emphasis on the importance of radiographing all tube samples for determining the soil macrofabric and for selecting the best quality soil for consolidation and strength testing.
(2) CRSC (Type A) tests. Emphasis on the selection of an appropriate strain rate and methods of interpretation.
(3) Special incremental oedometer (Type B and Type C) tests. These are illustrated in Figures 3.1 and 3.2. The text discusses the experimental procedures and problems in obtaining reliable measurements of small vertical strains (i.e., at low rates of creep). (4) The consolidation phase of automated CKo-DSS and CKo-TX tests.
Table 3.1 summarizes the scope of MIT's experimental testing program producing data for the thesis and shows for each test specimen the following information: (1) tube location (boring and depth); (1) test type; (2) test number; (3) nominal natural water content (wN); and (4) macrofabric description.
Chapter 4 presents the following:
(1) The general geology, stratigraphy and macrofabric (see Appendix A) of the foundation soils at the test sites.
(2) Classification and index properties from WCC, Terracon Consultants and MIT. (3) The stress history based on MIT laboratory test results, with emphasis on the
evaluation of o'p (using the method of Strain Energy) and the merit of continuous loading over incremental loading in giving reliable estimates of the o'p.
(4) Consolidation (mainly from MIT continuous loading and MIT oedometer tests) properties (in addition to o',) of the SLC clays, such as: the maximum virgin compression ratio (CRmax), the normally consolidated coefficient of consolidation (cv(NC)), the in situ hydraulic conductivity (kvo) and the slope of e-log k (Ck) within the VC range. The chapter also presents some correlations developed for certain consolidation properties: CRmax versus wN, cv(NC) versus liquid limit (wL); Ck versus e,; and Ck versus CC.
Chapter 5 presents C,/CR values obtained from the incremental oedometer tests by MIT (Types B and C) and selected tests by WCC. The validity of Mesri's unique C,/CR concept for the SLC clay deposits is investigated, e.g., the unique relationship between C, and CR (Figure 5.1) and the variation in Ca/CR with wN (Figure 5.2).
Chapter 6 presents the influence of surcharging on reducing the rate of creep using the results from Type B oedometer tests run on SLC clay specimens. The two different methodologies of Ladd (1989) and of Mesri (1986) are applied in presenting and interpreting the test data. The results are used to predict creep settlements for various amounts of surcharge (AOS) for a hypothetical layer of SLC clay.
Chapter 7 presents the influence of reloading to the vicinity of o'p (caused by aging) on the creep behavior of the SLC clays using the results from Type C oedometer tests run at MIT. The influence of reloading to varying amount of oC'v,,/'p on the reload rate of creep (Ca(Reload)) is presented in a normalized plot of Ca(Reload)/Ca(NC) versus
c'v-/a'p. This relationship is used to predict the creep settlements at varying o',,/o'p and
Chapter 8 presents a summary, conclusions, and recommendations from the findings of the research and Chapter 9 contains a list of references used for this thesis.
Appendix A contains logs prepared from the radiographs for all of the tubes used for the consolidation tests listed in Table 3.1, along with the test numbers. Appendix B contains plots of ev, u and c, versus logo'vc, SE-o'v, and e-logk from CRSC tests run at MIT. Appendix C contains plots of ev-loga',,, SE-o've, e-logk and displacement-logt curves from Type B incremental oedometer tests run at MIT. Appendix D contains plots of ev-loga'vc, SE-o'vc, e-logk and displacement-logt from Type C incremental oedometer tests run at MIT. Appendix E contains plots of ev- logo've and SE-a',v from CKo-DSS tests run at MIT. Appendix F contains plots of Ev- and Ko- logo'vc and SE-o'vc from CKo-TX tests run at MIT.
Table 1.1: Boring Locations and Undisturbed Sampling for Special Laboratory Testing Program
Design Section
600 S
600
S
1300 S
2400 S
2400
S
Location Name 600 South South Temple 1700 South 2400 South SR 201
Near intersection of Near intersection of Near intersection of
Location 400 South St. on South Temple St. & 1700 South St. on Andy Ave. & 2100 South St. &
East side of 1-15 700 West St. East side of 1-15 600 West St. 700 West St.
Boring No. B-105 (4/31/97) B-103 (4/5/97) B-101 (4/15/97) B-102 (5/1/97) B-104 (4/29/97)
(Date) B-1 05A (5/30/97) B-1 03A (5/28/97) B-1 02A (5/22/97) B-104A (5/30/97)
B-105 B-103 B-101 B-102 B-104
n =10 n = 6 n = 10 n =11 n =13
z=6-31 m z=9-32m z=3-38m z=5-31 m z=2-29m
[Mostly disturbed] [Mostly WCC tests] [DSS & CRS tests [Mostly disturbed,
No. of Samples by MIT] tubes saved]
Depth Interval [Tubes
(m) radiographed by
B-105A B-102A WCC; Oedometer B-102A B-104A
[Remarks] n = 17 n = 21 tests by WCC] n =18 n =16
z= 1 -33m z= 1.5-23m z= 2-33m z= 3-23m
[Mostly saved] [Extensive tests by [Extensive tests by [MIT testing at
ORrr.-r•n RASKA r r r r r ,oa I· ARIZONA EW (ICO SO• ..
Figure 1.1: Location of the Great Salt Lake Valley (from Lund, 1990)
VV I
C
C7
i I / . OMMIA S tfS
C
SCONSTRUCTION
SEGMENT 2
CONSTRUCTION SEGMENT 3
DESIGN SECTIONS
DESIGN SECTIONS
2.1 2.2 2.3 3.1 3.2 3.3 4500 S. p - 'I. 3300 S.
I
I' I I I ~ a I - I 2400 S. am 900 W.TEAM TRACK
Hi
Ia 1300 S. Jord:an River II i 0J SV I t .2"..".? 4 . el• • -,. c p-virj 600 S.Figure 1.3:The Location of Design Segments 600S and 2400S (from Wasatch Constructors)
I
600 N. .A. a-Fm';'
>0 rM
------I
MEO ii I | I II Ik 11
11
3
11Ctn "t
fi II II~ ·· --- · ·- ---- i ii I··Chapter 2
BACKGROUND
2.1
MESRI'S CONCEPT OF COMPRESSIBILITY
Mesri's C,/CR' concept of compressibility (Mesri and Godlewski 1977; Mesri and Castro 1987) provides a framework to define the rate of secondary compression behavior of a soil at all values of effective vertical stresses (c've) during recompression and virgin compression and throughout secondary compression using a single value of C,/CR together with the end-of-primary (EOP) ev-loga'v, curve. At any instant (sw, c)vc, t); Cc = rate of secondary compression = deF/dlog t; sv = vertical strain; t = time; and o'vc
= effective vertical stress. Note that CR denotes the tangential slope of the Ev-logo'vc
curve throughout both the recompression and compression ranges. Figure 2.1 shows the graphical evaluation of C, and Cc = CR (1+eo) at any instant (e, oy'vc, t). According to the concept, the magnitude and behavior of C, with stress and time is directly related to the
magnitude and behavior of CR with effective vertical stress, o'yc and time. In general,
the following relationship is established at a given c'vy:
C, behavior with time CR behavior (shifting Ev-logc'vc) with time
Constant Constant
Decreases Decreases
Increases Increases
C,/CR referred to in this thesis is the same as Ca/Cc in Mesri's literature because: for Ca/CR, the unit of rate of strain in Ca = de6/dlogt and that in CR = ds~/dlogo'•, cancel each other; and for C,/Cc, the unit of change in void ratio in C, = de/dlogt and that in C, = de/dlogo'vc cancel each other.
Figure 2.2 plots the values of Ca versus CG to show the unique relationship for three different soil deposits: Bethierville Clay, Tar Sand and Bearpaw Shale. For all geotechnical materials, the total range of Ca/CR is 0.01 to 0.07, where the median value of 0.04 represents the most common value for inorganic clays and silts (Terzaghi et. al. 1996). Table 16.1 from page 110 of Terzaghi et. al. (1996) summarizes the common values of Ca/CR for all geotechnical materials:
Geotechnical Material Ca/CR
Granular soils including rockfill 0.02 + 0.01
Shale and mudstone 0.03 + 0.01
Inorganic clay and silts 0.04 + 0.01
Organic clays and silts 0.05 + 0.01
Peat and muskeg 0.06 + 0.01
Mesri and Castro (1987) and Mesri and Feng (1991) report successful application of the Ca/CR concept of compressibility in explaining and predicting secondary compression behavior of soft clays and silts with and without surcharging. Mesri (1986) reports successful application of this concept in interpreting laboratory measurements and predicting field secondary compression of peat with and without surcharging.
Chapter 5 will investigate the validity of Mesri's unique Ca/CR concept of compressibility for the Salt Lake Clay (SLC) deposits. The interpretations of test data from the special (Types B and C) oedometer program in Chapters 6 and 7 require the application of this concept.
2.2 EFFECTS OF SURCHARGING ON THE REDUCTION OF THE
RATE OF CREEP
Soft foundation soils can experience large post-construction secondary settlements (ps), when the soils are loaded to final effective vertical stresses (a',f) beyond the preconsolidation stress (a'p) profile, because of the high rate of secondary compression for normally consolidated ground (Ca(NC)), which is related to CR by Mesri's unique Ca/CR concept of compressibility explained above. Post-construction secondary settlement is estimated from the following equation:
Ps = Hi Ca log(t/tp) ... Eq. 2.1
wherein: Hi = initial thickness of the soil layer tp = time to the EOP consolidation t = time beyond t,.
In addition, vertical drains are often used in the construction of the embankments over soft foundation soils to reduce the construction time (and construction costs) by accelerating t,. Since Ps is proportional to log(t/tp), the use of vertical drains will increase ps at given t, Hi and C,. For example, if tp is reduced from 400 days to 120 days after installing vertical drains, the increase in Ps after t = 10 years can expressed as: p, (with drains) / Ps (without drains) = log(10 x365 days / 120 days) / log(10 x 365 days / 400 days) = 1.545 or a 54.5 % increase.
However, the post-construction settlement of soft ground (loaded to o'vf > ',p with lowered tp) can be reduced significantly to an acceptable level by surcharging, which is to mechanically overconsolidate a normally consolidated (NC) soil layer from U'vf to the surcharge stress o'vs, during construction. Note: the additional stress imposed by the surcharge stress is A',v = o'vs - o'vf; and &'vf = the design final effective vertical stress after removal of the surcharge increment Ac'v. Figure 2.3 shows the ev-log(t/tp) curve for the sequence of surcharge loading (from o'v to a'vs) and unloading (from a'vs to 0'vf) for a typical surcharge oedometer test.
At present, two rational methodologies exist for interpreting the post-surcharge creep behavior. The methodologies were developed by Ladd (1989) and Mesri (1986). They differ in the methods of interpretation and presentation of the test data.
2.2.1 Based on the Methodology Developed by Ladd (1989)
Figure 2.3 presents the test data using Ladd's methodology. The sequence of surcharge loading (from o'v to oY'v) and unloading (from o'vs to o'vf) produces an amount of surcharge (AOS), which is determined using the following equation:
AOS = (t'vc - 'vf) / o'vf ... Eq. 2.2
A period of secondary compression is shown between tp and the time for the removal of
the surcharge (tr) to allow the measurement of Ca(NC) without surcharge. Hence, the
AOS is adjusted to reflect the increase in the c'p (due to aging) above o'vs. The adjusted
amount of surcharge (AAOS) is determined using the following equation:
AAOS = (',p -o'vf) / o'vf ... Eq. 2.3
where: o'p = C'vs (tr/tp)Ca/CR
After removing the surcharge increment Au'v = o'vs - o'vf at tr, the soil rebounds to a maximum heave and starts to creep when t = ts at a reduced post-surcharge rate of creep (Ca'). The portion of post-surcharge ev-logt illustrates how the creep behavior is interpreted by evaluating the reduced C,' and the time (ts) for commencement of Ca'. Ca'
is evaluated from the tangent fitted through the linear-most portion of the post-surcharge creep portion of the ev-logt, where t = 0 is set at the beginning of the surcharge load increment to o'vs. ts is evaluated as the time for the commencement of Ca'. Note: Section 6.2.1 will discuss the rational selection of the portion of ev-logt for evaluating Ca' and ts for Type B tests since the creep portion of ev-logt is sometimes highly non-linear. The reduced post-surcharge creep settlement is determined by:
The reduced creep behavior is presented by plotting normalized Ca'/Ca(NC) and log(ts/t,) versus the AAOS. Ca'/C, represents the reduction in the rate of creep and ts/tr the delay in the reoccurrence of creep after unloading. Ladd (1989) reports the results from oedometer tests run on five cohesive soils. The original results are presented in Figure 2.4 and also in Stewart et al. (1994) in Figure 2.4. The set of correlation lines recommended by Ladd (1989) based on judgment for the data (n = 22) ranging from
AAOS = 6 to 43 % were fitted by the author as follows:
Correlation Correlation Equation
Line Equation No.
Mean Ca'/Cc = 1.138 -0.0367 AAOS (%)+ 0.000281 (AAOS, %)2 ... Eq. 2.5a
Maximum Ca'/C, = 0.991 -0.0344 AAOS (%) + 0.000259 (AAOS , %)2 ... Eq. 2.5b
Minimum Ca'/Ca = 1.214 -0.0337 AAOS (%) + 0.000209 (AAOS, %)2 ... Eq. 2.5c
Mean log (ts/tr) = 0.020 AAOS (%) ... Eq. 2.6
After excluding the questionable data (shown by the two question marks in Figure 2.4), regressions run on the more reliable data yield a new set of correlations shown in Figure 2.5. These correlations are summarized below:
Remarks about the Correlation Equation Equation
Correlation (n, r2, SD) No.
Mean Ca'/Ca = 2.034 - 1.192 log(AAOS, %) ... Eq. 2.7 (20, 0.888, 0.107)
Mean log (ts/tr) = 0.0208 AAOS (%) ... Eq. 2.8a (through the origin) (20, 0.608, 0.189)
Mean log (ts/tr) = 0.0376 + 0.0194 AAOS (%) ... Eq. 2.8b (regular regression) (20, 0.612, 0.188)
2.2.2 Based on the Methodology Developed by Mesri (1986)
Figure 2.6 presents data from a typical surcharge increment using Mesri's methodology and describes the sequence of surcharge loading and unloading at t's. The surcharge ratio, Rs, has the same definition as AOS in Eq. 2.2. If t's exceeds tp = t'ps, R's is adjusted to reflect aging and the effective surcharge ratio, R's, is equal to the AAOS (Eq. 2.3). After unloading the surcharge at t's, the soil rebounds to an end-of primary rebound at tpr and a secondary rebound that levels off at tl and is followed by creep. Both
tpr and tl are measured from the time at which the surcharge load is removed. Note the two different logt axes in Figure 2.6. The post-surcharge rate of creep (Ca") is defined from the secant between the maximum heave at tl and any time at which the surcharge rate of creep is to be evaluated. Ca" increases with time. The reduced post-surcharge creep settlement is determined by:
The reduced creep behavior is presented by plotting normalized Ca"/Ca(NC) versus t/t, (for the range of R's) and ti/tpr versus R's. Mesri and Feng (1991) report the results from special oedometer tests run on undisturbed specimens of soft clays. These results are presented by Mesri in Terzaghi et. al. (1996) in Figures 2.7 and 2.8 for the range of R's from 0.2 to 1.0 and t/tl from 1 to 4,000. More recent work by Mesri et. al. (1997) reports the results from special oedometer tests run on Middleton Peat. Ca"/C, versus t/tl is plotted in Figure 2.9 for the range of R's from 0.2 to 2.0 and t/tl from 1 to 10,000. ti/tpr versus R's is plotted in Figure 2.10 for the range of R's from 0.15 to 2.4.
2.3
CREEP
BEHAVIOR
AFTER
RELOADING
AN
OVERCONSOLIDATED SOIL CAUSED BY AGING
When a normally loaded soil is subjected to aging (secondary compression), it develops an increased preconsolidation stress, ',p. Upon reloading (o'vf) to the vicinity of ao',, it exhibits a recompression to compression response, similar to the behavior illustrated for Diluvial Clay in Osaka Bay reloaded to o'vf/•' = 0.77 and 0.91 in Figure 2.11 2. The increase in the rate of creep, C,(Reload), as o'v/o', increases from 0.77 to
0.91, can be explained by Mesri's unique C,/CR concept compressibility, wherein the
dramatic increase in Ca(Reload) is consistent with the sudden transition from a low to a higher CR as 'vf approaches o'p.
Figure 2.12 shows that, for the secondary settlement of a 20 m thick Diluvial Clay in Osaka Bay, Ca(Reload) initially increases gradually within the recompression range (i.e., o'vto',p less than 0.9) and then increases dramatically at the transition from recompression to compression (i.e., from a'vf/a'p = 0.9 to 1.2). This phenomena is
consistent with Mesri's concept of compressibility, wherein the dramatic increase in
2 Although the author does not know if a', was due to aging or mechanical overconsolidation, the
C,(Reload) is consistent with the sudden transition from a low recompression ratio (RR) to a high compression ratio (CR) near a'p. Note that the creep settlement can be the largest component of the total settlement near o',(A). For example, at o',f/a'p = 1.0, the EOP consolidation settlement (occurring at tp) of the 20 m clay is p, = 30 cm, and the total settlement at t/t, = 10 and 100 are pt = 60 and 115 cm. Hence, the creep settlements at t/t, = 10 and 100 are ps = Pt - Pc = 30 and 85 cm, which correspond to 50 % and 75 %
of the total settlement.
A Type C special oedometer test program was undertaken at MIT to investigate the creep behavior caused by reloading to the vicinity of o'p that had been produced by one-dimensional (1-D) drained aging. Figure 2.13 illustrates the measurement of the rate of creep after reloading (Ca(Reload)) and the pseudo time for the initiation of creep (ts).
log
t
log
orvI
Figure 2.1: Corresponding Values of Rate of Secondary Compression (C,,) and Compression
Index
(Ce)
S6 Si g4 S 2 If C I Z 0W OA 4 W 8 o 002 12 L4 Wify
004 o06 e oQo ass
C. * de/Mog lle q,
' Q ( 03 Q4 QS
•eq
(a) Be atile Clay; (b) Tar Sand; (c) Bearpaw Shai, R Pck Dam
Figure 2.2: The Unique Relationship between Rate of Secondary Compression (C,)
and Compression Index (Co) for Three Different Soils (from Mesri and Castro, 1987)
Too NIL * .3 6-4 a S-T7 *. 4 W* a 4% * C/C 04 wp* 24% S 1 131 Tees N. * TR-I * -2 * -3 a * -4 9 Ce/C. '0035 0 ** btiti Propeties S Vd Rate a 004 * * ~watr Contene * 42 W 5M a62 &
U
Tooe NI * fPO I . * 2 6P)* 20
* .34 we214% o 44% -. .,. 4MPo iv i i I IP"o
ffzrx-m% n * i ----.i
t
rA')
t
ir-
r~~7r ? II J'-0-- 1 : ,--,r'-r -r - .- t---I-4L~t
II I 't ';
-· --, - P '.--" --- ·-.t.! ; l-ii , I;i-t-r!-I-
t •'
t
Pi - --t-- t -'1-1---*' ... t-c- • --•-"• · 1--I · "Z o '/ •1 :-I
.. .. . .. I l . " . . ; . . , " ' 'l:-~\
rA: • " I : '·'
. 4:-1 . *: I ...1 ~~··-1*--v ry!- 114-I 1 ITT t-t -'-:~ "'' , ~~ -'T --- -SL I t .--, t- - -r -'r :j .-I... · '-i--iH1..
1-_-:
i--:
;-- . . . I-- -.aL,• '
0-!1
Li :47
i i i "' " mmI tS- I I ;~~ t · · ~-·-I -- e~ ,-tec
/!-
/e_
-t
&
-e
: ...P1/ I-T -- t----I/i r V,5 Z.Oq1--,.,•5 • - ' :F--
+ $I
I..I It I _I Al . Ca I~bAAA I-1::~I-I
'-T--"t .i
...
r :\ t--I , - •--t ... .. I "Y "- ~ t " ~ . . .I " I_ _ , • - . . . . . . .. . , .I~: o :' • -. ' " . .. I " | ...
' ... ... .. . . - • t . 1 ' I -; .. - S" -. : . . ._ •____-.. . -St T SI . -~~~~~~~~~ ~ I -.7·(
O. ,7'
:
* t' " t -- ~--i---. ': ; --.i
:' -; ;I;-:
:
,-i
.-.
..
l
,
..
!t t-
..-
·C
rr -,- ---t,- t-i-TI --1 I .. .r" - - r V -r -• !-l--.-
,-!•.
--
·
r,--C-,
i
z
r•
-
:
I
VI nti- fiJ~...
" .
.. . .
•qe
Seo{nday
t -~z~2Ji" -TVV I- ;I~/d
.
1·I..
l4 -:.- l - :-3-
r
•
-' -r-1-,e r- r 1 I- T ---T-t ,.L-t. t ;-yI ". -T H,-TT ; I!ir4TVTF~
Figure 2.3: Basic Concepts of the Effects of Surcharge on Secondary Compression (from Ladd, 1989)
.4 TI-
::x
. .~ IA 1K 1 • ". t . ! .. ctc-y I '- r I ; " ' t -,-- i " ". " I : .E... r7t1
Ir I I t :"- -..t* * *
.5i
l'-
~.C1' J I -l- I -_-r-•Tt
r-i-t- t--T -1 -t-. trr Ti; I -T-ti-r- I-?r -T- T 1. II' -- • _4••d m -;-r-c-i--1-+-e ( r. r -r r I I
1--'
rf t i I T ·t· -r-j
ii -`
,,
·' '' ~
'
l'''~c~ rI 1--I
A.
-H-'t--'.4 f . iE
--OCO_
Fff
hic& -r 4-('t/)t( M
-- • --:... • : •• tr " (Hd rfo' nr *: --- (I -8) >-4(5oinrwhrek A:AId?) Z1CE (/989)T(S'yracu
•,l4')
;
• /C i1989-At'//') .... d CL" i, Wo-c,*-
5
-444Zt
. , hons~Idyrjl -es sa£ .· :-LA : -oo4 a0 O.O4lr oEG~,ISl ~jI
1b
'0PKJ.
0
" 20 " ,"•I
4
0 . 'tC1 r 1 JJ IA' I' '^^ .... I...~. I---v": . :.. ,: ... . .. ,J
'.;,r- -
"-.-- 21,Li;
d
i~
0?
e2
4 *' .. I*0<~
·-
I
t
.
I'- ·~ I *~'n-
i,'!··-·I·
"
I
,
L
·- · I-) i f i t ~ · ·( )- r t * . . I-l-0~h.
'I~...-Si -- 1 4. S-t -If -'I-.i •:-4_ -.4 -.--.to. 4. 1 -;-;-:. ,-i7-
2.60: ~t-;,t
;. ; -.:r:
'1 .1... I: I-•I , ,.·0
Zio
io.
20 -
FM
iT1
4
o
.
so
.
F u. re .- 4• :- Re4-ucto , , .. . of S-e-n , . o .-p --4t- fT l -t Sr--r in - I i
Figure 2.4: Reduction in the Rate of Secondary Compression due to Surcharging
for Data Adjusted to tr = tp (from Ladd, 1989)
.. ..
2.--: t-2.--:
ti ' -r .. F- f:. ,JJ ,.lZL/r .- ; _ ._? .. L - , , . 4 .< . .. ... .
!
N,,, -. ---S'".':
'
'...
... . .--l~i7"1- t
-rf4FA
V-
-I--r·O I t 1 28 1~ -- *L -- r--i ;- ·---"'''' '" -t\ I \ t:- r f1\: --i "' -*' 1-0 .,-. . I : : : • ! ; :I r ~ iui • I
7
r oc~ --- I-4-
Pw
).4 I i tri-i- 1. . -ia
• ° oI I LI ¢1 "Oa) O V)
r-CU
E0.75 0 z0.5
L-U) 0.25 3. 0 on02 --i., I I1
,--L-,--,~~
,i-,
,
.0:
I
:
. . ..
, ,.0 Mean Line Reported in Ladd (1989)
,,, Iog(tt,) = 0.0200 (AAOS, %)
00
AAOS
=
(0', -
y'd]
/
o (%)
O Data Reported in Ladd (1989)
O; Maximum Reduction ULine Reported in Ladd (1989)
. . . . -- - --Mean Reduction Line Reported in Ladd (1989)
IL
, ,, - -... Minimum Reduction Line Reported in Ladd (1989)
S ' Maximum Reduction from Regression by Author Mean - 1 SD
-• --- - . Mean Reduction from Regression by Author
- -. -Mii___ -- UII "m :, IIT . .... __,,__ Rd tif ... llllll R "R •" ' .. ... .. b . At "lflnR M M g2 = + i •1 SMean Reduction Line from RegessionbyAto
R
FC,'IC,(N
C)= 2.034 - 1.192 log (AAOS, %)·. ( n = 20, r2= 0.888, SD =0.107) SI I I -1 I 41 i I I ' • I I I I 1-1 S I I I C 1 -I4 L - ,..-•,.•~~~~~~~~ .J -" . .- -'J,' -' - L--"• L ' L _''•"& _ _• _L _•_•.._! , - ,j , i , , i i I i 1 I I I I I I I I I i I 1 , l I - I, ... ." -" . . . . i I I I -I ; I '(iY i
...
.
-"
I,'
, . .. .
_r ----1 - -- - I 7 nI I : I i s i 20 30AAOS = [a', - o'/lo'd (%)
50
1.0
0.8 log(t/t,) Regression by Author= 0.0208 (AAOS, %)
n = 20. r2 =0 6 0 8 . S D= 0 189' ~3 0.6 0 0.4 0.2 n . 20
Figure 2.5a: Reduction in Rate of Secondary Compression due to Surcharge from Data Reported in Ladd (1989)
I I I I I i I I I I \ I I I l I -- I- ---- --- -I i I I I I
0o.75
O 0z
o 0.5
a) CD U)0.25 0 t-.wO r
Mean Reduction from Rearession by AuthorC,'IC,(NC) = 2.034 -1.192 Iog(AAOS, %) (n = 20, r2= 0.888, SD = 0.107) -- 4----i I I T -I I i t , , .
I O Data Reported in Ladd (1989)
k
,_- Maximum Reduction Line Reported in Ladd (198 - '-S- Mean Reduction Line Reported in Ladd (1989)
--
.... Minimum Reduction Line Reported in Ladd (198
- Maximum Reduction from Regression by Author
-Mean - 1 SD -- - - -...
' Mean Reduction from Regression by Author -I - .
-- - - -Minimum Reduction from Regression by Author: - - - - -- ---- - -
r-Mean + 1 SD
10
AAOS
= [a',
-
a'v"]/I'vy
(%)
I I I i
I
;
.01 IU.I
II F-.-Re
,Rer I = 0 iorted in Ladd (1989) .0200 (AAOS, %)-?
-
I-20
30
AAOS =
[a', - 'v] /
C'v (%)
SI I i I I I I I It I I I I -- -- I ~- -- I ---- I - I -· -- I I (- I -.--- .---, ---, . , ,- , Ii II I I I I 1001.0
0.8
" 0.6o 0.4
0.2
0.0
-- I.Figure 2.5b: Reduction in Rate of Secondary Compression due to
Surcharge from Data Reported in Ladd (1989)
---I IA --! -7 II - I tI II I I I I -i I I I I -, , 7 , - -- ·
,,X
! v y/ ~-I,-L
I
L-l/0s9
t
Figure 2.6: Mesri's Basic Concepts of the Effects of Surcharge on Secondary Compression
00
(from Terzaghi et. al. 1996)
qj
qj
0.01
04
Oa
0ai
O
0
J
1/0'
Figure 2.7: Post-surcharge Secant Creep Index for Deposits of Soft Clay and Silt (from Terzaghi et. al. 1996)
__
o Soft Cloys
*
Or onic
Soils
00 0/00
'pr
o0
0 0 I I06
0.a
I1O
Figure 2.8: Empirical Correlation between
tltpr
at which Creep Occurs and the
Effective Surcharge R's for Soft Clays and Organic Soils (from Terzaghi et. al. 1996)
cl
00
0
/21t I