Publisher’s version / Version de l'éditeur:
Journal of the Electrochemical Society, 149, 2, 2002
READ THESE TERMS AND CONDITIONS CAREFULLY BEFORE USING THIS WEBSITE. https://nrc-publications.canada.ca/eng/copyright
Vous avez des questions? Nous pouvons vous aider. Pour communiquer directement avec un auteur, consultez la première page de la revue dans laquelle son article a été publié afin de trouver ses coordonnées. Si vous n’arrivez pas à les repérer, communiquez avec nous à PublicationsArchive-ArchivesPublications@nrc-cnrc.gc.ca.
Questions? Contact the NRC Publications Archive team at
PublicationsArchive-ArchivesPublications@nrc-cnrc.gc.ca. If you wish to email the authors directly, please see the first page of the publication for their contact information.
NRC Publications Archive
Archives des publications du CNRC
This publication could be one of several versions: author’s original, accepted manuscript or the publisher’s version. / La version de cette publication peut être l’une des suivantes : la version prépublication de l’auteur, la version acceptée du manuscrit ou la version de l’éditeur.
For the publisher’s version, please access the DOI link below./ Pour consulter la version de l’éditeur, utilisez le lien DOI ci-dessous.
https://doi.org/10.1149/1.1431962
Access and use of this website and the material on it are subject to the Terms and Conditions set forth at
In situ X-ray absorption study of a layered manganese-chromium
oxide-based cathode material
Balasubramanian, M.; McBreen, J.; Davidson, Isobel; Whitfield, P. S.;
Kargina, I.
https://publications-cnrc.canada.ca/fra/droits
L’accès à ce site Web et l’utilisation de son contenu sont assujettis aux conditions présentées dans le site LISEZ CES CONDITIONS ATTENTIVEMENT AVANT D’UTILISER CE SITE WEB.
NRC Publications Record / Notice d'Archives des publications de CNRC:
https://nrc-publications.canada.ca/eng/view/object/?id=2da01f75-3983-4cb3-b34e-086b24f0d350
https://publications-cnrc.canada.ca/fra/voir/objet/?id=2da01f75-3983-4cb3-b34e-086b24f0d350
In Situ X-Ray Absorption Study of a Layered
Manganese-Chromium Oxide-Based Cathode Material
M. Balasubramanian,a,*
,zJ. McBreen,a,
**
I. J. Davidson,b,*
P. S. Whitfield,b,*
and I. KarginaaBrookhaven National Laboratory, Materials and Chemical Sciences Division,
Department of Energy Sciences and Technology, Upton, New York 11973, USA
bInstitute for Chemical Process and Environmental Technology, National Research Council Canada,
Ottawa, Ontario, Canada
We have investigated the electronic and atomic structure of a manganese-chromium-based layered oxide material Li@Li0.2Cr0.4Mn0.4#O2during electrochemical cycling using in situ X-ray absorption spectroscopy. Our results indicate that charge
compensation in the cathode material is achieved by the oxidation/reduction of octahedral Cr~III! ions to tetrahedral Cr~VI! ions during delithiation/lithiation. Manganese ions are present predominantly in the Mn~IV! oxidation state and do not appear to actively participate in the charge compensation process. To accommodate the large changes in coordination symmetry of the Cr~III! and Cr~VI! ions, the chromium ions have to move between the regular octahedral sites in the R3¯m-like lattice to interstitial tetrahedral sites during the charge/discharge process. The highly reversible ~at least after the first charge! three-electron oxidation/ reductions and the easy mobility of the chromium between octahedral and tetrahedral sites are very unusual and interesting. Equally interesting is the fact that chromium is the active metal undergoing oxidation/reduction rather than manganese. Our results also suggest that in the local scale manganese and chromium ions are not evenly distributed in the as-prepared material, but are present in separate domains of Mn and Cr-rich regions.
© 2002 The Electrochemical Society. @DOI: 10.1149/1.1431962# All rights reserved.
Manuscript submitted May 21, 2001; revised manuscript received September 24, 2001. Available electronically January 7, 2002. Recently, rechargeable batteries with high energy and power
den-sity are in great demand as energy sources for various purposes; e.g., portable telecommunication, computer equipment, hybrid electric vehicles, etc. Rechargeable lithium batteries are the most promising candidates to fulfill such needs due to their intrinsic high discharge voltage and relatively light weight. The current commercial lithium-ion battery is based on a LiCoO2cathode and a graphitized anode.
LiCoO2is an excellent cathode material, with good capacity,
revers-ibility, and rate capability. However, due to the high cost and relative toxicity of Co there has been considerable interest in developing cathode materials based on Mn, V, or Ni.
Manganese-based systems offer significant cost savings, but sta-bilizing layered structures is hampered by the Jahn-Teller distortion exhibited by Mn~III!. Layered LiMnO2can be synthesized,1but it is
metastable and transforms to the cubic LiMn2O4spinel on cycling.
The cycling of layered LiMnO2can theoretically be stabilized by a number of cation substitutions,2but the ones that have received the
most attention are aluminum3,4and chromium.5,6Challenges remain
in developing a manganese-based system that can equal or beat LiCoO2in terms of capacity, fade, and rate capability.
Recently, it has been shown that substitution of lithium for up to about 20% of the transition metal atoms in LiCryMn12yO2-type ma-terials improves the electrochemical characteristics.7,8 The layered
structures in Li@LixCryMn12x2y#O2phases are stabilized by the
par-tial or complete oxidation of the manganese to the 14 oxidation state. In this study the changes in the atomic and electronic structure of these quaternary oxides as a function of the state-of-charge were explored by in situ X-ray absorption spectroscopy ~XAS!.
Experimental
Li@Li0.2Cr0.4Mn0.4#O2 was prepared by reacting stoichiometric
quantities of a coprecipitated double hydroxide of chromium and manganese with lithium hydroxide at 800°C for 8 h under flowing argon. The chemical composition was confirmed by atomic absorp-tion analysis. A slurry containing active material, Super S carbon black, Lonza EK15 graphite, and Kynar Flex 2801 binder in a weight ratio of 76:8.3:8.3:7.4 in n-methylpyrrolidinone was cast by
the doctor blade method onto aluminum foil. The cast was thor-oughly dried in a convection oven held at 60°C for 24 h. Disks of 0.82 in. diam punched from the cast formed the actual cathodes.
The cathodes were incorporated into a cell with a Li foil anode, a Celgard separator, and a 1 M LiPF6 electrolyte in a 1:1 ethyl
carbonate:dimethyl carbonate ~EC:DMC! solvent ~LP 30 from EM Industries, Inc.!. Current collection from the cathode and anode was made using thin strips of aluminum and copper, respectively. Mylar windows were used in the cell. The cell was assembled in an argon-filled glove box and was hermetically sealed prior to the measure-ments. The detailed design of the spectroelectrochemical cell used in the in situ XAS measurement is described elsewhere.9
The XAS experiments were performed on Beam Line X11A of the National Synchrotron Light Source ~NSLS!. A pair of Si~111! crystals was used to monochromatize the radiation. Harmonic con-tamination was suppressed by detuning the monochromator to re-duce the incident X-ray intensity by ;50%. XAS scans covering both the Cr and Mn K-edges were taken in the transmission mode while charging the cell. The incident and transmitted X-ray intensi-ties were monitored using ionization chambers filled with a mixture of helium and nitrogen gases. A third ionization chamber was used in conjunction with a Mn standard to provide internal calibration for the alignment of the edge positions.
The data were analyzed to obtain the extended X-ray absorp-tion fine structure ~EXAFS! funcabsorp-tion x~k! using established procedures.10The background below the edge jump was subtracted by a linear fit through the pre-edge region and extrapolated to the EXAFS region. The postedge background was determined using cu-bic spline procedures, which minimized the amplitude of nonphysi-cal peaks located in the low-r region of the Fourier transform ~FT!. The EXAFS data were then normalized to a per-atom basis by di-viding through the edge step height. The normalized EXAFS spectra were converted from energy to wave-vector k and weighted by k3.
The data were then Fourier transformed from k-space to r-space. The FTs are shown uncorrected for the photoelectron phase shifts; thus, distances are ;0.3 to 0.4 Å shorter than actual distances be-tween the absorber and backscattering atoms. Spurious peaks in the FTs due to spectral noise and Fourier termination effects were iden-tified by changing the k-limits of the FT.11EXAFS structural
param-eters were obtained by nonlinear least-squares analysis of the data using phase and amplitude functions generated from the FEFF 6 *Electrochemical Society Active Member.
**Electrochemical Society Fellow.
code.12A Gaussian distribution of bond distance was assumed in the
analysis. The least-squares fits were carried out in r-space using FEFFIT.13
Results and Discussion
In situ XAS during first charge to 4.8 V.—Figure 1 shows the
charging curve of a fresh cathode @18.8 mg of Li(Li0.2Cr0.4Mn0.4)O2 as active material# when charged galvanostatically for ;13 h be-tween 3.5 and 4.8 V. The total charge capacity was 4.58 mAh. A total of 30 scans was taken during charge. The charging was com-plete during the middle of scan 30. Each scan took ;26 min. Scan numbers, corresponding to representative XAS scans, are marked on the charging curve. The Cr edge data was collected in first half of each scan region, while the Mn edge data was collected in the sec-ond half. Thus, during the data collection time for each edge the change in Li content is ;1.7% of the total Li deintercalated.
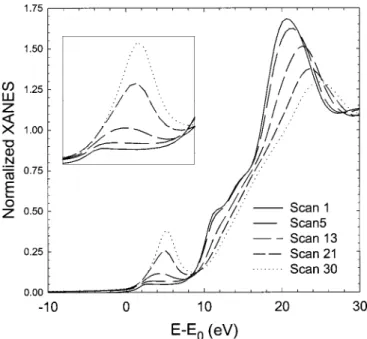
Figure 2 shows the Cr K-edge XANES for representative scans taken during first charge. It can be seen that the edge position shifts
to higher energy values as the extent of delithiation increases. Also, the shape of the overall near-edge spectra changes systematically. In particular, the pre-edge peak, shown enlarged in the inset of Fig. 2, increases in intensity as the charging progresses. In an earlier ex situ XAS study, Ammundsen et al. have shown that Cr in a similar fresh cathode material is present as Cr~III! by comparing the Cr XANES with LiCrO2.14The positive shift in edge position seen in Fig. 2
suggests that the average oxidation state of chromium increases on charging. In the case of Cr, in addition to the usual edge shift, spectral details in the pre-edge region provide valuable information regarding the oxidation state of the Cr absorbers. Often, Cr occurs as Cr~III! or Cr~VI! ions in its oxygen-based compounds. Cr~VI! tends to occur in tetrahedral coordination with oxygen while Cr~III! tends to occur in octahedral coordination. The XANES spectra of Cr~VI! compounds exhibit a prominent pre-edge feature that is attributed to a bound 1s → 3d transition.15-18This transition is forbidden in
oc-tahedral Cr(III)O6 coordination, which has a center of inversion symmetry, but is allowed for noncentrosymmetric tetrahedral Cr(VI)O4coordination due to the mixing of Cr~3d! with O~2p!. This
mixing, in combination with the empty d-orbital ~3d0configuration!
of tetrahedral Cr~VI! ions, increases the probability of the 1s → 3 d transition, resulting in a 20-fold increase in the intensity of the pre-edge peak relative to octahedral Cr~III!. The presence of significant pre-edge peak in Fig. 2 clearly indicates that Cr~III! is converted to Cr~VI! on delithiation. On the basis of the pre-edge peak intensity and using the calibration curves reported by others,16-18 we estimate that close to the end of charge ~scan 30!
;37~8!% of the Cr ions in the sample are present as tetrahedral Cr~VI!. Thus, a significant portion of the charge compensation can be ascribed to the oxidation of octahedral Cr~III! to Cr~VI! on delithiation.
Figure 3 shows the Mn K-edge XANES for representative scans taken during first charge. In the case of Mn, Ammundsen et al. have earlier shown that in a similar fresh cathode material the Mn edge position coincides with that of Li2MnO3, indicating that the Mn is
present to a large extent as Mn~IV! in the sample.14It can be seen in Fig. 3 that on charging the Mn edge shows some changes in the shape of the edge but does not show a rigid shift of the entire edge to higher energy values. The shape of the near-edge spectra is de-termined not only by the electronic structure of the Mn ion but also by backscattering processes ~single as well as multiple scattering! that the ejected photoelectron undergoes during X-ray absorption. Figure 1. Voltage profile of the cell during first charge. Representative scans
of the XAS measurements are indicated. The vertical marks on the curve indicate the various scan regions.
Figure 2. Cr K-edge XANES spectra during first charge. The inset shows an expanded view of the pre-edge peak region.
Figure 3. Mn K-edge XANES spectra during first charge.
For comparison, in Fig. 4 we show the in situ Mn XANES spectra of spinel LixMn2O4during charging in the 4 V plateau. It can be seen that the entire Mn edge shifts rigidly to higher energy values, con-sistent with the increase in the average oxidation state of Mn in LixMn2O4. No such rigid shift is seen in the case of the Cr-Mn-based cathode material. We ascribe the changes in the shape of the Mn edge in Fig. 3 to possible rearrangement of the Mn local struc-ture with no significant change in oxidation state of the Mn ions.
Figures 5 and 6 show representative scans of the Cr and Mn x~k! spectra obtained during first charge. It can be seen that the Cr EX-AFS changes drastically with the amplitude of the EXEX-AFS spectra diminishing throughout the entire k-range, on charging. In contrast, the change in EXAFS spectra of the Mn absorbers is relatively small. These observations suggest that there are large local structural
changes around the Cr ions but only relatively minor changes around the Mn ions on delithiation. From the XANES data we know that Cr~III! is converted to Cr~VI! on charge. The Cr~VI!-O bond distance is ;1.65 Å in tetrahedrally coordinated Cr~VI! compounds. In contrast, the Cr~III!-O bond distance is ;1.98 Å in octahedrally coordinated Cr~III! compounds.15-18Due to this distinct difference
in the bond distances, it turns out that the electronic waves from the Cr~III!-O and Cr~VI!-O pairs ~which contribute to the overall EX-AFS signal! are out of phase for a significant portion of the k-range of the signal.18This, to a large extent, accounts for the loss in Cr
EXAFS amplitude on delithiation. Details of the exact nature of the cancellation of the signal can be determined by analysis of the EX-AFS data.
Figures 7 and 8 show the FT of representative EXAFS scans at Figure 4. K-edge XANES of Mn absorbers in spinel LixMn2O4 (x
5 0-1).
Figure 5. EXAFS x~k! spectra for Cr absorbers during first charge.
Figure 6. EXAFS x~k! spectra for Mn absorbers during first charge.
Figure 7. k3-weighted Fourier transform for Cr absorbers during first charge; the arrow points to the peak at ;5.6 Å which is ascribed to focusing effect.
the Cr and Mn edges. The first peak at ;1.5 Å in both the figures is due to Cr-O or Mn-O correlations. It can be seen that on delithiation the intensity of the Cr-O correlation decreases rapidly, while that of the Mn-O correlation does not change much. This reduction in the Cr-O peak intensity is due to the conversion of Cr~III! to Cr~VI! on delithiation. The second peak at ;2.5 Å is due to Cr-metal or Mn-metal interaction. It should be noted that as Cr and Mn are near neighbors in the periodic table, these two elements have similar backscattering properties and hence cannot be distinguished by EX-AFS spectroscopy. However, the similarity in the backscattering properties allows one to use either Mn or Cr to represent the metal backscatter, without significantly affecting the EXAFS structural pa-rameters that can be determined by detailed fits of the data. In this study the metal backscatter is represented by using Mn backscatter-ing amplitude and phase functions.
Quantitative analysis to obtain EXAFS structural parameters of both Cr and Mn was performed by fitting the first two peaks of the FT. In the case of Cr, we find that the local structure of the fresh starting material can be well represented by six oxygen atoms at
;1.97 Å and six metal atoms at ;2.89 Å. The Cr-O bond distance of ;1.97 Å is consistent with what is expected for a Cr~III!-O bond. The presence of six metal atoms at ;2.89 Å is also in good agree-ment with what is expected for Cr occupying octahedral sites in the hexagonal ~R3¯m-like! lattice.19The Cr-metal distance corresponds
well with the hexagonal ‘‘a’’ lattice parameter of 2.88 Å seen by X-ray diffraction ~XRD!. On charging, it can be seen from Table I that from scans 1 to 11 there is a trend showing a small reduction in the coordination number of both oxygen and metal shells. As men-tioned earlier, the contribution from Cr~VI!-O and Cr~III!-O corre-lations would tend to cancel each other, giving rise to an apparent reduction in the coordination number of the oxygen shell. Further, Cr~VI! atoms are tetrahedrally coordinated and therefore have to move out of the regular octahedral lattice sites, creating vacancies. The presence of these vacancies leads to a reduction in the average second shell metal coordination number around Cr. The smallest splitting dR in two close-by ~similar! shells that can be resolved by EXAFS is given by dR ' p/2kmax, where kmaxis maximum pho-toelectron wavenumber available in the experiment. In the present case, kmaxis ;12 Å21. This amounts to a spatial resolution of ;0.13
Å. Thus, Cr~VI!-O and Cr~III!-O bond distance can easily be re-solved in the experiment. During scans 1-12 less than 10% of the Cr is oxidized to Cr~VI!. This conclusion is obtained by inspecting the pre-edge peak intensity in the XANES data ~Fig. 2! and by noting the reduction in the average coordination number of the Cr-O cor-relation. Also, due to the small amount of Cr~VI! present during scans 1-12 the EXAFS signal from the Cr~VI!-O correlations is relatively small and cannot be explicitly accounted for.
During scans 13-30 the relative amount of Cr~VI! increases and the contribution of the Cr~VI!-O bond to the EXAFS becomes clear and well defined. Therefore, for scans 13-30 the contributions from Cr in octahedral and tetrahedral sites were explicitly included. The EXAFS data is bandwidth-limited. The number of free parameters
Nfthat can be floated in a fit is given by Nf'(2DkDR)/p, where Dk and DR are the k- and R-space window widths.20Also, the information content in the EXAFS data is equally spread in R-space. Care must be taken not to utilize the free data points from neighbor-ing peaks of the FT in determinneighbor-ing the structural content of a given peak. Adhering to these requirements, the Cr EXAFS from scans 13-30 were modeled by fitting the first two peaks of the FT to contributions from Cr in octahedral and tetrahedral sites. In the ini-tial fits the coordination number of the Cr-metal shell was not con-strained. However, it was seen that there was a direct correlation between the number of Cr~III!-O bonds and the number of Cr-metal bonds. Further, any contribution from a possible Cr~VI!-metal cor-relation was negligible. This suggested that the decrease in the metal coordination number is intimately connected only with the relative Figure 8. k3-weighted Fourier transform for Mn absorbers during first
charge; the arrow points to the peak at ;5.6 Å which is ascribed to focusing effect.
Table I. Structural parameters from nonlinear least-squares fits to the first two peaks of the Fourier transform at the Cr-edge for scans 1-12 during first charge.a
Scan no. Shell N R ~Å! s2(1023Å2) DE0~eV! R-factor
1 Cr-O 6.2 ~1.0! 1.972 ~8! 3.60 ~1.56! 11.49 ~1.45! 0.009 Cr-Mn/Cr 5.7 ~1.3! 2.888 ~9! 4.65 ~1.63! 3 Cr-O 6.1 ~1.0! 1.970 ~8! 4.02 ~1.64! 11.38 ~1.46! 0.010 Cr-Mn/Cr 5.5 ~1.2! 2.886 ~9! 4.69 ~1.63! 5 Cr-O 5.9 ~1.1! 1.968 ~9! 4.17 ~1.81! 11.57 ~1.57! 0.011 Cr-Mn/Cr 5.5 ~1.3! 2.885 ~10! 4.89 ~1.75! 7 Cr-O 5.6 ~1.1! 1.967 ~11! 4.35 ~1.95! 11.95 ~1.67! 0.013 Cr-Mn/Cr 5.6 ~1.4! 2.889 ~11! 5.63 ~1.93! 9 Cr-O 5.5 ~1.1! 1.959 ~10! 5.62 ~2.00! 11.65 ~1.56! 0.012 Cr-Mn/Cr 5.4 ~1.3! 2.885 ~10! 5.83 ~1.75! 11 Cr-O 5.4 ~1.1! 1.959 ~10! 6.41 ~2.23! 11.52 ~1.65! 0.013 Cr-Mn/Cr 5.4 ~1.3! 2.885 ~10! 6.69 ~1.89! a
The bond distance R, disorder s2, coordination number N, and inner potential shift parameter DE0are tabulated. The value of the R-factor, which is a measure of the goodness of the fit, is also tabulated. The number in the parenthesis is the uncertainty in the last digit or digits of the parameter, determined using the procedure described in Ref. 13.
amount of octahedrally coordinated Cr~III!. Thus, in the final fits the coordination number of the Cr~III!-O bond and that of the Cr-metal bond were constrained to be the same. This constraint accurately accounts for the reduction in the metal coordination number due to the formation of vacancies created by the movement of Cr~VI! ions away from regular octahedral sites. In addition, to minimize the correlation between coordination number and disorder, the disorder parameter of the Cr~VI!-O and Cr~III!-O correlation were con-strained to be equal. Also, a single inner potential shift parameter DE0 was found to be sufficient to represent both the oxygen and metal shell of atoms.
The structural parameters that we obtained for scans 13-30 using this fitting procedure are given in Table II. A representative fit to experimental data is shown in Fig. 9. It can be seen from Table II that from scans 13 to 30 the amount of tetrahedral Cr increases from ;8 to ;43%. The presence of 43% tetrahedral Cr is also consistent with the value obtained from the XANES pre-edge peak intensity. The tetrahedral Cr-O bond distance of ;1.64 Å is in agreement with those found in Cr~VI! compounds.15-18The analysis clearly shows
that the reduction in the intensity of the second peak of the FT ~Cr-metal correlation! on delithiation is due to the migration of Cr ions from regular octahedral sites to tetrahedral sites. It can be seen from both Tables I and II that on delithiation the disorder of Cr-O as well as Cr-metal correlations increases significantly. For scans 1-12, it is tempting to attribute this increased disorder to different bond lengths of the tetrahedral and octahedral Cr-O pairs. However, it can be seen from Table II that even after accounting for the two different sites, the structural disorder is still significantly larger than that seen for the fresh cathode material. It is conceivable that the increased disorder represents a ‘‘true’’ increase in the static disorder of the bonds and might be due to the strain imposed on the structure by the formation of vacancies.
Unlike the case of Cr, we found that the first two peaks in the FT of Mn can always be well represented by a single Mn-O distance and a single Mn-metal distance. The structural parameters obtained by the two-shell analysis are given in Table III. We find that for all
states of charge the first shell contains ;6 Mn-O bonds at ;1.89 Å and ;4 Mn-metal bonds at ;2.87 Å. The Mn-O distance of ;1.89 Å is in agreement with what is expected for a Mn~IV!-O bond.21
Also, the disorder of the Mn-O pairs is comparable to that seen around Cr in the fresh cathode material. The presence of Mn~III! would tend to increase the overall disorder of the Mn-O bond due to the large local Jahn-Teller distortion expected for Mn~III!. The
ab-Figure 9. A representative R-space fit ~scan 21! of the first two peaks of the Fourier transform for Cr absorbers during first charge. The arrows indicate the r-range over which the fit was performed.
Table II. Structural parameters from nonlinear least-squares fits to the first two peaks of the Fourier transform at the Cr-edge for scans 13-30 during first charge.a
Scan no. Shell
Cr in octahedral sites ~%! Cr in tetrahedral sites ~%! Distance~Å! Disorder
(1023Å2) DE0~eV! R-factor
13 Cr~III!-O 92 ~6! 1.945 ~9! 6.99 ~1.05! 11.3 ~1.3! 0.011 Cr~VI!-O 8 ~6! 1.634 ~65! 6.99 ~1.05! Cr-Mn/Cr 92 ~6! 2.884 ~9! 7.56 ~0.70! 15 Cr~III!-O 87 ~5! 1.940 ~9! 6.88 ~1.17! 11.0 ~1.6! 0.009 Cr~VI!-O 13 ~5! 1.632 ~53! 6.88 ~1.17! Cr-Mn/Cr 87 ~5! 2.882 ~10! 7.67 ~0.74! 17 Cr~III!-O 82 ~3! 1.943 ~8! 7.44 ~0.89! 11.8 ~1.2! 0.006 Cr~VI!-O 18 ~3! 1.637 ~27! 7.44 ~0.89! Cr-Mn/Cr 82 ~3! 2.890 ~9! 8.46 ~0.59! 19 Cr~III!-O 79 ~3! 1.941 ~8! 8.13 ~0.86! 12.1 ~1.2! 0.006 Cr~VI!-O 21 ~3! 1.633 ~22! 8.13 ~0.86! Cr-Mn/Cr 79 ~3! 2.895 ~9! 9.35 ~0.61! 21 Cr~III!-O 72 ~2! 1.940 ~6! 8.56 ~0.59! 12.4 ~1.0! 0.004 Cr~VI!-O 28 ~2! 1.630 ~1! 8.56 ~0.59! Cr-Mn/Cr 72 ~2! 2.900 ~7! 9.97 ~0.48! 23 Cr~III!-O 67 ~3! 1.939 ~9! 9.17 ~0.88! 12.6 ~1.4! 0.009 Cr~VI!-O 33 ~3! 1.623 ~13! 9.17 ~0.88! Cr-Mn/Cr 67 ~3! 2.902 ~12! 11.3 ~0.9! 27 Cr~III!-O 58 ~3! 1.953 ~11! 8.03 ~0.70! 14.2 ~1.8! 0.014 Cr~VI!-O 42 ~3! 1.639 ~16! 8.03 ~0.70! Cr-Mn/Cr 58 ~3! 2.918 ~9! 11.7 ~1.3! 30 Cr~III!-O 57 ~3! 1.951 ~11! 7.39 ~0.75! 14.8 ~1.9! 0.015 Cr~VI!-O 43 ~3! 1.636 ~16! 7.39 ~0.75! Cr-Mn/Cr 57 ~3! 2.919 ~9! 12.0 ~1.2! a
A model based on Cr ions occupying either octahedral or tetrahedral sites was used in the analysis. The bond distance R, disorder s2, inner potential shift parameter DE0, and the R-factor of the fit are tabulated. The number in the parenthesis is the uncertainty in the last digit or digits of the parameter.
sence of a significant increase in the disorder around Mn in the sample suggests that the amount of Mn~III!, if any, is minimal. The Mn-metal correlation at ;2.87 Å is consistent with the hexagonal ‘‘a’’ lattice parameter seen in XRD.19 However, note that for all
states of charge there appears to be only ;4 Mn-metal correlations. In the case of Cr, the fresh cathode material had ;6 Cr-metal cor-relations. This reduction in Mn-metal correlation suggests that the second shell around Mn contains either vacancies or Li ions. Li is a very weak backscatter and cannot be clearly seen by EXAFS spec-troscopy. As the sample is Li-rich, it is conceivable that the extra Li is clustered preferentially around the Mn atoms. Also, we point out that there is no change in the number of Mn-metal bonds on delithia-tion. In the case of Cr the number of Cr-metal bonds decreases significantly on delithiation ~Table II!. The relative step heights at the Mn and Cr K-edges confirms that the ratio of Cr to Mn in the sample is ;1.00~5!. If Cr and Mn are randomly distributed in the hexagonal lattice, each metal atom ~irrespective of whether it is Mn or Cr!, on an average, will be surrounded by an equal number of Cr and Mn neighbors. On delithiation, some of the Cr migrates to tet-rahedral sites. This should cause a reduction in the number of metal-metal correlations around both Cr as well as Mn. However, as pointed out earlier, no reduction in the number of Mn-metal corre-lation is seen on delithiation. These observations strongly suggest that on a local atomic scale Cr and Mn are not randomly distributed. The sample contains separate domains of Cr and Mn-rich regions.
Additional evidence for the presence of separate Cr- and Mn-rich domains can be obtained by a careful inspection of the peaks at higher R in the FTs shown in Fig. 7 and 8. For both Cr and Mn in the fresh cathode material a peak occurs at ;5.6 Å ~indicated by arrows in the FTs!. The intensity of this peak is much larger for Cr than for Mn. This peak is seen in several 3d transition metal oxides with hexagonal layered structure and arises from a three-body cor-relation ~often referred to as focusing effect! involving the coherent linear chains of edge-sharing transition-metal octahedra.14,15,22,23
The intensity of the peak is maximum when the dihedral angle
in-volved in the probe-metal-metal bond is 180°. Deviations from colinearity due to local distortion ~say, due to presence of Li in the metal sites! or broken chains ~caused by vacancies! lead to a drastic reduction in the peak height. The lower intensity of the peak at ;5.6 Å in the case of Mn is in accordance with the presence of Li or vacancies in the second shell of Mn. Further, it can be seen that there is a rather drastic collapse of this peak in Cr on delithiation. This collapse occurs due to the introduction of vacancies and in-creased disorder around the probed Cr ions on delithiation.
It can also be seen in Fig. 8 that close to the end of charge ~scan 30! the intensity of the first peak is diminished. This diminution manifests itself as a reduction in the Mn-O coordination in scans close to the end of charge ~Table III!. Due to the correlation between disorder and coordination number it is not clear if this reduction in coordination number is a real effect or if it is just a numerical arti-fact of the analysis. However, we note that electrochemical measure-ments show that the cyclability of the material is degraded when the material is charged to voltage higher than 4.5 V ~vs. Li!. The re-duced coordination number at high voltages might play a role in the poorer cyclability of the material.
In situ XAS during first discharge and second charge.—To un-derstand the reversibility of the redox process, further in situ mea-surements were performed during first discharge and second charge. A fresh cathode ~13.68 mg of Li@Li0.2Cr0.4Mn0.4#O2as active mass!
was again incorporated into the spectroelectrochemical cell, and the first charge to 4.5 V was carried out off-line at a C/12 rate. The cathode material came from a separate batch prepared in an identical manner to the first. The chemical composition was confirmed by atomic absorption analysis. After ;6 h of rest at a high state-of-charge, the cell was mounted on-line and the cathode was dis-charged to 2.5 V ~first discharge!. The sample was then dis-charged again ~second charge! to 4.5 V after rest at the discharged state for ;25 min. XAS measurements were performed during the cycling
Table III. Structural parameters from nonlinear least-squares fits to the first two peaks of the Fourier transform at the Mn-edge for scans 1-30
during first charge.a
Scan no. Shell Number ofneighbors Distance ~Å!
Disorder ~x 1023Å2! DE 0~eV! R-factor 1 Mn-O 6.1 ~7! 1.894 ~7! 4.55 ~1.06! 10.6 ~1.2! 0.005 Mn-Mn/Cr 3.9 ~7! 2.873 ~7! 3.62 ~1.22! 3 Mn-O 6.0 ~7! 1.892 ~7! 4.19 ~1.07! 10.6 ~1.2! 0.005 Mn-Mn/Cr 3.8 ~7! 2.872 ~8! 3.28 ~1.26! 5 Mn-O 6.3 ~9! 1.891 ~7! 4.81 ~1.41! 10.5 ~1.6! 0.008 Mn-Mn/Cr 3.7 ~9! 2.867 ~7! 3.22 ~1.59! 7 Mn-O 6.1 ~8! 1.891 ~8! 4.46 ~1.30! 10.9 ~1.5! 0.008 Mn-Mn/Cr 4.1 ~9! 2.869 ~9! 4.17 ~1.62! 9 Mn-O 6.1 ~7! 1.890 ~7! 4.20 ~1.12! 10.9 ~1.3! 0.006 Mn-Mn/Cr 4.1 ~8! 2.865 ~8! 4.30 ~1.45! 11 Mn-O 6.2 ~9! 1.893 ~9! 4.43 ~1.40! 11.2 ~1.6! 0.009 Mn-Mn/Cr 4.0 ~9! 2.865 ~10! 3.97 ~1.75! 15 Mn-O 6.2 ~9! 1.887 ~9! 4.53 ~1.47! 10.6 ~1.7! 0.01 Mn-Mn/Cr 3.9 ~1.0! 2.861 ~10! 4.14 ~1.80! 17 Mn-O 6.1 ~1.0! 1.889 ~9! 4.82 ~1.68! 10.7 ~1.9! 0.013 Mn-Mn/Cr 4.0 ~1.2! 2.865 ~10! 4.78 ~2.24! 19 Mn-O 6.3 ~1.0! 1.886 ~9! 5.67 ~1.60! 10.0 ~1.8! 0.011 Mn-Mn/Cr 4.2 ~1.2! 2.858 ~10! 6.02 ~2.19! 21 Mn-O 5.6 ~8! 1.892 ~9! 4.4 ~1.40! 11.2 ~1.7! 0.010 Mn-Mn/Cr 4.1 ~1.2! 2.869 ~10! 6.25 ~2.22! 23 Mn-O 5.6 ~8! 1.892 ~9! 4.4 ~1.40! 11.2 ~1.7! 0.010 Mn-Mn/Cr 4.1 ~1.2! 2.869 ~10! 6.25 ~2.22! 27 Mn-O 5.2 ~6! 1.888 ~7! 5.04 ~1.10! 10.6 ~1.3! 0.006 Mn-Mn/Cr 4.4 ~1.0! 2.870 ~7! 8.65 ~2.02! 30 Mn-O 5.3 ~4! 1.879 ~4! 4.69 ~0.57! 9.5 ~1.0! 0.002 Mn-Mn/Cr 4.4 ~6! 2.863 ~6! 8.45 ~1.07!
aThe bond distance R, disorder s2, coordination number N, inner potential shift parameter DE
0, and the R-factor of the fit are tabulated. The number in
the parenthesis is the uncertainty in the last digit or digits of the parameter.
process. The cycling curve during first discharge and second charge is shown in Fig. 10. Representative scans are marked on the cycling curve.
Figure 11 shows the Cr XANES during the first discharge. It can be seen that at the start of discharge ~scan A!, a large pre-edge peak is present. This shows that significant portions of the Cr ions are present in tetrahedral sites. On discharge, the intensity of the pedge peak decreases progressively. This suggests that Cr~VI! is re-duced to Cr~III!. However, even at the end of discharge ~scan D! the intensity of the pre-edge peak is not as small as what is seen for the fresh cathode material ~Fig. 2!. This shows that when discharged at the C/10 rate to 2.5 V, not all Cr~VI! ions are converted to Cr~III!. On the basis of the pre-edge peak intensity, it appears that ;15~8!% Cr is still present as Cr~VI! ions.
Figure 12 shows the Mn edge XANES obtained during first dis-charge. As in the case of the first charge ~Fig. 3!, the entire edge Figure 10. Voltage profile of the cell during first discharge and second
charge. Representative scans of the XAS measurements are indicated. The vertical marks on the curve indicate the various scan regions.
Figure 11. Cr K-edge XANES spectra during first discharge. The inset shows an expanded view of the pre-edge peak region.
Figure 12. Mn K-edge XANES spectra during first discharge.
Figure 13. Cr K-edge XANES spectra during second discharge. The inset shows an expanded view of the pre-edge peak region.
does not shift rigidly on lithiation. We therefore ascribe the changes in the shape of the XANES to possible local rearrangement around the Mn ions, without much change in the Mn oxidation state. How-ever, the changes in the shape of Mn-edge between first charge and first discharge are not completely identical. This suggests that the local structural rearrangement around the Mn ions on discharge is not identical to that seen during first charge. Therefore, we come to the conclusion that the local structural changes endured during first charge are not completely reversible.
Figure 13 shows the Cr edge XANES during the second charge. It can be seen that the amount of Cr~VI! increases during the second charge as expected. At the end of the second charge, the intensity of the pre-edge peak ~scan G! becomes almost the same as that found
at the beginning of the first discharge ~scan A, Fig. 11!. This indi-cates that almost all the tetrahedral Cr~VI! that was reduced to oc-tahedral Cr~III! during first discharge was recovered during the sec-ond charge. Thus, the redox behavior of Cr during first discharge and second charge is highly reversible. Figure 14 shows the Mn XANES taken during the second charge. It can be seen that the changes in the shape of the Mn XANES is similar to that seen during the first discharge ~Fig. 12!. Thus, the XANES data strongly suggests that both the redox behavior and local structural changes are highly reversible after the first charge.
Figure 14. Mn K-edge XANES spectra during second discharge.
Figure 15. k3-weighted Fourier transform for Cr absorbers during first dis-charge and second dis-charge. Three representative scans are plotted.
Table IV. Structural parameters from nonlinear least-squares fits to the first two peaks of the Fourier transform at the Cr-edge for selected scans during first discharge and second charge.a
Scan no. Shell
Cr in octahedral
sites ~%!
Cr in tetrahedral
sites ~%! R ~Å! s2(1023Å2) DE0~eV! R-factor
A Cr~III!-O 61 ~2! 1.974 ~8! 7.90 ~0.64! 12.3 ~1.4! 0.008 Cr~VI!-O 39 ~2! 1.659 ~8! 7.90 ~0.64! Cr-Mn/Cr 61 ~2! 2.929 ~10! 10.7 ~0.71! B Cr~III!-O 73 ~4! 1.981 ~10! 6.67 ~0.95! 10.9 ~1.9! 0.013 Cr~VI!-O 27 ~4! 1.666 ~20! 6.67 ~0.95! Cr-Mn/Cr 73 ~4! 2.924 ~14! 9.39 ~0.94! C Cr~III!-O 82 ~5! 1.989 ~12! 5.68 ~1.28! 10.1 ~2.1! 0.016 Cr~VI!-O 18 ~5! 1.705 ~46! 5.68 ~1.28! Cr-Mn/Cr 82 ~5! 2.926 ~15! 8.37 ~1.00! D Cr~III!-O 87 ~7! 1.992 ~14! 5.55 ~1.78! 9.9 ~2.5! 0.021 Cr~VI!-O 13 ~7! 1.725 ~97! 5.55 ~1.78! Cr-Mn/Cr 87 ~7! 2.931 ~18! 8.57 ~1.22! E Cr~III!-O 83 ~6! 1.978 ~12! 5.31 ~1.50! 9.2 ~2.2! 0.017 Cr~VI!-O 17 ~6! 1.715 ~58! 5.31 ~1.50! Cr-Mn/Cr 83 ~6! 2.915 ~15! 8.00 ~1.01! F Cr~III!-O 75 ~5! 1.972 ~13! 7.67 ~1.31! 10.1 ~2.2! 0.018 Cr~VI!-O 25 ~5! 1.661 ~28! 7.67 ~1.31! Cr-Mn/Cr 75 ~5! 2.915 ~16! 9.58 ~1.09! G Cr~III!-O 64 ~3! 1.981 ~11! 8.84 ~0.99! 12.9 ~1.9! 0.014 Cr~VI!-O 36 ~3! 1.655 ~14! 8.84 ~0.99! Cr-Mn/Cr 64 ~3! 2.934 ~15! 11.3 ~1.03! a
A model based on Cr ions occupying either octahedral or tetrahedral sites was used in the analysis. The bond distance R, disorder s2, inner potential shift parameter DE0, and R-factor are tabulated. The number in the parenthesis is the uncertainty in the last digit or digits of the parameter.
The findings of the EXAFS data analysis are also in agreement with the results of the XANES data. The Mn EXAFS data taken during first discharge and second charge shows that for all states of charge Mn ions are surrounded by ca. six oxygen and four metal neighbors. Apart from a slight increase in the disorder, the structural parameters obtained for the Mn data during the first discharge and second charge are very similar to that seen during first charge ~Table III!. In contrast to the Mn EXAFS, the Cr-edge EXAFS shows large changes ~consistent with redox behavior of Cr ions in this system!. Figure 15 shows the FT of Cr EXAFS taken during the first dis-charge and second dis-charge. It can be seen that at the start of the first discharge ~scan A!, the peak height of both the Cr-O and Cr-metal interactions are small as expected. At the end of discharge ~scan D!, the intensity of the peaks representing the Cr-O interaction as well as the Cr-metal interaction increases significantly. This suggests that the Cr~VI! ions on reduction to Cr~III! migrate back to regular oc-tahedral sites on the R3¯m-like lattice. It is remarkable that the Cr ions can move back and forth between octahedral and tetrahedral sites during the charge/discharge process. The remarkable nature of the redox process is further exemplified during the second charge. Close to the end of the second charge the peak heights of the Cr-O and Cr-metal interactions ~scan G! again diminish, consistent with the movement of Cr ions from octahedral to tetrahedral sites. Table IV shows the structural parameters obtained by the analysis of the EXAFS data during first discharge and second charge. It can be seen that at the start of first discharge ;39~2!% of Cr occupies tetrahedral sites. At the end of first discharge, the amount of tetrahedral Cr~VI! ions decreases. However, note that a fraction of Cr ions @;13~7!%# are still in the Cr~VI! state. This is consistent with the results of the Cr XANES spectra. At the end of second charge, ;36~3!% of the Cr again occupies tetrahedral sites as Cr~VI! ions; similar to that seen at the start of first discharge. This indicates that the redox behavior and local structural changes during the first discharge and second charge are highly reversible.
Conclusion
We have investigated the evolution of the local electronic and atomic structure of a Mn-Cr-based layered cathode material using in
situCr and Mn K-edge XAS measurements during electrochemical delithiation/lithiation. We have measured the changes in the coordi-nation numbers, bond distances, and local disorder as a function of the state-of-charge of the material. The XAS measurements show that during the first charge, charge compensation is largely achieved by the conversion of Cr~III! to Cr~VI!. This conversion leads to the migration of Cr from regular octahedral sites in the R3¯m-like lattice to tetrahedral sites, leaving behind vacancies at the octahedral sites. In strong contrast, apart from a possible subtle local rearrangement of the structure, Mn ions do not seem to actively participate in the charge compensation. Our results also indicate that on a local scale separate domains of Cr- and Mn-rich regions are present in the material. Further, the excess Li ions ~in the fresh cathode material! appear to be clustered preferentially about Mn.
During the first discharge, most of the Cr~VI! ions are reduced to Cr~III!. However, a small amount of Cr~VI! is present even after discharge to 2.5 V ~at ;C/10 rate!. Our Cr and Mn XAS results show that the structural changes associated with the first charge are not completely reversed during first discharge. During the second charge, changes in the local structure and oxidation states of the transition metal atoms are in accordance with the results found dur-ing first discharge. At the end of the second charge, the amount of Cr~VI! present in the sample is almost identical to that found at the beginning of the first discharge. These results indicate that changes
in the structure are much more reversible after the first charge. The finding that Cr, to a large extent, is the active metal under-going oxidation/reduction rather than Mn is very interesting and unusual. Equally interesting are the high reversibility ~at least after first charge! of the three-electron oxidation/reduction process and the unhindered mobility of Cr between octahedral and tetrahedral sites. The element-specific nature of the XAS technique and its sen-sitivity to two and three-body correlations make it an ideal tool to complement the results of conventional diffraction techniques. The value of local probes ~such as XAS! in obtaining structural and electronic information, on such complex and important materials, is aptly demonstrated by this study.
Acknowledgments
The authors thank Steven Argue and Yves Grincourt for the chemical analyses and preparation of the electrodes, respectively. The XAS work was supported by the Assistant Secretary for Energy Efficiency and Renewable Energy, Office of Advanced Automotive Technologies, and the Division of Materials Science, Office of Sci-ence, U.S. Department of Energy ~DOE! under contract no. DE-AC02-98CH10886. The work was done under the auspices of the Batteries for Advanced Transportation Technologies Program.
Brookhaven National Laboratory assisted in meeting the publication costs of this article.
References
1. A. R. Armstrong and P. G. Bruce, Nature, 381, 499 ~1999!.
2. G. Ceder and S. K. Mishra, Electrochem. Solid-State Lett., 2, 550 ~1999!. 3. Y.-I. Jang, B. Huang, Y.-M. Chiang, and D. R. Sadoway, Electrochem. Solid-State
Lett., 1, 13 ~1998!.
4. Y.-M. Chiang, D. R. Sadoway, Y.-I. Jang, B. Huang, and H. Wang, Electrochem.
Solid-State Lett., 2, 107 ~1999!.
5. I. J. Davidson, R. S. McMillan, H. Slegr, B. Luan, I. Kargina, J. J. Murray, and I. P. Swainson, J. Power Sources, 81-82, 406 ~1998!.
6. J. R. Dahn, T. Zheng, and C. L. Thomas, J. Electrochem. Soc., 145, 851 ~1998!. 7. C. Storey, I. Kargina, Y. Grincourt, I. J. Davidson, Y. Yoo, and D. Y. Seung,
Abstract 234, 10th International Meeting on Lithium Batteries, Como, Italy, May 28-June 2, 2000.
8. J. Cho and B. Park, Electrochem. Solid-State Lett., 3, 355 ~2000!.
9. M. Balasubramanian, X. Sun, X. Q. Yang, and J. McBreen, J. Power Sources, 92, 1 ~2001!.
10. D. E. Sayers and B. A. Bunker, X-Ray Absorption: Principles, Application,
Tech-niques of EXAFS, SEXAFS and XANES, Chap. 6, D. C. Koningsberger and R. Prins, Editors, Wiley, New York ~1988!.
11. F. W. Lytle, Applications of Synchrotron Radiation, Gordon and Breach, New York ~1989!.
12. S. I. Zabinsky, J. J. Rehr, A. Ankudinov, and M. J. Eller, Phys. Rev. B, 52, 2995 ~1995!.
13. E. A. Stern, M. Newville, B. Ravel, Y. Yacoby, and D. Haskel, Physica B, 208 &
209, 117 ~1995!.
14. B. Ammundsen, J. Paulsen, I. Davidson, and Ru-Shi Liu, J. Electrochem. Soc., To be published.
15. M. Balasubramanian and C. A. Melendres, J. Synchrotron Radiat., 6, 594 ~1999!. 16. M. L. Peterson, G. E. Brown, G. A. Parks, and C. L. Stein, Geochim. Cosmochim.
Acta, 61, 3399 ~1997!.
17. A. J. Davenport, H. S. Isaa¨cs, G. S. Frankel, A. G. Schrott, C. V. Jahnes, and M. A. Russak, J. Electrochem. Soc., 138, 338 ~1991!.
18. A. Manceau and L. Charlet, J. Colloid Interface Sci., 148, 425 ~1992!. 19. P. S. Whitfield, I. J. Davidson, I. Kargina, Y. Grincourt, B. Ammundsen, J.
McBreen, and M. Balasubramanian, in Rechargeable Lithium Batteries, M. Doyle, E. Takeuchi, and K. M. Abraham, Editors, PV 2000-21, p. 106, The Electrochemi-cal Society Proceedings Series, Pennington, NJ, In press.
20. E. A. Stern, Phys. Rev. B, 48, 9825 ~1993!.
21. B. Ammundsen, D. J. Jones, J. Roziere, and F. Villain, J. Phys. Chem. B, 102, 7939 ~1998!.
22. P. A. O’Day, J. J. Rehr, S. I. Zabinsky, and G. E. Brown, J. Am. Chem. Soc., 116, 2938 ~1994!.
23. K. I. Pandya, W. E. O’Grady, D. A. Corrigan, J. McBreen, and R. W. Hoffman, J.