Publisher’s version / Version de l'éditeur:
Vous avez des questions? Nous pouvons vous aider. Pour communiquer directement avec un auteur, consultez la première page de la revue dans laquelle son article a été publié afin de trouver ses coordonnées. Si vous n’arrivez pas à les repérer, communiquez avec nous à PublicationsArchive-ArchivesPublications@nrc-cnrc.gc.ca.
Questions? Contact the NRC Publications Archive team at
PublicationsArchive-ArchivesPublications@nrc-cnrc.gc.ca. If you wish to email the authors directly, please see the first page of the publication for their contact information.
https://publications-cnrc.canada.ca/fra/droits
L’accès à ce site Web et l’utilisation de son contenu sont assujettis aux conditions présentées dans le site LISEZ CES CONDITIONS ATTENTIVEMENT AVANT D’UTILISER CE SITE WEB.
Internal Report (National Research Council of Canada. Institute for Research in
Construction), 1999-04-01
READ THESE TERMS AND CONDITIONS CAREFULLY BEFORE USING THIS WEBSITE. https://nrc-publications.canada.ca/eng/copyright
NRC Publications Archive Record / Notice des Archives des publications du CNRC :
https://nrc-publications.canada.ca/eng/view/object/?id=83c908ea-c969-4491-8e7e-99b7846522b0 https://publications-cnrc.canada.ca/fra/voir/objet/?id=83c908ea-c969-4491-8e7e-99b7846522b0
Archives des publications du CNRC
For the publisher’s version, please access the DOI link below./ Pour consulter la version de l’éditeur, utilisez le lien DOI ci-dessous.
https://doi.org/10.4224/20331274
Access and use of this website and the material on it are subject to the Terms and Conditions set forth at
Assessment of Photoluminescent Material During Office Occupant
Evacuation
Assessment of Photoluminescent
Material During Office Occupant
Evacuation
I R C - I R - 7 7 4
P r o u l x , G . ; T i l l e r , D . K . ; K y l e , B . R . ; C r e a k , J .
During Office Occupant Evacuation
by
Guylène Proulx, Ph.D. and Dale Tiller Ph.D., Institute for Research in Construction, National Research Council of Canada
Brian Kyle, Public Works and Government Services Canada
John Creak, Jalite PLC, UK.
Internal Report No. 774 Date of issue: April 1999
During Office Occupant Evacuation
G. Proulx, D. Tiller, B. Kyle & J. CreakTABLE OF CONTENT
Acknowledgment ...iii Executive Summary... iv Résumé... vi 1.0 INTRODUCTION ...1 2.0 PHOTOLUMINESCENT MATERIAL...1 3.0 LITERATURE REVIEW ...3 4.0 STUDY OBJECTIVE...5 5.0 METHODOLOGY ...55.1 Building and Participants Selection...5
5.2 Experimental Design...8
5.3 Evacuation Procedure for the Jean Talon Building ...10
5.4 Material Installation...11
5.5 Measurements of Lighting Output...12
6.0 FIELD STUDY RESULTS ...17
6.1 Questionnaire Results ...17
6.1.1 Respondent Profile ...17
6.1.2 Fire Safety Knowledge and Experience ...18
6.1.3 Alarm and Voice Communication Information ...18
6.1.4 Floor Evacuation...20
6.1.5 Stairwell Evacuation...21
6.1.6 Evacuation in Each Stairwell...22
6.2 Alarm Sound Measurements ...26
6.3 Data from the Video Cameras ...26
6.3.1 Voice Communication Messages...27
6.3.2 Time to Start ...28
6.3.3 Speed of Movement...29
7.0 DISCUSSION AND CONCLUSIONS...32
7.1 Evacuees' Subjective Assessment of PLM Signage ...33
8.0 REFERENCES ...37
APPENDIX 1 Letter and Questionnaire
LIST OF TABLES
Table 1: Characterization of PLM ...2Table 2: Stairwell Experimental Design ...8
Table 3: Material Luminance mcd/m2...11
Table 4: Illuminance Summary Statistics ...14
Table 5: Age of Respondents ...17
Table 6: Limitations That Could Impede Evacuation...18
Table 8: Respondents Reports of Message Given...20
Table 9: Floor of Origin...20
Table 10: Visibility of PLM Signs on the 10th Floor ...21
Table 11: Action After Leaving Stairwell ...22
Table 12: Stairwell of Descent According to Questionnaire ...22
Table 13: Rating of Usefulness of PLM Signs in Stairwells...23
Table 14: Rating of Visibility of PLM Signs ...23
Table 15: PLM Signs Facilitated Evacuation Movement ...24
Table 16: Brightness of the PLM Signs in Stairwells C and D...24
Table 17: Assessment of Quality of Lighting in the Stairwells ...25
Table 18: Time Line of Events ...28
Table 20: Time to Start in Stairwell...29
Table 21: Speed of Movement in the Four Stairwells...30
Table 22: Speed and Density in the Four Stairwells ...31
LIST OF FIGURES
Figure 1: The Jean Talon Building ...6Figure 2: Typical Floor Plan of the Jean Talon Building ...7
Figure 3: Pictures of the Four Stairwells ...9
Figure 4: Data Acquisition in Stairwells...13
Figure 5: Frequency and Illuminance Distributions in Stairwells ...15
Acknowledgment
The participation of many people was essential to the successful completion of this research project. We are particularly grateful to Statistics Canada Departmental Safety Officers without whose assistance this project would not have been possible. Our special thanks to Jacques Thibodeau, Diane Marinier, Peter Faulkner, Jim Shoobert and the COSH committee members. They were patient and helpful in meeting our numerous requests. They provided full access to the premises and facilitated the preparation and the conduction of the evacuation drill. The assistance from David Paterson, Karen Murray and Hans Coert of Public Works and Government Services was invaluable in smoothing-the-way and securing an agreement with Statistics Canada to conduct this study. Further, exceptional support was obtained from the Property Manager Terri Dewan and her team from Brookfield LePage Johnson Control to modify the lighting and conduct the experiment in the Jean-Talon Building.
It was important for us to obtain the participation of the firefighters during the evacuation drill. We are grateful to Lorne McPhail and his crew from the Ottawa Fire Department who agreed, at very short notice, to participate in the drill.
We want to stress the influential role played by Michael Ouellette, formally at the Institute for Research in Construction of NRC, in initiating this project. Also the essential contribution of Paul Barker, from Chubb UK, who contributed to the design and
installation methods of the photoluminescent material to be used in the study.
Others helped with installing the equipment, distributing questionnaires and acting as observers or working on the analysis. For their efforts, we would like to thank Jocelyn Henrie, Bonnie Belwa, Patrice Leroux, John Latour, Yves Seguin, Roch Monette, Nick Hemmings, Mark Trayner, Ryan MacDonald, and Stacey Tzavelas.
Finally, we would like to thank the occupants of the Jean Talon Building. These busy people graciously accepted to leave their desks and willingly participated in this wintery evacuation under emergency lighting conditions. They provided us not only with fascinating data but also with useful insights, either directly or by answering the post-evacuation questionnaire.
This work was jointly funded by the National Research Council of Canada (NRC),
Assessment of Photoluminescent Material
During Office Occupant Evacuation
G. Proulx, D. Tiller, B. Kyle & J. Creak Executive Summary
A field study was conducted to assess the potential use of photoluminescent material (PLM) as a safety wayguidance system to support office occupant evacuation. The three research partners, the National Research Council of Canada, Public Works
and Government Services Canada, and JALITE PLC, worked closely together to conduct
this research.
The Jean-Talon highrise office building at Tunney’s Pasture, in Ottawa, was selected for this study. An un-announced evacuation drill was carried out with
approximately 500 occupants on three upper floors under emergency lighting conditions. Floor 10 had been equipped with PLM directional hanging signs while Floors 9 and 11 were untouched. The following experimental design was established for the four identical, windowless, stairwells of the building: one stairwell was equipped with PLM signs and wayguidance lines without any additional lighting during the evacuation; a second stairwell, also equipped with PLM signs and wayguidance lines had reduced emergency lighting at an average of 74 lux; a third stairwell had reduced emergency lighting, to 57 lux ; and the last stairwell was untouched with full lighting.
Twenty cameras were used to gather behavioural and time data on the three floors studied and in the four stairwells. Infrared cameras were used in the two stairwells that had the PLM installation. A questionnaire was distributed to evacuees as they exited, to obtain their assessment of their evacuation, the PLM signs and wayguidance system.
Results from the questionnaire show that the evacuees assessed the quality of the lighting in the two stairwells with reduced emergency lighting as very good or acceptable. There was no difference in the assessment of the stairwell with full lighting compared with the stairwells with reduced emergency lighting. The majority of evacuees (70%), who descended the PLM-equipped stairwell, assessed the lighting quality as very good or acceptable, a very positive assessment of the system.
Video recordings provided a complete account of the movements of every occupant evacuated during the evacuation drill. The time to start the evacuation in this building was highly dependent upon the evacuation procedure, since the occupants were expected to wait to start by the exit door for voice communication messages. The average time taken by the first occupants to arrive at each stairwell was 1 min 12 s, which is longer than results obtained in other office buildings. The average time to start descending the stairwells was over 5 min after the sound of the fire alarm when the Evacuation Message was issued. Overall, the full evacuation lasted some 20 min.
The most important finding is the speed of movement of a natural crowd descending the four stairwells under different lighting conditions. Results show that, irrespective of the lighting conditions tested, speeds of movement measured are comparable to mean speed obtained in previous studies of stairwells with full lighting. While the results indicate that the stairwell equipped only with the PLM safety
wayguidance system had the slowest speed of movement of 0.57 m/s, this stairwell also had the largest crowd, the highest density and disruption due to the upward movement of 3 firefighters which slowed down the descending occupants. The stairwell with full lighting was second slowest at 0.61 m/s; it was the second most crowded of the four stairwells. Evacuation in the two stairwells with reduced emergency lighting was faster with 0.70 m/s and 0.72 m/s for the one with PLM and reduced lighting. These stairwells had the fastest overall speed as well as the least amount of people and lowest density. Close examination of these results leads to the conclusion that the decrease in speed in the different stairwells is thus more related to the increase in crowding and the density of occupants than to the lighting conditions.
This study’s findings show the interesting potential of PLM signage to assist occupant evacuation. Such signage, properly installed, can address certain deficiencies in the traditional approach of emergency lighting associated with power failure or smoke-logging of high-mounted luminaires. In order to obtain the expected outcome though, it is essential to properly install the signs, material and wayguidance components. Setting up a PLM wayfinding system appears as a cost-effective addition to, or even a potential replacement for, traditional electrical emergency lighting, since it does not consume energy, requires no wiring, minimum maintenance, and is completely reliable provided it is installed in locations where sufficient activation is ensured from normal illumination maintained on the evacuation route. The occupants’ behaviour, their speed of movement and their subjective appraisal of the material are all in concordance to indicate that PLM signs and safety wayguidance system could be a worthwhile addition improving occupant fire safety in office buildings.
Évaluation de matériel photoluminescent
pour l’évacuation des occupants d'un immeuble à bureaux
G. Proulx, D. Tiller, B. Kyle et J. CreakRésumé
Une étude sur le terrain a été réalisée afin d’évaluer la possibilité d’utiliser du matériel photoluminescent comme système de signalisation de secours pour l’évacuation des occupants d'un immeuble à bureaux. Les trois partenaires de recherche, soit le
Conseil national de recherches du Canada, Travaux publics et services
gouvernementaux Canada et Jalite PLC, ont travaillé en étroite collaboration pour mener
à bien cette recherche.
L’immeuble à bureaux Jean-Talon du Parc Tunney, à Ottawa, a été retenu pour cette étude. On a effectué un exercice d'évacuation surprise dans des conditions
d’éclairage d'urgence impliquant quelque 500 occupants de trois étages situé au haut de l'immeuble. Le 10e étage avait été agrémenté de panneaux de signalisation
photoluminescent suspendus tandis que les 9e et 11e étages n’avaient pas été modifiés. Le design expérimental suivant a été établi pour les quatre escaliers identiques sans fenêtre du bâtiment: une cage d'escalier était munie de signes photoluminescents et de lignes de guidage et ne recevait aucun autre éclairage pendant l’évacuation; la
deuxième, également munie de signes photoluminescents et de lignes de guidage, recevait un éclairage d'urgence réduit de 74 lux; la troisième recevait un éclairage d'urgence réduit de 57 lux ; la dernière n’avait pas été modifiée et recevait un éclairage normal.
Vingt caméras ont été utilisées pour recueillir des données sur le comportement des occupants et les temps d’évacuation des trois étages étudiés et dans les quatre cages d’escalier. On s’est servi de caméras infrarouges dans les deux cages d’escaliers munies de matériel photoluminescent. Un questionnaire a été distribué aux personnes évacuées à leur sortie afin de recueillir leurs commentaires sur le processus
d’évacuation, la signalisation photoluminescente et le système de guidage. Les résultats démontrent que les personnes évacuées jugent très bonne ou acceptable la qualité de l’éclairage dans les deux cages d’escalier ne recevant qu’un éclairage de sécurité réduit. Les évacuées ont jugés de manière comparable l'éclairage de la cage d’escalier normalement éclairée et les deux cages d’escalier qui recevaient un éclairage de sécurité réduit. La majorité des personnes évacuées (70 %) qui ont
emprunté la cage d’escalier dotée de matériel photoluminescent ont jugé très bonne ou acceptable la qualité de l’éclairage, ce qui constitue une évaluation très favorable du système.
Les enregistrements vidéo ont fourni un compte rendu exhaustif des mouvements de chaque occupant pendant l’exercice d’évacuation. Les délais observés pour
commencer à évacuer sont étroitement liés à la procédure d’évacuation de ce bâtiment puisqu'on demande aux occupants d’attendre près de la porte de sortie les instructions transmises par le système de communication phonique. En moyenne, les premiers occupants ont atteint chaque cage d’escalier en 1 minute 12 secondes, ce délai est plus long que les délais mesurés dans d’autres immeubles à bureaux. Les occupants ont
commencé à descendre les escaliers plus de 5 minutes après le déclenchement de l’alarme, lorsque le message d’évacuation a été diffusé. Il a fallu au total une vingtaine de minutes pour évacuer complètement le bâtiment.
Le résultat le plus probant de cette étude touche à la vitesse de déplacement naturel d’un groupe de personnes descendant les quatre escaliers dans différentes conditions d’éclairage. Les résultats montrent qu’indépendamment des conditions d’éclairage, les vitesses de déplacement mesurées étaient comparables aux vitesses moyennes enregistrées au cours d’études antérieures dans des cages d’escaliers normalement éclairées. Bien que les résultats indiquent que la cage d’escalier équipée uniquement d’un système de signalisation photoluminescent obtenait la vitesses de déplacement la plus faible, soit 0,57 m/s, c’est aussi dans cet escalier que l’on a observé le plus fort encombrement, les plus fortes densités ainsi que la perturbation créée par le mouvement vers le haut de trois pompiers, ce qui a ralenti la descente de tous les
occupants. L‘escalier éclairé normalement s’est classé au deuxième rang pour ce qui est de la lenteur d’évacuation, la vitesse moyenne de déplacement étant de 0,61 m/s. Dans les deux escaliers avec éclairage de sécurité réduit, l’évacuation a été plus rapide, les vitesses de déplacement étant de 0,70 m/s et de 0,72 m/s pour la cage équipée de matériel photoluminescent avec l'éclairage réduit. C’est dans ces deux derniers escaliers que l’on a enregistré les vitesses moyenne les plus élevées ainsi que le plus faible
encombrement et la plus faible densité. Après examen minutieux de ces résultats, on a conclu que la lenteur de déplacement était davantage liée à une augmentation de l’encombrement et de la densité des occupants qu’aux conditions d’éclairage.
Les résultats de cette étude montrent bien l'utilité de la signalisation
photoluminescente pour faciliter l’évacuation des occupants. Lorsque correctement installé, cette signalisation peut pallier certaines défaillances de l’éclairage de sécurité habituel, notamment lorsqu’il y a une panne d’alimentation et que les luminaires installés au haut des murs ou au plafond sont occultés par la fumée. Pour obtenir le rendement attendu cependant, il est essentiel d’installer correctement les panneaux, le matériel et les éléments de guidage. La mise en place d’un système de signalisation
photoluminescent apparaît comme un ajout rentable, voire un substitut potentiel, au système classique d’éclairage d'urgence, puisqu’il ne consomme pas d’énergie et ne nécessite donc pas de câblage, n’exige qu’un minimum d’entretien et qu’il est
extrêmement fiable s’il est installé dans un endroit où une activation suffisante est assurée par l’éclairage normal le long du chemin d’évacuation. Le comportement des occupants, leur vitesse de déplacement et leur évaluation personnelle du matériel indiquent tous que les panneaux photoluminescents et le système de guidage de secours peuvent améliorer la sécurité des personnes en cas d’incendie dans un immeuble à bureaux.
During Office Occupant Evacuation
G. Proulx, D. Tiller, B. Kyle & J. Creak 1.0 INTRODUCTIONA photometric survey, carried out by the National Research Council of Canada (NRC) in 6 Public Works and Government Services Canada (PWGSC) office buildings, found many public areas in near or total darkness during emergency lighting
conditions [1]. The study also found electrical wiring practices that could result in nonactivation of the emergency lighting during partial power interruptions. While the emergency lighting did conform to Canadian Occupational Safety and Health regulations (COSH), which applies to these buildings, the results suggest that occupants would benefit from additional lighting along evacuation routes.
A review of published emergency lighting studies suggests that lighting conditions can have a significant impact on occupants’ speed of movement [2]. The cost of
providing additional electrical emergency lighting in existing buildings could be prohibitive. The alternative of installing a Photoluminescent Material (PLM) safety and wayguidance system along evacuation routes appears to be a potential means of improving occupants’ fire safety.
Over the years, PLM has been improved to such a degree that the material is now installed along evacuation paths in many settings such as hotels, hospitals, underground transport systems, ferries and offshore platforms [3, 4]. A number of countries including England, Norway, Sweden, Germany and Japan have developed regulations, standards or codes of practice providing installation and illumination criteria.
In North America, PLM could serve as a cost-effective supplement to emergency lighting or as an alternative to installing emergency lighting in some areas of new or refurbished buildings. Research and experience show that PLM can contribute to the improvement of fire safety in buildings [5].
2.0 PHOTOLUMINESCENT MATERIAL
A PLM system consists of signage elements that can be installed in the form of signs, paint, strips or fabric on any surface. The particularity of this non-radioactive material is that it contains pigments which have the capacity to store energy from normal lighting and will restore this energy as a useful light source when the illuminating,
activating energy is extinguished.
The PLM materials contain a zinc sulphide compound that is energized in moments by the ultra violet and blue light wavelength energy that is present in common light sources such as daylight, tungsten filament and fluorescent lights. This high-energy source is converted into a lower energy source of light which can be repeatedly recharged by re-exposure to light. This low-energy light source is yellowish-green in colour, the most readily perceived by the human eye in total darkness. Over time, the
material will diminish in brightness, but will remain visible to the dark-adapted eye for a period of time varying upon the type of material. Tests have shown that the light emitted from the luminous material may be still visible to the dark adapted eye for as long as 40 hours [6]. The commonly accepted criteria for the characterisation of such materials is the time required for the luminance of the material to decay to 0.3 mcd/m2, this being 100 times the threshold limit of the dark adapted human eye. Commonly used zinc sulphide pigments based materials will reach this point in some 5-8 hours and the newer alkaliearth aluminate based materials, in excess of 15-20 hours when activated with some 100 lux or greater from ordinary white fluorescent light sources.
There are several different test methods available for the characterization of photoluminescent materials. They are all based on the following principles:
• activation of the material with a standard light source of a given luminous flux output and radiant energy type and power;
• stopping the activation after a given time; and
• measurement, after specific time intervals from the stopping of activation, of the level of brightness of the emitted luminous flux using photometric techniques and/or by comparison to standard calibration samples.
All the published test methods excite the photoluminescent material with a powerful light source; 150W/100W tungsten or xenon source giving 1000 lux (100 foot-candle) luminous flux for 1 or 5 min prior to testing. The intention is to achieve maximum
excitation before measurement of the emitted luminance values over time after excitation has been stopped.
The most common test method, used in Europe, is according to the Deutsche Norm DIN 67510 1974. This standard asks for the description of the material tested, the luminance value at 60 minutes from the end of excitation and the time required for the luminance to decay to 100 times the perception level of the human eye (a value of 0.3 mcd/m²) and, finally, the colour of the emitted light.
The Photoluminescent Safety Products Association (PSPA) in the UK has
developed a classification system for photoluminescent products based on this standard, as presented in Table 1. Three classes have been adopted to classify the luminance performance of PLM. The material classification is used to determine the subsequent application of the products in escape route marking systems.
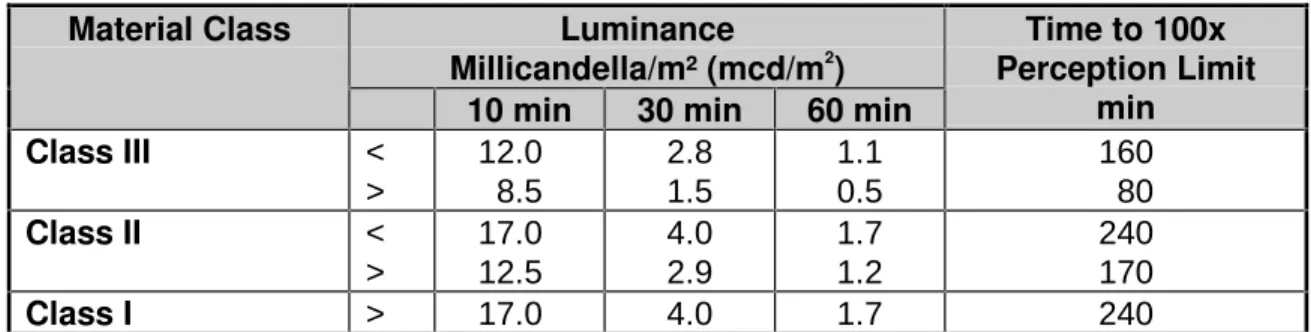
Table 1: Characterization of PLM Luminance
Millicandella/m² (mcd/m2) Material Class
10 min 30 min 60 min
Time to 100x Perception Limit min Class III < > 12.0 8.5 2.8 1.5 1.1 0.5 160 80 Class II < > 17.0 12.5 4.0 2.9 1.7 1.2 240 170 Class I > 17.0 4.0 1.7 240
Class I materials are recommended for high-risk areas having no supplementary emergency lighting. Class II materials provide the minimum standard for the production of safety signs and for evacuation guidance using isolated visual clues. Class III
materials may be used to complement evacuation route marking systems using adequate quantities of Class I and/or Class II materials in conjunction with emergency lighting.
If properly installed, some of the benefits of using a PLM wayfinding system may include the following:
• it provides orientation and confidence, thereby reducing anxiety in situations where evacuation is necessary;
• if installed as a continuous strip, PLM can assist orderly and speedy evacuations in blackout conditions;
• PLM will not fail provided it has been exposed to proper lighting to become fully charged;
• in heavy smoke, a continuous strip of PLM positioned at 1 m from the floor and at the skirting board is better as a directional guide than regular or emergency lighting that is ceiling or wall mounted, since the latter is likely to become obscured;
• PLM is simple and economical to install;
• it can be set up in new or existing buildings;
• it requires a minimum of maintenance, it is inherently flame retardant, it is also unaffected by cold, explosions and, to some degree, vandalism; and
• PLM is non-radioactive and non-toxic.
Some of the disadvantages of using a PLM system may include the following:
• it does not provide as much brightness as lamps or luminaires;
• the material decreases in intensity as the stored light is emitted; however, this is compensated for, to some degree, by the fact that the eye is also adapting to the light;
• a person passing from a fully lit space to an area with PLM only will need a few seconds to adapt to this new lighting;
• it is necessary to illuminate the evacuation routes to charge the material; and
• the intensity or optical brightness (luminance) of the material will depend on the material selected, the level and type of the activating illumination and the time of illumination prior to the light failure.
3.0 LITERATURE REVIEW
In the UK, Webber and his colleagues have completed several studies on the usefulness of PLM as a wayfinding system. In one study, they looked at the speed of
movement and subjects’ evaluation of the system. They compared the use of PLM to emergency lighting meeting British Standard BS 5266 Part 1 [7] of 0.2 lux, as measured along the centreline of the evacuation route, in two different environments of a laboratory setting [8]. One situation was in a long corridor, the other on a set of stairs. The
researchers found that speed of movement of 24 working-age subjects under PLM illumination was slightly faster on the stairs, and subjects rated the material more
favourably, and the movement as being less difficult. Speeds in the corridor were quicker under the emergency lighting illumination, and subjects rated the PLM less favourably, and the movement as more difficult. Researchers found that movement up the stairs was improved by the PLM marking on each riser. They concluded that the performance of the subjects under the PLM conditions was similar to that under emergency lighting.
Finally, based on subjects’ ratings they concluded that PLM could provide a viable alternative to emergency lighting [8, 9, 10].
In another study, Aizlewood and Webber [11] compared the use of PLM to three other wayfinding systems in a laboratory setting with 48 subjects. These systems were electroluminescent, incandescent (tungsten filament), and traditional emergency escape route lighting (at British Standard luminance). Subjects were allowed to adapt to a lighting level of 500 lux, then the lights were switched off and the subjects were asked to follow a path through a corridor and downstairs using each of the four different materials. On the third trial, obstacles were introduced onto the route. From this study, the
researchers found that, although speed of movement under PLM conditions was similar to that of the other wayfinding systems, it was difficult for the subjects to see obstacles, and they rated the system worse than the other three electrical wayfinding systems.
Webber has also conducted laboratory studies on the visibility of wayfinding
systems and lighting systems in smoke [9, 12, 13, 14]. The wayfinding systems of these studies consist of low-mounted luminous continuous tracks, emergency exit door
markings and exit signs installed to provide wayfinding guidance on egress routes. In one study, Webber had each subject in a long corridor, under two conditions. First, he allowed the subject to adapt to light at 0.3 lux. Then, with a small amount of smoke in the corridor, he had the subject move forward until the material was visible, and then legible. In the second study, the subject stood stationary, and the room was filled with smoke until the material was no longer visible. The purpose of the studies was to assess the visibility of eight different wayfinding systems, namely electroluminescent, miniature incandescent, LED with pictogram signs, LED with vertical signs, PLM signs and
marking, PLM with high-mounted emergency luminaires, fluorescent pictogram signs with high-mounted emergency luminaires and reflective pictogram signs with high-mounted emergency luminaires. The results of these studies showed that electrically powered wayfinding components have a higher visibility performance in smoke than PLM components. However, with no other lights on, the PLM was perceived in smoke after elapsed times of more than 15 min. In smoke, the presence of high-mounted luminaires reduced contrasts producing unhelpful scattered light. Webber concluded that electrically powered wayfinding systems offered more effective visual guidance in smoke than
traditional emergency luminaires.
Jensen in Norway [15] tested 84 subjects in dense smoke with seven different wayfinding or wayguidance systems. His results on visual guidance are contradictory to popular belief: he found that the level of luminance is not important in smoke! Results show that a PLM strip of 25 mm wide, built into a directional rail, performed the best amongst other systems at high smoke densities of OD 1.49 m. At higher smoke densities, subjects could not move at all, regardless of the wayguidance system.
Heskestad and Pedersen [16] pointed out in their review of experiments on PLM and electrical powered wayfinding systems, that it is our ability to perceive details that
takes the longest to adapt in darkness but we are able to follow continuous lines without perceiving the detailed directional information. Therefore, with respect to speed of
movement in a smoke environment, there are no significant differences between systems as long as they are continuous.
It should be noted that these studies were usually performed along short paths, with few subjects moving along routes one at a time and in laboratory environments. No field studies to assess the performance of the material, with actual occupants, have been carried out in office building environments. To enable this material to be used, results from field studies are needed. These studies compare occupants’ movement along routes with PLM to routes with conventional systems. The results of such studies will demonstrate the impact of PLM on actual occupants’ movement during an evacuation.
4.0 STUDY OBJECTIVE
The objective of this study was to assess the potential use of PLM as a safety communication system to support office occupant evacuation. The study was also aimed at measuring the occupant time to start, move and evacuate the building. The field study allowed us to measure the speed of movement of occupants in a natural setting with the participation of all occupants. The impact of the social interactions between occupants during evacuation has been identified in previous studies as an important variable [15]. Also, it appears essential to evaluate the effectiveness of the material in an actual building with non-informed occupants. Assessment by the occupants of their experience during the evacuation was also gathered through a questionnaire distributed after the evacuation drill.
5.0 METHODOLOGY
To gather data on the usefulness of PLM to support office occupant evacuation, it was decided to conduct an unannounced evacuation drill in an office building. Such a field study required the careful selection of the building, the occupants studied and the experimental design. Detailed explanations of the methodology for evacuation drill studies can be found in IRC Internal Report No. 730 [18].
5.1 Building and Participants Selection
PWGSC as one of NCR’s two partners in this research, collaborated to find a suitable office building to conduct the field study. The selected building had to meet the following criteria:
• the building had to have at least 3 comparable windowless staircases;
• the building had to be over 5 floors in height, to allow for sufficient occupant movement in the staircases; the longer the descent, the better the
measurement of speed differences related to stairwell conditions;
• the building had to meet the applicable regulations for emergency lighting;
• the building occupants had to be a typical office crowd with mixed gender, ages and physical challenges;
• a minimum of 50 occupants should use each stairwell studied during the evacuation; and
• support was required from the building Fire Safety Team to organize and conduct the evacuation drill.
After a long search to find the most suitable building among PWGSC stock, the Jean Talon Building at Tunney’s Pasture in Ottawa was selected. This building offered premium features to conduct this study. Statistics Canada is the tenant of the building. Excellent staff support was obtained in this building to conduct the field study.
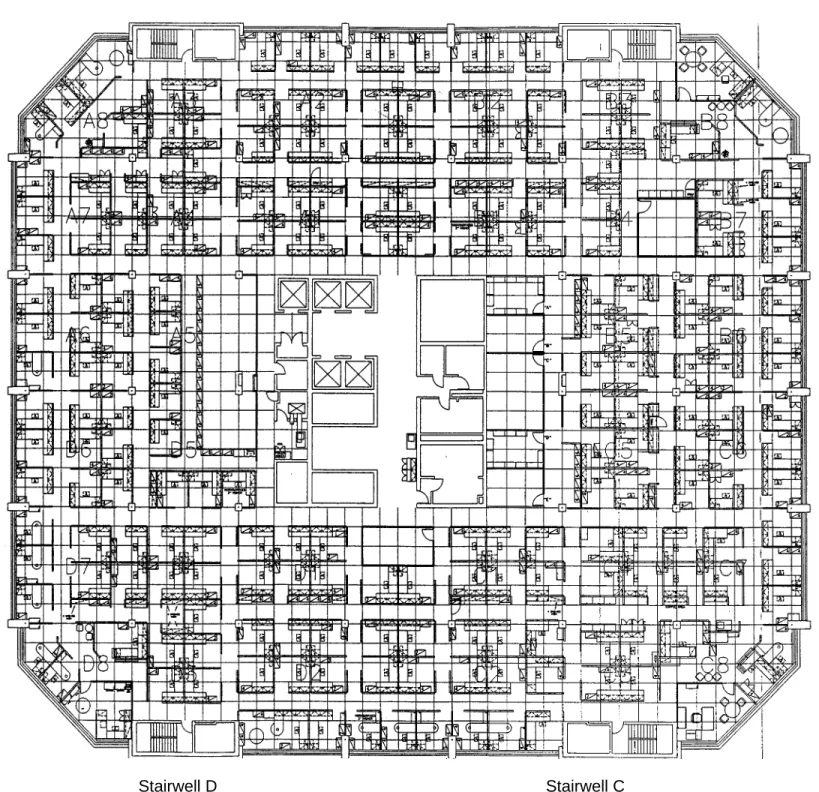
Figure1: The Jean Talon Building
The Jean Talon Building is a 13-story concrete structure built in 1979. The building, glazed on all sides, is almost square in shape, as presented in Figure 1. Each floor area of 3700 m2 (approximately 65 m x 57 m)is an open plan concept divided into 4 quadrants, identified A, B, C and D. Work stations are divided with partition walls of 1.7 m in height. On the three floors studied (9, 10, 11), partition wall arrangements are similar. In the centre of the building is the core area, with elevators, washrooms, storage areas and a few enclosed meeting rooms. There is an average of 150 office workers on each floor doing research and clerical activities. The building has four identical
windowless stairwells leading to the outside of the building. Figure 2 presents a typical floor plan of the Jean Talon building.
Figure 2: Typical Floor Plan of the Jean Talon Building
Stairwell D Stairwell C
There are 9 alarm bells positioned on pilasters throughout the floor. There are speakers on the storey, at each of the exit doors and in the stairwell at mid-landing for the voice communication system. Also, at the entrance to the stairwell, there is firefighting equipment located in the cabinet below the voice communication speakers. At Stairwell D, there are two evacuation chairs for assisting occupants with mobility impairment in their descent of the stairwell.
5.2 Experimental Design
In collaboration with Statistics Canada, it was decided to study Floors 9, 10 and 11 of the Jean Talon Building. The tenth floor was equipped with PLM hanging signs, while the 9th
and 11th
floors served as comparison floors with no special treatment. During the evacuation drill, the regular lighting was turned off leaving only the building emergency lighting on the 3 studied floors.
The building’s four identical stairwells presented different conditions, as shown in Table 2 and Figure 3. It is important to mention that, in this building, the stairwell
emergency lighting is the full lighting with double-tube luminaires on every floor and mid-landing which provides a very well-lit stairwell of an average lighting of 245 lux. For this study, the lighting conditions in three of the stairwells were modified. Lighting in
Stairwells A and D was modified to obtain a reduced output maintained above the
COSH [19] requirements of an average of 10 lux and not less than 3.3 lux. To obtain this reduced output, 2 out of 3 double-tube luminaires were switched off in Stairwells A
and D. With this design, Stairwell A had an average lighting of 57 lux and Stairwell D had an average lighting, slightly higher, of 74 lux. Stairwell D also had PLM signs and a wayguidance system installed. A few minutes before the evacuation, all lights were switched off in Stairwell C which had PLM signs and wayguidance system. Finally, Stairwell B received no treatment; it acted as the control stairwell.
Table 2: Stairwell Experimental Design Stairwell Condition
A Emergency lighting reduced to 57 lux B Full lighting – Control stairwell
C PLM without any other lighting
D PLM with emergency lighting reduced to 74 lux
Twenty cameras were used to gather data. A camera was placed at the entrance to each of the four stairwells on floors 9, 10 and 11. There were also cameras placed in the stairwells on the landing between the fifth and sixth floors. For the two stairwells that had the PLM installation, infrared cameras were used. These cameras are able to film in complete darkness and to produce a black and white image. Four cameras were also placed outside, at ground level at each exit door. At each of these outside cameras, two assistants handed out a questionnaire to evacuees as they exited the building.
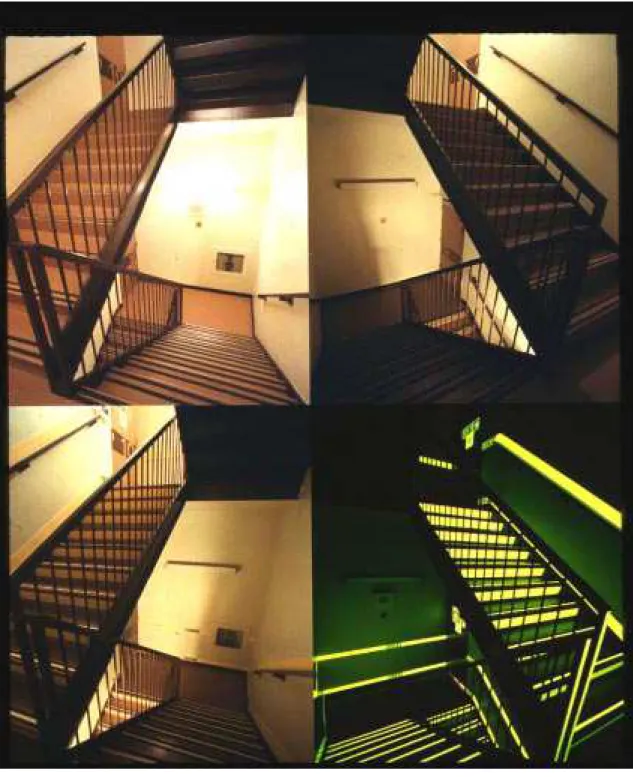
Figure 3: Pictures of the Four Stairwells
The picture on the upper left corner is Stairwell B with full lighting at an average of 245 lux. The picture on the upper right corner is Stairwell A with lighting reduced to 57 lux. The picture on the lower left corner is Stairwell D with PLM signs and a wayguidance system, and lighting reduced to 74 lux. The picture on the lower right corner is Stairwell C with PLM signs and a wayguidance system and no other lighting source provided.
5.3 Evacuation Procedure for the Jean Talon Building
The procedures in case of an emergency in the Jean Talon Building are detailed in a procedure manual available to all staff and used in the training of floor fire wardens [20]. A summary of the procedure is posted by the elevators and exits on all floors.
The evacuation procedure, in case of a fire during working hours, is planned as a sequential or phased evacuation. The building benefits from a complete voice
communication system as well as trained fire wardens on all floors to assist the occupants with this procedure. The fire orders for that building are as follows:
If the Fire Alarm Sounds during Normal Working Hours:
• Calmly, assemble near voice communication speakers
• Bells will ring for approximately one (1) minute
• Once bells silence, comply with voice communicator’s instructions
• If bells continue to ring, evacuate immediately using the nearest safe EXIT
• Obey all instructions of Fire Officials
• Mobility-impaired persons must have assigned monitors
• Once outside, clear the building by at least 100 m
• Return to the building only when authorized by fire officials
This procedure implies that when the fire alarm is activated, all occupants gather at the closest exit door by the voice communication speaker and await instructions. Then
the sequential or phased evacuation is planned to work as follows: "…if a fire breaks out on, say, the 10th floor, that floor, the 9th and 11th are immediately evacuated. Because smoke and hot gases rise to the top of a building, the 12th floor is evacuated next, followed by the other floors in ascending order. When top floors have been completely evacuated, the 8th floor is to be evacuated followed by the other floors in descending order." [20]. In the event of a fire, occupants receive instructions through the voice communication system to evacuate three floors, namely the fire floor, the floor below and the floor above. This procedure allows occupants who are most at risk to exit first and would prevent crowding in the stairwells.
This evacuation procedure was unchanged for the study. It was an unannounced evacuation drill. The fire alarm rang throughout the building. Occupants gathered by their closed evacuation exit awaiting instructions. For the study, the 10th floor was the fire floor, so the 9th, 10th and 11th floors were evacuated. The voice communication messages delivered to occupants stated that an evacuation drill was going to be conducted under emergency lighting conditions, then that an incident had occurred on the 10th floor, so occupants on Floors 9, 10 and 11 should evacuate. Occupants with disabilities were told to gather at the D stairwell and stand by for instructions.
The research team remained outside the building during the drill, except for the principal researcher who mingled with the evacuees on Floor 10 and went down
Stairwell C with PLM signage only. Also, a technician took sound measurements of the fire alarm output on the 10th floor. The video recordings provided information on the occupants' behaviour, the time to respond to the alarm, the direction of movement and the speed and flow in the staircases. At the bottom of each stairwell, a questionnaire
was distributed to evacuees to obtain their assessments of the evacuation and their experience with the PLM. The evacuation was carried out with the participation of the Ottawa Fire Department.
Before and after the evacuation drill, data was also gathered on the lighting
conditions in the different areas of the building under normal conditions, with emergency lighting and after installation of the PLM signage. This data will enable comparison with past or future studies.
5.4 Material Installation
Before installing the PLM wayfinding system to support occupant evacuation, it was important to develop a plan for installation. All routes suitable for use in an emergency were identified, as well as all exits on the route, refuge floor, and final exits. It was decided to follow the Photoluminescent Safety Products Association (PSPA) Standard 002 Part 1 1997 [21] and JALITE PLC manufacturers recommendations for the design of the PLM safety wayguidance system.
Researchers have made several recommendations for installing wayfinding
systems [5, 9,22]. They suggest that all doors be marked at both eye and floor level, that the route to the exit should be clear and unambiguous, and that if the emergency exit is not visible, directional markers be provided. In open plan areas, it is important to mark the path and the door. Stair characteristics and changes of level should all be marked; the material should be placed on the nose of the riser, and on the handrails. Webber also recommends highlighting any hazards on the route, and indicating where the fire pull box and equipment are located.
JALITE PLC provided all the PLM signs, wayguidance lines and components which met the Luminous Class 1 specification of the PSPA as measured by the German
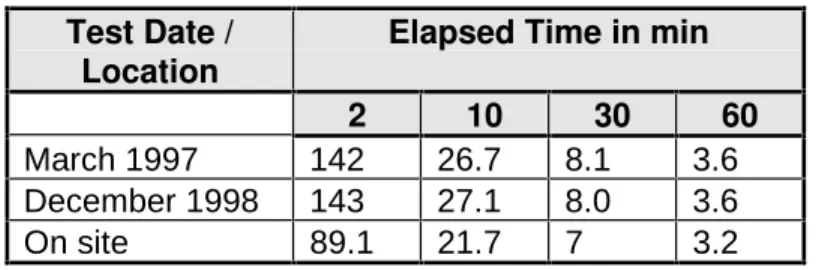
Standard DIN 67510 Part 1 1992 [23]. JALITE also planned and supervised the PLM installation. After the evacuation drill, a piece of material was taken to the UK to measure the luminance values. Table 3 shows the comparative results of the material’s
luminescence decay characteristics as measured on shipment to Canada in March 1997 and a sample of the same material after the evacuation drill in December 1998. This performance was measured after activation at 1000 lux for 5 min, which is a standard test according to DIN 67510 Part 1. As presented, no change in properties was
observed. The table also presents the estimated performance of the material on location with an average activation of 50 lux of Cool White fluorescent for 5 min.
Table 3: Material Luminance mcd/m2 Test Date /
Location Elapsed Time in min
2 10 30 60
March 1997 142 26.7 8.1 3.6
December 1998 143 27.1 8.0 3.6
All signs with wording content were bilingual, meeting the Treasury Board of Canada requirements for signage [24]. These signs also presented the "running man" pictogram which is an ISO standard [25]. On the 10th
floor, PLM hanging signs were positioned throughout the floor to direct occupants toward the four exits. Special attention was made to position signs right above the narrow corridors between partition walls leading to the exits. Directional signs were provided at each decision point [26]. Floor signage was suspended using stretch wire suspension kits. The full installation of the 10th floor required over 80 signs.
Two of the four stairwells were equipped with PLM from the top floor of the building down to the bottom. The installation of the material was according to the PSPA Standard 002 Part 1 1997 [21],and safety signs according to BS 5499 Part 1 1990. As shown in Figure 3, the stairwell was equipped with two continuous wayguidance lines of 10 cm in width. One line was at the skirting board and the other 1 m from the floor. Directional signs were enclosed within these continuous lines. A 2 cm strip of PLM was fixed on the tread of each step and a 10 cm piece was positioned on the riser of each step. A sign identifying the floor number was installed on each door as well as a sign identifying the "Transfer Floors" on Floors 4, 9 and 13. Directional signs were positioned on each door and at mid-landing at 1.7 m from the floor. In accordance with Canadian practice, signs were positioned at the top of each exit door, identifying them as final exit. The material and installation costs for the stairwells were estimated at $2500/floor.
5.5 Measurements of Lighting Output
Ambient light levels provided by the emergency lighting system were measured on the 9th, 10th, and 11th floors, and Stairwells A, B, and D of the Jean Talon Building. The emergency lighting system was activated on each of the three floors using wall mounted switches that switched off all lighting with the exception of those luminaires providing emergency lighting. The overhead lighting on all three floors was provided by fluorescent lamps, mounted in a coffered ceiling system. The furniture used throughout the three floors of the building offered occupants several task lights at each workstation, which supplemented the overhead emergency lighting.
Emergency lighting in the stairwells was provided by the regular lighting system. This consisted of one two-lamp luminaire (Sylvania Optron 4100K 32W F032/841 lamps) 1 mounted on every landing 2.5 m (97.5 in.) from the floor, which normally
remained switched on at all times. For the purposes of this experiment, the lighting in the stairwells was modified as described in Section 5.2.
Light levels were measured on the building floors and in the stairwells 1 m above floor level using recently calibrated Minolta T-1M illuminance meters. The meters were connected to an automated data acquisition system presented in Figure 4, which polled the meters and stored the resulting readings on a computer hard disk.
1
Certain commercial products are identified in this report in order to adequately specify the
experiment procedure. In no case does such identification imply recommendations or endorsement by the National Research Council, nor does it imply that the product or material identified is the best available for the purpose.
Figure 4: Data Acquisition in Stairwells
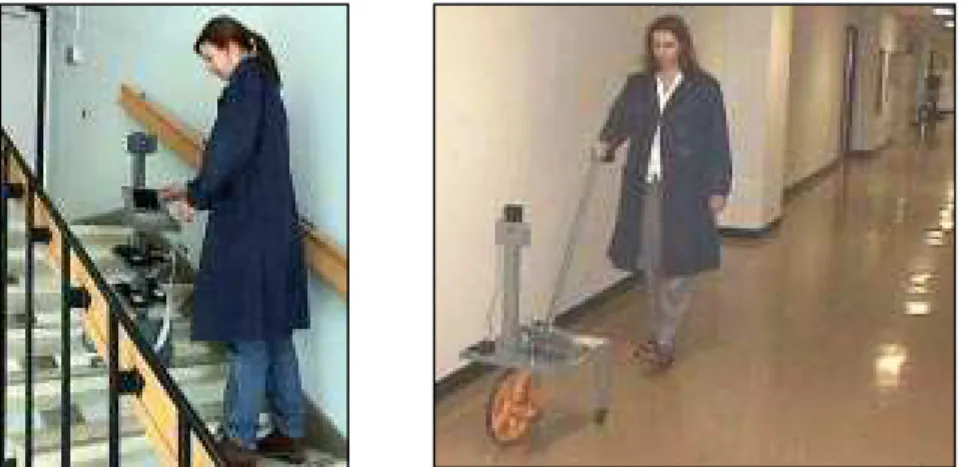
The picture on the left shows the configuration used in the stairwells (the stairwell depicted was not one measured in this study). The illuminance meters are mounted on a pillar such that the plane of the detectors is 1 m above the stair tread. The operator manually directs the software and data acquisition hardware mounted on the laptop computer to poll the illuminance meter, and store the measured values on the computer hard disk. Once the polling operation has been completed, the operator moves the apparatus to the next measurement location, and repeats the operation. The picture on the right shows the configuration used to collect measurements on the floors. The operator pushes the device along the centreline of the
measurement path. As the calibrated wheel (circumference 1 m) turns, the data acquisition system is directed to poll the illuminance meters and store the resulting value in the computer once every 25 cm of travel.
For the stairwells, a total of 12 readings were collected between each floor as follows: three readings were collected at the door landing and the mid-landing, and one each at the top, middle and last stair of each staircase. The data acquisition system software was configured so each reading was polled by the operator manually once the apparatus was correctly placed. All stairwells were windowless, so no daylight
supplemented the electric lighting.
On Floors 9, 10 and 11, the operator pushed the measuring system along the centreline of the measurement path using a specially designed cart, presented in Figure 4. The operator walked the automated data acquisition system down the centreline of every path available to the occupants of these floors, following COSH recommendations (6.10.1.B) [19]. In accordance with IESNA [27] recommendations, measurements on the building floors were collected at night (IESNA, 1993, p. 60). Summary statistics describing illuminance measurements are presented in Table 4 and Figures 5 and 6.
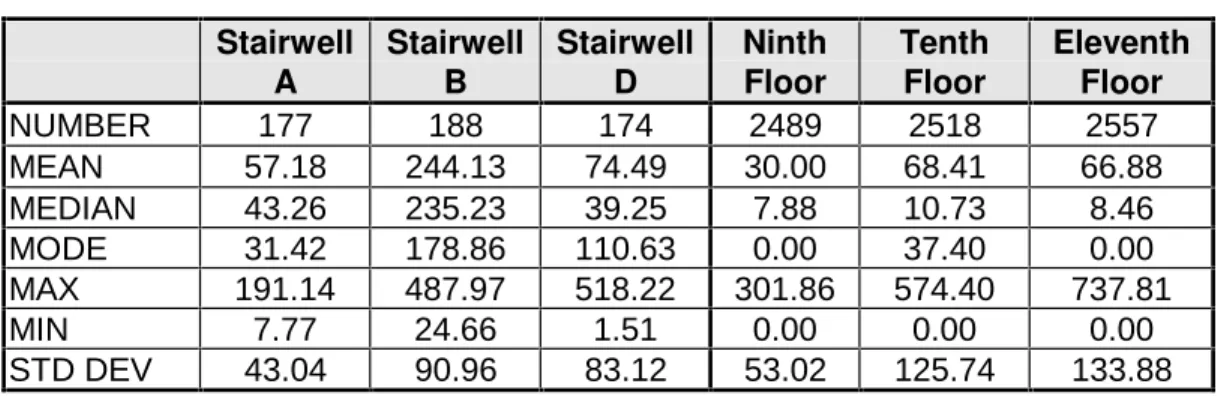
Table 4: Illuminance Summary Statistics Stairwell A Stairwell B Stairwell D Ninth Floor Tenth Floor Eleventh Floor NUMBER 177 188 174 2489 2518 2557 MEAN 57.18 244.13 74.49 30.00 68.41 66.88 MEDIAN 43.26 235.23 39.25 7.88 10.73 8.46 MODE 31.42 178.86 110.63 0.00 37.40 0.00 MAX 191.14 487.97 518.22 301.86 574.40 737.81 MIN 7.77 24.66 1.51 0.00 0.00 0.00 STD DEV 43.04 90.96 83.12 53.02 125.74 133.88
As expected, light levels were higher in Stairwell B, which remained unmodified, than in either Stairwells A or D, where the lighting had been modified to reduce the ambient levels that would have been provided normally.
COSH [19] emergency lighting requirements specify an average level of 10 lux (6.10.2.B), with a minimum of not less than one third the average (i.e., 3.3 lux (6.11.1)). In all cases, the average requirement of at least 10 lux was achieved. Emergency lighting in Stairwells A and B met this criterion, but the emergency lighting provided on the 9th, 10th and 11th floors, and in Stairwell D, did not meet the minimum requirement of at least 3.3 lux.
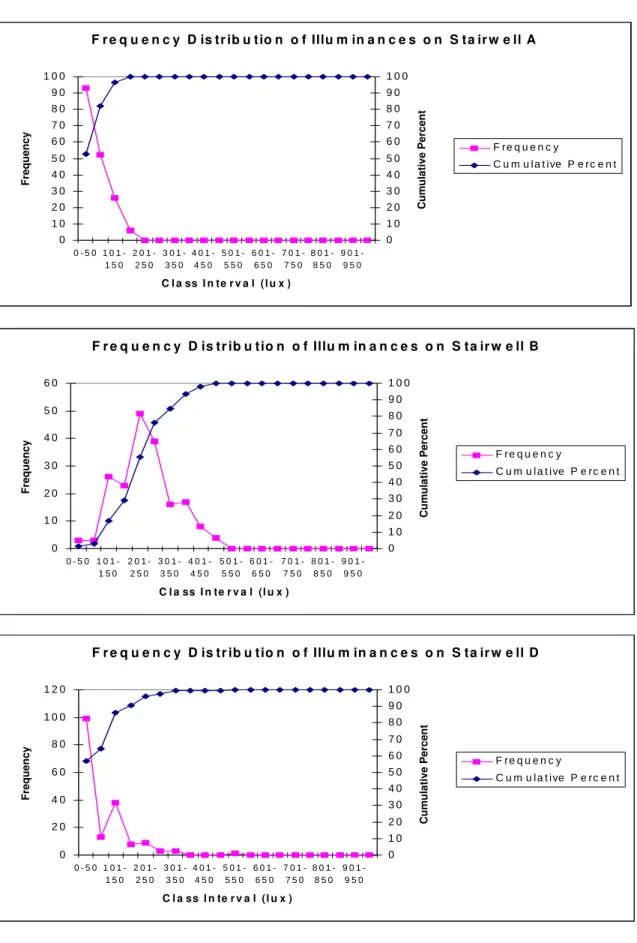
Figure 5: Frequency and Illuminance Distributions in Stairwells F r e q u e n c y D is tr ib u tio n o f Illu m in a n c e s o n S ta ir w e ll A 0 1 0 2 0 3 0 4 0 5 0 6 0 7 0 8 0 9 0 1 0 0 0 5 0 1 0 1 -1 5 0 2 0 1 -2 5 0 3 0 1 -3 5 0 4 0 1 -4 5 0 5 0 1 -5 -5 0 6 0 1 -6 5 0 7 0 1 -7 5 0 8 0 1 -8 5 0 9 0 1 -9 5 0 C l a ss I n te r v a l (l u x ) Frequency 0 1 0 2 0 3 0 4 0 5 0 6 0 7 0 8 0 9 0 1 0 0 C u m u lati ve P ercent F re q u e n c y C u m u l a t ive P e rc e n t F r e q u e n c y D is tr ib u tio n o f Illu m in a n c e s o n S ta ir w e ll B 0 1 0 2 0 3 0 4 0 5 0 6 0 0 5 0 1 0 1 -1 5 0 2 0 1 -2 5 0 3 0 1 -3 5 0 4 0 1 -4 5 0 5 0 1 -5 -5 0 6 0 1 -6 5 0 7 0 1 -7 5 0 8 0 1 -8 5 0 9 0 1 -9 5 0 C l a ss I n te r v a l (l u x ) Frequency 0 1 0 2 0 3 0 4 0 5 0 6 0 7 0 8 0 9 0 1 0 0 Cumul ati ve P ercent F re q u e n c y C u m u l a t i ve P e rc e n t F r e q u e n c y D is tr ib u tio n o f Illu m in a n c e s o n S ta ir w e ll D 0 2 0 4 0 6 0 8 0 1 0 0 1 2 0 0 5 0 1 0 1 -1 5 0 2 0 1 -2 5 0 3 0 1 -3 5 0 4 0 1 -4 5 0 5 0 1 -5 -5 0 6 0 1 -6 5 0 7 0 1 -7 5 0 8 0 1 -8 5 0 9 0 1 -9 5 0 C l a ss I n te r v a l (l u x ) Frequency 0 1 0 2 0 3 0 4 0 5 0 6 0 7 0 8 0 9 0 1 0 0 Cumul ati ve P ercent F re q u e n c y C u m u l a t i ve P e rc e n t
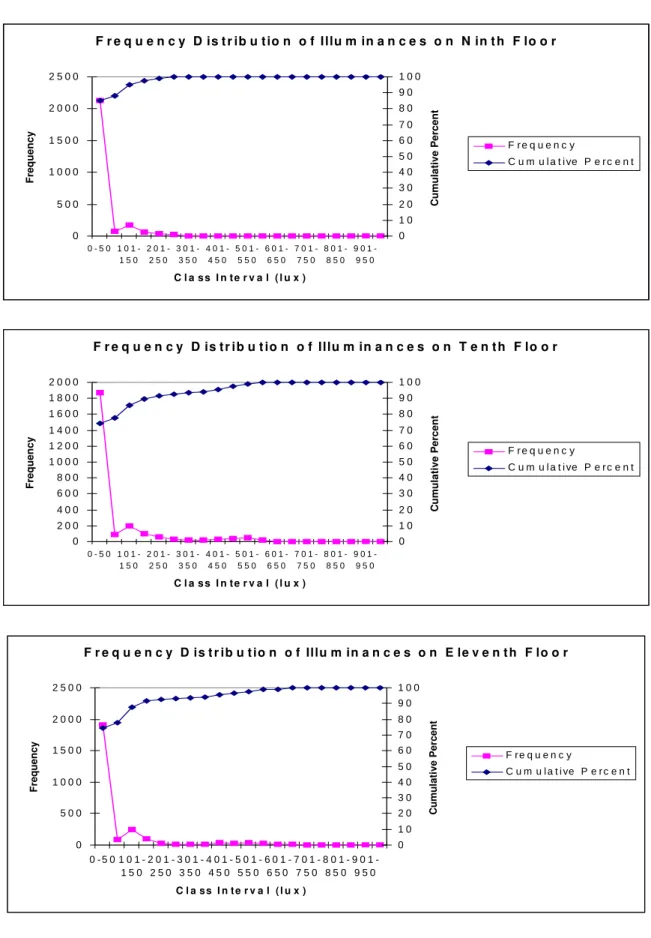
Figure 6: Frequency and Illuminance Distributions on Floors 9, 10 and 11 F r e q u e n c y D is t r ib u tio n o f Illu m in a n c e s o n N in t h F lo o r 0 5 0 0 1 0 0 0 1 5 0 0 2 0 0 0 2 5 0 0 0 5 0 1 0 1 -1 5 0 2 0 1 -2 5 0 3 0 1 -3 5 0 4 0 1 -4 5 0 5 0 1 -5 -5 0 6 0 1 -6 5 0 7 0 1 -7 5 0 8 0 1 -8 5 0 9 0 1 -9 5 0 C l a ss I n te r v a l ( l u x ) Fr equency 0 1 0 2 0 3 0 4 0 5 0 6 0 7 0 8 0 9 0 1 0 0 C u mulative P er cent F r e q u e n c y C u m u l a t i ve P e r c e n t F r e q u e n c y D is tr ib u t io n o f Illu m in a n c e s o n T e n th F lo o r 0 2 0 0 4 0 0 6 0 0 8 0 0 1 0 0 0 1 2 0 0 1 4 0 0 1 6 0 0 1 8 0 0 2 0 0 0 0 5 0 1 0 1 -1 5 0 2 0 1 -2 5 0 3 0 1 -3 5 0 4 0 1 -4 5 0 5 0 1 -5 -5 0 6 0 1 -6 5 0 7 0 1 -7 5 0 8 0 1 -8 5 0 9 0 1 -9 5 0 C l a ss I n te r v a l ( l u x ) Fr equency 0 1 0 2 0 3 0 4 0 5 0 6 0 7 0 8 0 9 0 1 0 0 C u mulative P er cent F r e q u e n c y C u m u l a t i ve P e r c e n t F r e q u e n c y D is t r ib u t io n o f Illu m in a n c e s o n E le v e n t h F lo o r 0 5 0 0 1 0 0 0 1 5 0 0 2 0 0 0 2 5 0 0 0 5 0 1 0 1 -1 5 0 2 0 1 -2 5 0 3 0 1 -3 5 0 4 0 1 -4 5 0 5 0 1 -5 -5 0 6 0 1 -6 5 0 7 0 1 -7 5 0 8 0 1 -8 5 0 9 0 1 -9 5 0 C l a ss I n te r v a l (l u x ) Fr equency 0 1 0 2 0 3 0 4 0 5 0 6 0 7 0 8 0 9 0 1 0 0 Cum u la ti ve Per cent F r e q u e n c y C u m u l a t i ve P e r c e n t
6.0 FIELD STUDY RESULTS
The evacuation drill unfolded as planned without any unexpected incident to report. The drill was on Wednesday, 18 November 1998, at 13:45. This day and time allowed
for a maximum of occupants to be in the building. The temperature outside was -3°C with light snowflakes coming down. The fire alarm was activated by a staff member of Statistics Canada's fire safety team on the 10th floor. The alarm bells started ringing immediately. Overall, the evacuation drill took less than 20 min.
Data from the questionnaires and the video recordings were analyzed. For all tests, the level of significance is α < 0.05.
6.1 Questionnaire Results
A questionnaire was distributed to each evacuee after they left the building, at each of the four stairwells. The questionnaire contained 21 questions and was divided into 4 parts. A copy of the bilingual questionnaire and cover letter is enclosed in Appendix 1. At the conclusion of the evacuation, two of the researchers offered questionnaires to everyone on the three floors who evacuated to make sure that everyone had the
opportunity to fill out the questionnaire. This included those individuals who were unable to leave the floor, but who did participate in the evacuation. Three red boxes to return the questionnaire were put out for 1 week, one in each of the elevator lobbies of Floors 9, 10 and 11. Over 450 questionnaires were handed out. A total of 216 questionnaires were returned.
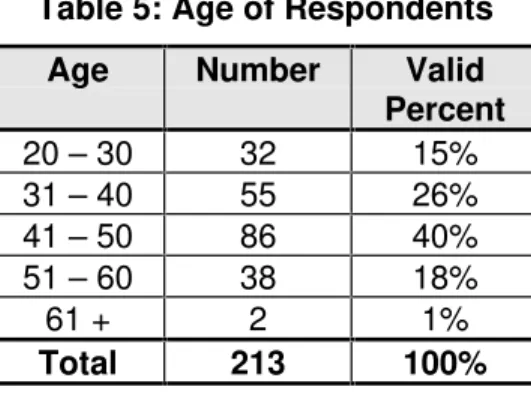
6.1.1 Respondent Profile
Among the 216 questionnaires returned, 3 respondents did not indicate their age. There was a great range of ages of the respondents as presented in Table 5.
Table 5: Age of Respondents
Age Number Valid
Percent 20 – 30 32 15% 31 – 40 55 26% 41 – 50 86 40% 51 – 60 38 18% 61 + 2 1% Total 213 100%
Out of the 216 questionnaires, 120 (56%) people did not indicate their gender. Of the remaining 96 who did, 31 (32%) were female and 65 (68%) were male.
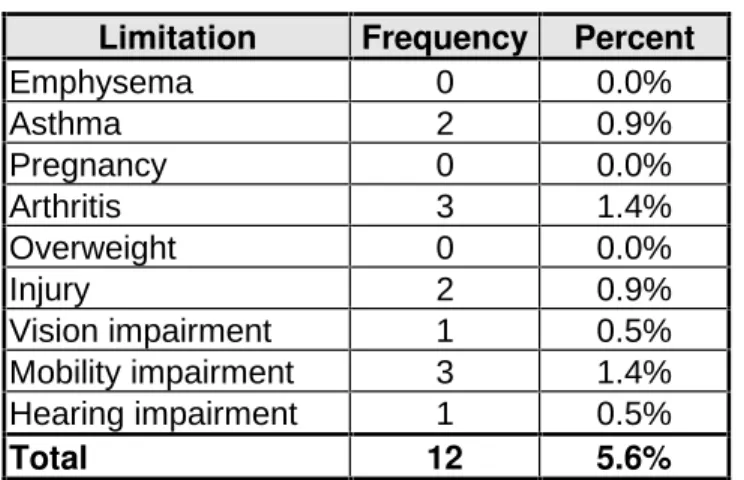
As presented in Table 6, 12 of 212 people (6%) indicated having limitations that could impede their evacuation. The questionnaire provided 9 possible limitations from which to choose.
Table 6: Limitations That Could Impede Evacuation Limitation Frequency Percent
Emphysema 0 0.0% Asthma 2 0.9% Pregnancy 0 0.0% Arthritis 3 1.4% Overweight 0 0.0% Injury 2 0.9% Vision impairment 1 0.5% Mobility impairment 3 1.4% Hearing impairment 1 0.5% Total 12 5.6%
6.1.2 Fire Safety Knowledge and Experience
Overall, the participants were knowledgeable about fire safety. Of the 216
respondents, 201 (93%) reported having taken part in an evacuation drill in this building in the past. Two hundred and ten of 215 (98%) indicated that they knew where to go to evacuate their floor. One hundred and forty-three of 216 (66%) were able to identify the fire warden for their floor or in their work area. The majority, 207 of 214 (97%),
considered that they are required to obey the instructions of the fire wardens. Three (1%) did not believe it was required to obey the wardens, while the remaining 4 people (2%) were not sure.
6.1.3 Alarm and Voice Communication Information
Two hundred and eleven or almost 100% of 212 respondents reported hearing the fire alarm. One person reported not hearing the fire alarm, it was the same person who reported having a hearing impairment. Participants were asked about the volume of the alarm. Among the 211 who answered this question, 178 (84%) of them reported that the fire alarm was loud enough. Thirty-one people (15%) felt the alarm was too loud, and 2 (1%) felt it was not loud enough.
Eighty-four percent of 212 respondents (178 people), reported being at their desk when the alarm sounded, while the remaining 34 (16%) were away from their desks. Participants were asked to choose one item from a list of 10 to describe their first action upon hearing the fire alarm. The most common answer was that respondents got dressed upon hearing the alarm. This was reported by 68 of 212 (32%). The least common response, less than 1% (1 person), was to evacuate the floor. Interestingly, 21 people (10%) reported that they continued working when they heard the fire alarm. The frequencies for the other choices are shown in Table 7.
Table 7: First Action Upon Hearing the Fire Alarm
Action Frequency Valid
Percent
Got dressed 68 32%
Followed instructions on P.A. 26 12%
Went to meeting point 25 12%
Secured files/information 24 11%
Continued working 21 10%
Return to office 20 9%
Gathered valuables 14 7%
Sought more information 10 5%
Evacuated the building 3 1%
Evacuated the floor 1 1%
Total 212 100%
After the alarm, several messages were given over the voice communication
system. Two hundred and ten of 213 respondents, (99%) reported hearing the message. Three people (1%) reported that they did not hear a message. One of these three was the participant with the hearing impairment, another indicated that he/she was in the washroom at the time and, therefore, did not hear the message, and for the third, there was no explanation of why he/she did not hear the message.
Participants were asked to write down what the message was. Each response was later fit into one of several categories as reported in Table 8. There were actually four messages given, each with a different piece of information. No participant correctly identified all four pieces of information. Fifty-one of 216 (24%) left this question blank. Twenty-four people (11%) wrote that they did not know or did not remember. Many people wrote an answer but it was incorrect or did not contain enough information to be
put into any category. For example, one participant wrote, “Something about this being a drill,” and another wrote, “Wait for instructions.” Responses such as these were coded as wrong/incomplete and this occurred for 81 (37%) of the participants. When the ‘don’t know’, ‘wrong/incomplete’, and ‘left blank’ categories are combined, it suggests that 156 or 72% of the people could not recall the content of the messages delivered.
Table 8: Respondents Reports of Message Given What was the message? Frequency Valid
Percent 1- Lighting reduced on floors 9, 10, 11 26 12%
2- Incident on floor 10; Evacuate 9, 10, 11 21 10%
3- Do not use elevators 0 0.0%
4- If assistance needed, go to Stairwell D 0 0.0%
Message 1 and 2 12 6%
Message 1, 2, and 4 1 0%
Wrong or incomplete answer 81 37%
Question left blank 51 24%
Don’t know 24 11%
Total 216 100%
6.1.4 Floor Evacuation
As the three floors studied were under emergency lighting conditions, participants were asked to assess, from four choices provided, the quality of this lighting for
evacuating. A total of 210 people responded to this question. Ninety-three (44%) rated the lighting as being very good. One hundred and four (50%) rated it as being
acceptable. Eight people (4%) said the lighting was poor and the remaining 5 (2%) rated it as being dangerous.
Photoluminescent signs to direct evacuation movement were placed only on the 10th floor. All questionnaires asked if these signs were seen on the floor, if they were useful to direct evacuation, and to rate the visibility of the signs. Some people who were not from the 10th floor reported seeing these signs. As this was not possible, their data for these three questions was discarded. Only the data from people reporting to be from the 10th
floor was used. As presented in Table 9, 30 people did not indicate from which floor they were, so floor information is available for only 186 people.
Table 9: Floor of Origin Reported Floor of Origin Frequency Valid Percent 11 54 29.1% 10 70 37.7% 9 58 31.2% 3 1 0.5% 5 1 0.5% 7 1 0.5% 21 1 0.5% Left blank 30 Total 216 100%
Out of the 70 respondents on the 10th
floor, 54 (77%) people indicated seeing PLM signs. Twenty-five people of 49 respondents from the 10th floor (51%) reported that these
signs were useful in finding their way on the floor. As reported in Table 10, of the 53 who rated the visibility of these signs, 32 (60%) reported the visibility to be very good, 16 (30%) rated it to be acceptable, 2 (4%) said the visibility was poor, and 3 (6%) said it was dangerous.
Table 10: Visibility of PLM Signs on the 10th Floor Assessment Frequency Valid
Percent Very Good 32 60% Acceptable 16 30% Poor 2 4% Dangerous 3 6% Total 53 100% 6.1.5 Stairwell Evacuation
This section examines responses for the four stairwells together. The next section discusses the results of the individual stairwells.
One hundred and fifty-five of 168 respondents (92%) reported that they used the stairwell that was closest to them to evacuate. One person added to the questionnaire that he/she was told by his/her warden to use another stairwell (not the closest one). Four other people who did not use the closest stairwell reported having this same warden. It is not known why the remaining 8 did not use the closest stairwell; however, one of them did report being away from his/her desk when the alarm sounded.
In response to the question as to whether signs were noticed in the stairwell, 130 of 211 (62%) reported yes. Eighty-one (38%) reported that they did not notice signs.
The assessment of the quality of lighting of the stairwells for the entire sample was examined. Two hundred and two people provided lighting ratings from a choice of four. Eighty-five people (42%) rated the lighting as being very good. Ninety-two (46%) rated it as being acceptable. Fourteen people (7%) said the quality of lighting was poor. The remaining 11 (5%) rated it as being dangerous.
No one indicated that furniture prevented them from entering the stairwell.
However, 63 of 204 respondents (31%) reported that people were crowding around the entry to the stairwell.
It was reported that people entering at other floors blocked the descent of 65 of the 202 respondents (32%). Respondents mentioning that people entering at other floors blocked their descent differed significantly depending on which floor the respondents left from, χ² = 14.06, df = 2, p < 0.001. As could be expected, more people from Floor 11
reported this as being a problem than did people from Floors 9 and 10. Difficulty finding the handrail was a problem for 23 of 201 (11%). Forty-two of 201 (21%) said that there was difficulty seeing due to poor lighting.
Of 201 people, 27 (13%) said people were moving upward in the stairwell. Fifty-two of 204 (26%) claimed that people in front of them were moving too slowly. Seven people of 160 (4%) reported that people were standing on the landings. Of 203 people, 44 (22%) answered that they felt dizzy from the long descent. No one reported that they had difficulty finding the exit door at the base of the stairwell.
Upon exiting the staircase, 207 of 212 (98%) reported being outside. One person exited onto another floor, 2 people exited into a hall or lobby, and another 2 exited underground. As presented in Table 11, 6 of 210 (3%) reported that they waited for instructions after leaving the staircase, 133 (63%) went to the meeting point, and 71 (34%) left the premises.
Table 11: Action After Leaving Stairwell
After Leaving Stairwell Frequency Valid Percent
Went to meeting point 133 63%
Left the premises 71 34%
Waited for instructions by stairs 6 3%
Total 210 100%
6.1.6 Evacuation in Each Stairwell
Of the 216 respondents, it was not possible to determine which stairwell was used by 5 people. Of the remaining 211, 47 (22%) descended in Stairwell A, 48 (22%) used Stairwell B, 77 (37%) used Stairwell C, and 39 (19%) descended in Stairwell D as presented in Table 12.
Table 12: Stairwell of Descent According to Questionnaire Stairwell of Descent Frequency Valid
Percent
A- Emergency lighting at 57 lux 47 22%
B- Full lighting 48 22%
C- PLM alone 77 37%
D- PLM and emergency lighting at 74 lux 39 19%
Total 211 100%
From Stairwell A, 15 of 47 people (32%) reported noticing signs in the stairwell. Fifteen people of 46 (33%) from Stairwell B reported seeing signs in the stairwell. Sixty-four of 77 (83%) using Stairwell C noticed signs and 36 of 39 (92%) from Stairwell D noticed signs. These frequencies are significantly different (χ² = 45.51, df = 3,
p < 0.001). There were significantly more people noticing signs in Stairwells C and D which were equipped with the PLM signs and wayguidance system.
Both Stairwells C and D had PLM signs and wayguidance system. Seventy-six people of 77 (99%) using Stairwell C reported seeing the PLM signage in the stairwell. From Stairwell D, 34 of 39 (87%) reported seeing the PLM signage.
As reported in Table 13, 69 of 72 respondents (96%) from Stairwell C reported that the PLM signs were useful in finding their way down the stairwell. Still, 14 people of 31 (45%) from Stairwell D with PLM signage and reduced lighting, reported the signs to be useful.
Table 13: Rating of Usefulness of PLM Signs in Stairwells Usefulness of PLM Signs Frequency Valid
Percent Stair C Stair D Stair C Stair D
Yes 69 14 96% 45%
No 3 17 4% 55%
Total 72 31 100% 100%
The visibility of the PLM signs and wayguidance system was assessed by choosing one of four options listed in Table 14. Seventy-five people from Stairwell C responded to this question: 33 (44%) rated the visibility as being very good; 34 (45%) rated it as being acceptable; 5 (7%) rated the visibility as being poor; the remaining 3 (4%) rated it as being dangerous. Thirty-one people from Stairwell D answered this question: 16 (52%) reported the visibility of the PLM signs as being very good; 12 (39%) said the visibility was acceptable; 2 (6%) rated it as being poor and 1 (3%) said the visibility was
dangerous. The frequencies of the 2 stairwells did not differ significantly, χ² = 0.36, df =
1, p = 0.55. It is interesting to note that among the 4 respondents who assessed the PLM signage as dangerous, 2 of them also assessed the emergency lighting on their floor as dangerous. Also, a third person wrote cynical comments implying essentially that the whole building is dangerous.
Table 14: Rating of Visibility of PLM Signs Visibility of PLM Signs Frequency Valid
Percent Stair C Stair D Stair C Stair D
Very Good 33 16 44% 52%
Acceptable 34 12 45% 39%
Poor 5 2 7% 6%
Dangerous 3 1 4% 3%
Total 75 31 100% 100%
From Stairwell C, 61 of 74 (82%) reported that the PLM signs facilitated the
evacuation movement as presented in Table 15. Ten of 31 (32%) from Stairwell D stated that the PLM signs facilitated the evacuation. These frequencies are significantly
Table 15: PLM Signs Facilitated Evacuation Movement PLM Facilitated
Evacuation Frequency PercentValid Stair C Stair D Stair C Stair D
Yes 61 10 82% 32%
No 13 21 18% 68%
Total 74 31 100% 100%
Respondents were asked to report whether the brightness of the signs got brighter, darker, or did not change. As reported in Table 16, 10 people of 74 (14%) using Stairwell C reported that the signs got brighter. Two (3%) said the signs got darker. The majority, 62 (84%), reported that the brightness did not change. Thirty people from Stairwell D answered this question: 2 (7%) stated that the signs got brighter, 1 (3%) reported that they got darker, and 27 (90%) reported that the brightness of the signs did not change.
Table 16: Brightness of the PLM Signs in Stairwells C and D Brightness during descent Frequency Valid
Percent Stair C Stair D Stair C Stair D
Became Brighter 10 2 14% 7%
Became Darker 2 1 3% 3%
Did not change 62 27 84% 90%
Total 74 30 100% 100%
Participants were asked to assess, from four choices, the quality of the lighting in the stairwell. The results are presented in Table 17. In Stairwell A, 26 out of 47 (55%) stated that the lighting was very good: 18 (38%) stated that the lighting was acceptable; 3 (7%) reported that the lighting was poor. No one from Stairwell A rated the lighting as being dangerous. In Stairwell B with full lighting, 27 of 45 respondents (60%) reported that the lighting was very good: 18 (40%) reported that the lighting was acceptable. No one from Stairwell B stated that the lighting was poor or dangerous. In Stairwell C with PLM only, 14 (20%) of 72 people reported the lighting to be very good: 36 (50%) said the lighting was acceptable; 11 (15%) reported that the lighting was poor and 11 (15%) stated that the quality of the lighting was dangerous. In Stairwell D with PLM and
emergency lighting at 74 lux, 18 people of 36 (50%) reported the lighting to be very good and 18 (50%) stated that the lighting was acceptable. No one from Stairwell D reported that the lighting quality was poor or dangerous. The differing frequencies between the stairwells are significant (χ² = 32.39, df = 3, p < 0.001). This difference is accounted for
by Stairwell C which had more evacuees who judged the lighting as poor or dangerous compared to the evacuees of the three other stairwells. It is important to note that the question was worded "How would you assess the quality of the emergency lighting in the stairwell you used?" Several respondents from Stairwell C added the comment that there was no emergency lighting in the stairwell they used so they left the question blank or assessed the lighting as dangerous because it was non-existent. The objective of the question was to obtain a subjective assessment of the conditions in the stairwell. The wording of this question should be revised to reflect how a PLM wayguidance system can support occupants evacuation, if this questionnaire is to be used in future studies.