Dynamic Analysis of a Buckling-Type Amplification
Mechanism to Maximize the Power Output by
Varying the Load Impedance and Control Timing
The MIT Faculty has made this article openly available.
Please share
how this access benefits you. Your story matters.
Citation
Torres, James, and H. Harry Asada. “Dynamic Analysis of a
Buckling-Type Amplification Mechanism to Maximize the Power
Output by Varying the Load Impedance and Control Timing.” Volume
2: Legged Locomotion; Mechatronic Systems; Mechatronics;
Mechatronics for Aquatic Environments; MEMS Control; Model
Predictive Control; Modeling and Model-Based Control of Advanced
IC Engines, 17-19 October, 2012, Fort Lauderdale, Florida, ASME,
2012, p. 123. © 2012 by ASME
As Published
http://dx.doi.org/10.1115/DSCC2012-MOVIC2012-8813
Publisher
ASME International
Version
Final published version
Citable link
http://hdl.handle.net/1721.1/118803
Terms of Use
Article is made available in accordance with the publisher's
policy and may be subject to US copyright law. Please refer to the
publisher's site for terms of use.
DYNAMIC ANALYSIS OF A BUCKLING-TYPE AMPLIFICATION MECHANISM TO MAXIMIZE THE
POWER OUTPUT BY VARYING THE LOAD IMPEDANCE AND CONTROL TIMING
James Torres H. Harry Asada
Mechanical Engineering Massachusetts Institute of Technology
Cambridge, MA 02139 jtorres9@mit.edu
ABSTRACT
Due to the limited displacement of piezoelectric stack actuators, common practice is to use some form of displacement amplification mechanism. This paper focuses on an externally leveraged mechanism that utilized a buckling motion to achieve large amplification ratios within a single stage. This mechanism interfaces with a sinusoidal gear track that acts as the load. The dynamics of the system are derived and are shown to be fifth order. Due to the significantly nonlinear amplification caused by the buckling phenomenon and the gear, the dynamics are run in simulation to gain insight into the performance of the actuator. There is shown to be an optimal speed at which to run the actuator to maximize the possible power output. Furthermore, due to the simple binary control significant benefits are achieved by varying the control timing based on the velocity to ensure the force and velocity of the output are in phase.
INTRODUCTION
At the forefront of linear actuator research is the desire to develop an actuator that is competitive across several design parameters, including weight, efficiency, bandwidth, force, and stroke. Piezoelectric actuators, in particular PZT stack actuators, compare favorably to other smart material actuators, such as shape memory alloy and hydraulic actuators, in most of these parameters, with the only significant exception being stroke. Their insufficient strain, typically around 0.1%, limits their applications to high precision nano- and micro- scale mechanisms. [1] Therefore, over the past few decades, researchers have striven to develop amplification mechanisms that provide a larger stroke while maintaining many of the desirable characteristics of the other design parameters.
Displacement amplification mechanisms typically fall into one of three categories. The first group is internally leveraged
mechanisms, which include cantilevered designs. These mechanisms do not significantly sacrifice weight or efficiency, but greatly reduce the potential output force. [2,3,8] The next group is externally leveraged mechanisms. These mechanisms can be significantly larger in size and weight and therefore sacrifice bandwidth as well as potential output force. Their mechanical complexity ranges from simple lever arms to more elaborate flextensional devices that can be configured in a nested architecture allowing for larger amplification ratios [4-8]. In general, these amplification mechanisms are limited by their parasitic serial compliance which reduces their mechanical efficiency. The final group is frequency leveraged mechanisms. These mechanisms utilize piezoelectric stacks’ high bandwidth in an inch worm type setup to provide continuous motion. This design requires extensive use of friction to bear the output load which can limit efficiency and the stall load. [8]
This paper focuses on the dynamic performance of a specific externally leveraged mechanism. Most of these designs use flexures for their repeatability and ease of manufacturing. When the size of the flexures is optimized for performance, the amplification ratio reaches a limit of about 10 [9]. Therefore, in order to obtain larger strokes, these amplification mechanisms must be nested which increases the number of flexures and decreases the efficiency. The fundamental concept of the design discussed in this paper relies on the non-linear phenomenon similar to buckling [10-12]. Consider two identical piezoelectric stack actuators constrained collinearly in between two rigid walls, as shown in Fig. 1. At each interface there is an ideal rotational joint, in this case ideal is defined as infinitely rigid with no friction. As the piezoelectric stacks are energized, they will tend to rotate and the center joint, referred from here on as the keystone, will displace vertically. The keystone displacement can typically be over 100 times the displacement of the piezoelectric stack. tandem
ASME 2012 5th Annual Dynamic Systems and Control Conference joint with the JSME 2012 11th Motion and Vibration Conference DSCC2012-MOVIC2012
DSCC2012-MOVIC2012-8813
October 17-19, 2012, Fort Lauderdale, Florida, USAThis paper will look at a dynamic model of this non-linear “buckling” phenomenon, which can be unpredictable and difficult to control due to the kinematic singularity at its neutral position, along with how it would interface with an output load. The output power is compared over a range of impedances to find the preferred loading conditions. Finally, an exploration into the control timing and its effect on performance is presented.
FIGURE 1. SCHEMATIC OF THE BUCKLING-TYPE AMPLIFICATION MECHANISM
DESIGN PRINCIPLE Amplification Ratio
Consider the schematic in Fig. 1, as the PZT stack displaces and the keystone is pushed upward. The force at the output, Fb, is a function of both the position and the voltage
input to the PZT stack. In the ideal case, the output position would be stable at the kinematic singularity while the PZT stacks are discharged. Therefore, if the PZT stacks became charged, the singular configuration would become an unstable equilibrium point and there would be two stable points on either side. The instantaneous amplification ratio, G, is a function of the PZT displacement, x, and the initial length of the piezoelectric stack, Lo. The instantaneous amplification can
also be expressed in terms of ε, the strain of the PZT stack. Figure 2 shows G as a function of x.
y
L
x
L
dx
dy
G
x
L
x
x
L
y
o o o o
2
1
2
2
2
2 (1)For very small displacements in x, there are significantly larger displacements in y. As x tends towards zero, the instantaneous amplification ratio tends towards infinity. Due to conservation of energy, however, the force transmitted is related to the reciprocal of G; and therefore, will always be zero at the kinematic singularity configuration.
FIGURE 2. A PLOT OF THE AMPLIFICATION GAIN RATIO, G, AS A FUNCTION OF THE PZT DISPLACMENET, Z
Mass-Spring System Model
The practical implementation of the simple schematic in Fig. 1 is not feasible because this model requires the PZT stack to be loaded in tension. PZT stacks cannot handle a significant tensile load as it causes damage to the laminate between the internal electrodes. Adding a compressive preload to the actuators by moving the grounded walls closer together, a distance zp, and connecting a tuned spring to the keystone, of
stiffness ky, as shown in Fig. 4, the output of the mechanism can
remain stable while never loading the PZT stacks in tension. [12] Furthermore, the compressive preload will allow an effective tensile load to be produced over a contact interface, reduce compliance associated with contact stresses, and provide an enhancement to the piezoelectric effect. [13]
The magnitude of the stiffness, ky, is directly related to the
preload distance, zp, the stiffness of the PZT stack actuators, kp,
and the initial length of the PZT stack, Lp. Note that the preload
length is significantly smaller than the initial length of the PZT stack. The stiffness should satisfy the constraint, such that the mechanism has a net zero stiffness at the kinematic singularity. Therefore: 0
outy yk
k
2 22
sin
2
out o out p p p odF
d
d
L y
k
F
k x
dy
dy
dy
L
y
(2) p p p y p p p o p p pz
z
z
k
k
k
k
L
L
z
L
z, PZT Displacement Fp Fb y, Output Displacement PZT Stacks Ideal Rotational Joints Ground Kinematic Singular Configuration Lp θ 0 10 20 30 40 50 0 50 100 150 200 250 300 350 400 450 PZT Displacement, z [micrometers] In st a n ta n e o u s A m p lif ica tio n R a tio , G [ - ]As a result the buckling mechanism has an output force displacement relationship shown in Fig. 3.
The load connected to the amplification mechanism is a linear gear track, depicted in Fig. 4. The gear has a mass, M, and a viscous damping coefficient, B. The gear track is a sinusoid with amplitude, A, and pitch, ω, such that the track displacement can be related to the output displacement of the buckling mechanism in Eq. 3.
sin
y
A
X
(3)This output transmission also has a gain associated with it,
G2. 2 2
1
1
A
y
A
dy
dX
G
(4)Figure 5 breaks down how the different components of the schematic are modeled. The PZT stack is modeled as a spring, damper, and force source in parallel connected to a mass. Ideally the rotational joints have an infinite radial stiffness, an infinite tangential compliance, and are lossless. However, in an actual system there are pertinent dynamics associated with the contact stiffness at these joints. The contact joint is modeled as a linear spring and damper connected in parallel. The keystone has a mass associated with it, which is connected to the grounded spring mentioned above. The load is a mass and damper connected in series. For this paper, the stiffness associated with the coupling between the keystone and the gear is ignored. Finally, the force output of the force source, Fp, is
related to the voltage across the PZT stack. The charging dynamics associated with this voltage add an order to the system making the final model fifth order.
The system can then be described by the lumped parameter model in Fig. 6. Note that the system without charging dynamics is fourth order because there are two independent displacements, X and z, that are able to store kinetic and potential energy independently within the several masses and springs. Equation (3) describes the mechanism displacement, y, and Eq. (5) shows the displacement at the rotational joint, zj, as
a function of the generalized coordinates.
z
L
X
sin
A
z
z
z
L
X
sin
A
L
y
z
o j j o o total
2
2
2
2 2 2
(5)FIGURE 3. THE OUTPUT FORCE-DISPLACEMENT RELATIONSHIP OF THE BUCKLING MECHANISM
FIGURE 4. A SCHEMATIC OF THE PRELOADED BUCKLING-TYPE AMPLIFICATION MECHANISM
FIGURE 5. A SCHEMATIC DETAILING THE LUMPED PARAMETERS OF THE MODEL
“On,” Charged
“Off,”
Discharged
F
yy
zp ky Lo Lp B M X ky B mk G2 M kp, bp, Fp G mp k j, bj 3 Copyright © 2012 by ASMEFIGURE 6. A LUMPED PARAMETER MODEL OF THE AMPLIFICATION MECHANISM AND THE OUTPUT LOAD
Derivation of Equations of Motion
The equations of motion can be simply derived using the Lagrange method. As mentioned previously, there are two independent displacements, X and z, that can be used as the generalized coordinates. The potential energy, V, kinetic energy,
T, and their derivatives with respect to the generalized
coordinates are shown in Eqs. (6) and (7), respectively.
2 2 21
1
1
2
p p2
j j2
y j j j y j p p j jV
k z
z
k z
k y
z
V
y
k z
k y
X
X
X
z
V
k z
z
k z
z
z
(6) 2 2 2 2 2 2 2 2 2 21
1
1
2
2
2
2
p k k k pT
m z
m y
MX
T
y y
m
X
X
X
X
d
T
y y
y
MX m
X
X
dt
X
X
X
X
d
T
m z
dt
z
(7)The non-conservative forces are associated with the dampers within the system and the piezoelectric force source. Thus the generalized forces of the system are:
p j j j p z j j j X
F
z
z
z
b
z
b
X
z
z
b
X
B
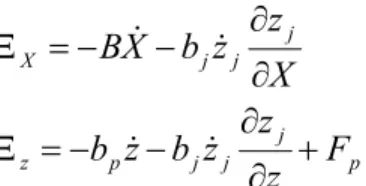
(8)The equations of motion are therefore described by combining Eqs. (6)-(8) using the Lagrange method.
2 2 2 2j k k j j j j j y j j p p j j p j j p p
z
y
y
M m
X
m
X
BX b z
X
X
X
z
y
k z
k y
X
X
z
z
m z
b z b z
F
k z
k z
z
z
z
(9)Finally, the force source dynamics are associated with the RC circuit within the electrical domain, where τ is the electrical time constant and Fcommand is the commanded force output.
These electrical dynamics can be described by a low order approximation based on the electrical circuit described here [14].
1
p command pF
F
F
(10) IMPEDANCE MATCHINGCommon design practice with DC motors is to match the expected load with the peak power output of the motor by properly specifying the motor and gearbox. Similarly with the buckling amplification mechanism, there exists an optimal frequency at which to run the actuator that will maximize the power output. Due to the significant nonlinearities within the system it is difficult to analytically predict the power transmission of the actuator and therefore, simulations were run using the dynamics described in Eqs. (9) and (10).
In addition to the dynamic equations, the control algorithm for the simulator is required. A simple binary controller is initially implemented, where switching is determined solely by the position of the keystone. The PZT stacks are charged when the keystone has no displacement and discharged at the maximum absolute displacement. Figure 7 shows the charging (red) and discharging (blue) explicitly.
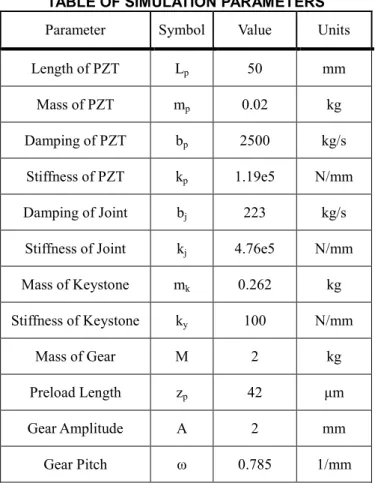
The values of the parameters used in the simulation are shown in Annex A and are based on a physical system to be used in future experiments to compare the results. The simulation was run while varying the gear damping, B. After the transient response subsides, the gear reaches a pseudo-steady state periodic velocity. It is not a true pseudo-steady state velocity because there are minor fluctuations associated with the oscillations of the buckling mechanism; however, from
kp Fp mp mk ky G z zp G2 y M X B kj bj bp ztotal
cycle to cycle the velocity does not change. At this point, the average power output from the buckling mechanism is equal to the average power dissipated in the gear damping. Therefore, the average power input from the PZT stack can be compared to the average power dissipated by the gear mechanism. Equations (11) and (12) detail the calculation of the average power input, Pin, and output, Pout, and the efficiency, η.
2 out in pP
mean BX
P
mean F z
(11) out inP
P
(12)The maximum power and efficiency are limited predominantly by a phase lag between the output force and the output velocity. The source of the difference in phase can be attributed to the compliance of the joint and the charging of the PZT stack. Figures 8 and 9 show the average force and power output, and the efficiency, respectively, as functions of the gear velocity.
FIGURE 7. A SCHEMATIC SHOWING THE INITIAL CONTROL TIMING WITH RESPECT TO THE GEAR TRACK. RED IS
CHARGING, BLUE IS DISCHARGING.
FIGURE 8. A PLOT SHOWING THE OUTPUT FORCE AND POWER AS A FUNTION OF THE GEAR VELOCITY
FIGURE 9. A PLOT SHOWING THE MECHANICAL EFFICIENCY AS A FUNCTION OF SPEED
CONTROL TIMING
The buckling mechanism and slotted gear system is analogous to a combustion engine in several ways. First, the stroke has a fixed amplitude defined completely by kinematics and thus, the speed is directly related to the frequency of the piston/keystone. Second, the control is practically binary control and therefore dominated by the timing. The actuator transmits more power if the force and the velocity of the piston are in phase. Therefore, the initial timing control algorithm, mentioned in the previous section and shown in Fig. 7, can be adapted by drawing insight from the automotive community, in particular, variable valve timing.
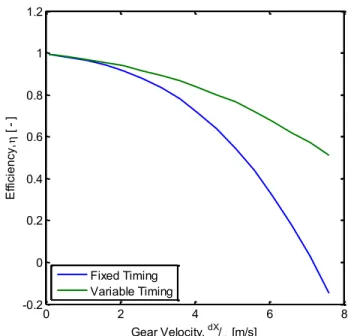
The phase lag associated with the joint compliance and the charging of the PZT stack can be compensated for by shifting the charging timing earlier by an amount, ΔX, shown in Fig. 10. This timing shift can be directly related to the gear velocity to increase the maximum output power and efficiency. Due to the complicated nonlinear dynamics and the pseudo-steady state velocity, this was determined solely through simulation. Figure 11 shows the power output for a variety of timing shifts. Figures 12 and 13 are presented to show the effects of variable vs. fixed timing on the system; power output and efficiency, respectively, are shown as functions of the gear velocity. The variable timing values depicted have been selected to produce the maximum power output. Using the data from the simulation, shown in Fig. 11, a fit was produced to anticipate the timing based solely on the measured pseudo-steady state velocity (see Fig. 14).
0 1 2 3 4 5 6 7 0 20 40 O u tp u t F o rc e , F ou t [N ] Gear Velocity, dX/dt [m/s] 0 1 2 3 4 5 6 7 0 50 100 O u tp u t Po w e r, P ou t [W ] 0 2 4 6 8 -0.4 -0.2 0 0.2 0.4 0.6 0.8 1 Gear Velocity, dX/ dt [m/s] E ff icie n cy, [ ] 5 Copyright © 2012 by ASME
FIGURE 10. A SCHEMATIC SHOWING THE SHIFT IN CONTROL TIMING (SOLID) COMPARED TO THE INITIAL
CONTROL ALGORITHM (DASHED). RED INDICATES CHARGING, BLUE INDICATES DISCHARGING.
FIGURE 11. PLOT OF THE OUTPUT POWER AS A FUNCTION OF GEAR VELOCITY FOR SEVERAL OF TIMING SHIFTS
FIGURE 12. PLOT OF THE OUTPUT POWER AS A FUNCTION OF THE GEAR VELOCITY FOR THE FIXED AND THE VARIABLE TIMING THAT MAXIMIZES POWER OUTPUT
FIGURE 13. PLOT OF THE MECHANICAL EFFICIENCY AS A FUNCTION OF THE GEAR VELOCITY FOR THE FIXED AND THE VARIABLE TIMING THAT MAXIMIZES POWER OUTPUT
FIGURE 14. PLOT OF THE TIMING SHIFT THAT MAXIMIZES THE POWER OUTPUT AS A FUNCTION OF THE GEAR
VELOCITY DETERMINED THROUGH SIMULATION
FUTURE WORK
This simulation provided interesting and relevant initial findings but there are several areas still to explore. For the model, relevant dynamics may exhibit themselves at the higher frequencies at the keystone-gear interaction, including both compliance and friction. This creates a higher order model with more nonlinear terms. For the purpose of the simulation the amplitude of the gear was fixed, yet that is as easily changed a
ΔX
0 2 4 6 8 -10 0 10 20 30 40 50 60 70 80 Gear Velocity, dX/ dt [m/s] P ow er O ut pu t, Pout [W ] X = 0X = 0.0001 X = 0.0002 X = 0.0003 X = 0.0004 X = 0.0005 X = 0.0006 X = 0.0007 X = 0.0008 X = 0.0009 0 2 4 6 8 -10 0 10 20 30 40 50 60 70 80 Gear Velocity, dX/dt [m/s] P o w e r O u tp u t, P ou t [W ] Fixed Timing Variable Timing 0 2 4 6 8 -0.2 0 0.2 0.4 0.6 0.8 1 1.2 Gear Velocity, dX/ dt [m/s] E ffi ci e n cy, [ - ] Fixed Timing Variable Timing 0 2 4 6 8 0 0.2 0.4 0.6 0.8 1x 10 -3 Gear Velocity, dX/ dt [m/s] T im in g S hi ft, X [m ]design parameter as the pitch and could produce an increase in the performance. The control timing was explored, but needs theoretical and empirical verification.
CONCLUDING REMARKS
This paper presented the results from a dynamical analysis of a buckling-type amplification mechanism for PZT stack actuators that interfaces with a linear gear rack load. The dynamics were derived using the lumped parameter model of the mechanism. It was shown that there is an optimal speed that maximizes the power output for a given control timing. The characterized load can be matched to this optimal point by varying the pitch of the gear and thereby changing the gearing. Finally, by drawing upon the automotive industries variable valve timing, an exploration into the possible benefits of adjusting the control timing is presented.
ACKNOWLEDGEMENTS
This material is based upon work supported by the National Science Foundation under Grant No. CMSI-1000727. The authors thank Sumitomo Heavy Industries for their financial support.
REFERENCES
[1] Huber, J., Fleck, N., and Ashby, F., “The Selection of Mechanical Actuators Based on Performance Indices”.
Mathematical, Physical and Engineering Sciences, vol.
453, no. 1965, pp. 2185-2205, 1997.
[2] Juuti, J., Kordas, K., Lonnakko, R., Moilanen, V.-P., and Leppavouri, S., 2004. “Mechanically Amplified Large Displacement Piezoelectric Actuators”. Sensors and
Actuators A: Physical, 120, pp. 225-231.
[3] Yung, C., Or, S., Chan, H., Choy, P., and Liu, P., 2005. “Development of a Piezoelectric Induced-Strain Actuator with an Innovative Internal Amplifying Structure”. Smart
Structures and Materials, 22, pp. 22-33.
[4] Ardelean, E., Cole, D., and Clark, R., 2004. “High Performance “V-Stack” Piezoelectric Actuator”. Journal of
Intelligent Material Systems and Structures, 15, pp.
879-889.
[5] Fenn, R., Downer J., Bushko, D., Gondhalekar, V., and Ham, N., 1996. “Terfnol-D Driven Flaps for Helicopter Vibration Reduction”. Smart Materials and Structures, 5, pp. 49-57.
[6] Hall, S. and Tzianetopoulou, T., 2000. “Design and Testing of a Double X-Frame Piezoelectric Actuator”. Smart
Structure and Materials 2000: Smart Structures and Integrated Systems, vol. 3985, pp. 26-37.
[7] Prechtl, E. and Hall, S., 1999. “Design of a High Efficiency, Large Stroke, Electromechanical Actuator”.
Smart Materials and Structures, 8, pp. 13-30.
[8] Niezrecki, C., Brei, D., Balakrishnan, S., and Moskalik, A., 2001. “Piezoelectric Actuation: State of the Art”. The
Shock and Vibration Digest, 33, pp. 269-280.
[9] Secord, T. and Asada, H., 2010. “A Variable Stiffness PZT Actuator Having Tunable Resonant Frequencies”.
Transactions on Robotics, vol. 26, no. 6, pp. 993-1005.
[10] Neal, D. and Asada, H. 2010. “Dynamic Performance of Nonlinear 100X Displacement Amplification Piezoelectric Actuator”. Dynamic Systems and Controls Conference. [11] Neal, D. and Asada, H., 2010. “Phased-Array Piezoelectric
Actuators Using a Buckling Mechanism Having Large Displacement Amplification and Nonlinear Stiffness”.
International Conference on Robotics and Automation,
May, pp. 1661-1667.
[12] Torres, J., Asada, H. and Neal, D., 2011. “A PZT Array Actuator Using Buckling Strain Amplification and Preload”. Dynamic Systems and Controls Conference. [13] Zhang, Q. and Zhao, J., "Electromechanical properties of
lead zirconate titanate piezoceramics under the influence of mechanical stresses," Ultrasonics, Ferroelectrics and
Frequency Control, IEEE Transactions on, vol. 46, no. 6,
pp. 1518-1526, Nov. 1999.
[14] Barragan, P., Tsukahara, S., and Asada, H., 2011. “Design of Energy-Saving PZT Drive Amplifiers for Mobile And Wearable Physical Assists”. Dynamic Systems and
Controls Conference.
ANNEX A
TABLE OF SIMULATION PARAMETERS
Parameter Symbol Value Units Length of PZT Lp 50 mm
Mass of PZT mp 0.02 kg
Damping of PZT bp 2500 kg/s
Stiffness of PZT kp 1.19e5 N/mm
Damping of Joint bj 223 kg/s
Stiffness of Joint kj 4.76e5 N/mm
Mass of Keystone mk 0.262 kg Stiffness of Keystone ky 100 N/mm Mass of Gear M 2 kg Preload Length zp 42 μm Gear Amplitude A 2 mm Gear Pitch ω 0.785 1/mm
TABLE 1. TABLE OF THE PARAMETERS USED IN THE SIMULATION