HAL Id: hal-00301604
https://hal.archives-ouvertes.fr/hal-00301604
Submitted on 15 Apr 2004
HAL is a multi-disciplinary open access
archive for the deposit and dissemination of
sci-entific research documents, whether they are
pub-lished or not. The documents may come from
teaching and research institutions in France or
abroad, or from public or private research centers.
L’archive ouverte pluridisciplinaire HAL, est
destinée au dépôt et à la diffusion de documents
scientifiques de niveau recherche, publiés ou non,
émanant des établissements d’enseignement et de
recherche français ou étrangers, des laboratoires
publics ou privés.
visualization of large slope instabilities: two applications in the Western Italian Alps. Natural Hazards
and Earth System Science, Copernicus Publications on behalf of the European Geosciences Union,
2004, 4 (2), pp.197-211. �hal-00301604�
SRef-ID: 1684-9981/nhess/2004-4-197
© European Geosciences Union 2004
and Earth
System Sciences
G.I.S. technologies for data collection, management and
visualization of large slope instabilities: two applications in the
Western Italian Alps
M. Giardino, D. Giordan, and S. Ambrogio
Dipartimento di Scienze della Terra, Universit`a di Torino, Via Valperga Caluso 35, 10125 Torino, Italy
Received: 15 September 2003 – Revised: 27 January 2004 – Accepted: 30 January 2004 – Published: 15 April 2004 Part of Special Issue “Geo-databases for Natural Hazards and Risk Assessment”
Abstract. Large slope instabilities are gravitational
phenom-ena whose main characteristics are the multi-km2 area ex-tension and the complex geometrical, geomorphological and geomechanical settings. Several studies outlined their im-portance in spatial and temporal occurrence of natural haz-ards on wide mountain areas and their possible interaction in human activities.
For the study of large slope instability and deep seated slope gravitational deformations in the Susa and Aosta Val-leys (Western Italian Alps) a complete multiscale program (spatial and temporal) analysis has been performed, giving contributions to the reconstruction and settings of their pos-sible evolution.
A complex geodatabase has been created, including the-matic elements from field-data collection (geomorphology, hydrology, lithology, structural geology) and instability events analysis from data archives and remote sensing im-ages. To facilitate the management of a large amount of col-lected data a G.I.S. (Geographical Information System) has been developed, including two main levels of information: local and regional.
Local information is mainly devoted to detailed geothe-matic mapping of single instability phenomena. Clot Brun case study is presented, where original and derived landslide features have been elaborated through arithmetical and statis-tical operations, in order to identify different instability zones and to assess displacements and state of activity through-time.
Regional information collected for a landslide inventory of Aosta Valley (IFFI project) summarizes historical and remote sensing data, combined with metadata from local analysis, in order to assess spatial and temporal hazards. To avoid prob-lems of data accuracy (quality and positioning) due to dif-ferent source archives, a semi-automatic system for selection and validation of data has been created, based on their spatial characteristics (buffer analysis and control).
Correspondence to: M. Giardino
(marco.giardino@unito.it)
G.I.S. technologies have been used to archive, manage and visualize collected data through 2-D and 3-D models of sin-gle case studies and regional distribution of large slope insta-bilities.
1 Introduction
Geological and geomorphological studies outlined the im-portance of large slope instabilities and deep seated gravi-tational slope deformations in conditioning spatial and tem-poral occurrence of natural hazards on wide areas of moun-tain regions (Mortara and Sorzana, 1987; Azzoni et al., 1992). Recent climatic changes extend the influence of large slope instabilities over higher quota areas, where gravita-tional slope processes interact with permafrost degradation phenomena (Dramis et al., 1995). In the meantime, larger diffusion of human impact on mountain regions enhances the possible local interference of gravitational phenomena with man-made structures (Aydan, 1992).
The necessity of a better recognition and mapping of large slope instabilities, and of a related hazard and risk assess-ment, forced scientific institutions, administrative agencies and consultant enterprises to develop new strategies for data collection and management through the application of com-puter techniques. Several digital databases on landslides and large slope instabilities have been started all over Europe in the last decade (Dikau et al., 1996) and different Geographi-cal Information Systems have been applied to these phenom-ena for different purposes, from visualization and represen-tation of the data, to spatial analysis and modelling.
Nevertheless, the application of digital techniques to large slope instabilities is not yet fully satisfactory in term of reaching a univocal definition for such phenomena, nomen-clature of internal features, interpretation of evolutionary stages and hazard zoning. According to some authors, this fact could be related to the extraordinary and enigmatic na-ture of large slope instabilities and deep-seated gravitational slope deformations (Crosta and Zanchi, 2000).
torical) and remote sensing images (aerial photographs and satellite images). To facilitate the management of a large amount of collected data a systematic structuring of the geo-databases has been developed, including two different data levels of information: local and regional. The different data levels seemed to be essential in the case of large slope in-stabilities, their local interpretation and regional distribution recognition are yet not fully satisfactory.
Large slope instabilities are huge gravitational phenomena affecting mountain slopes. Their main characteristics are the large area extension (multi-km2) and the complex geometri-cal, geomorphological and geomechanical settings (Crosta, 1996). This category of slope instability may include sev-eral different phenomena indicated by the scientific literature with different names, according to:
- surface dimensions (“large landslides”: Stini, 1952); - thickness of the involved slope portion (“deep-seated
gravitational deformations”: Jahn, 1964; Beck, 1968; “deep-reaching gravitational deformations”: Mahr, 1977; Nemcock, 1972);
- deformational styles (“sackung”: Zischinski, 1969; “deep creep”: Ter-Stepanian, 1966; “lateral spread-ing”: Nemcock and Rybar, 1968; “large block slid-ing”: Zaruba and Mencl, 1969; “gravitational spreading of ridges”: Varnes et al., 1989; “sturzstroms and rock avalanches”: Hs¨u, 1975);
- the alleged causes (“gravity tectonic phenomena”: En-gelen, 1963; “glacial valley stress release”: Ferguson, 1967);
- age of formation (“paleolandslides”: Carraro et al, 1979);
- time-interval of activity (“long term gravitational defor-mations: Chighira, 1992).
Large slope instabilities have been studied all over the world but their original recognition and first studies have been con-ducted in the Alps, where they affect wide sectors of the mountain relief. Historically there have been two different kinds of approach in the studies of large slope instabilities: the “geomorphological” and the “structural” point of view.
- stratigraphical and sedimentological data on surficial - deposits;
- lithological and geostructural data on bedrock units; - hydrological data on surface and underground water; - geotechnical and other monitoring data on deformed
materials and deformational features;
- pedological and vegetational data on land use and soil units;
- historical data from archives on past events.
Different data sources mean different acquisition methods and, possibly, different data formulations. To this point, sev-eral examples are possible:
- in the case of field surveys, traditional sketch-maps and textual/visual descriptions can be derived;
- from geotechnical in situ analysis and remote sensing studies, single-point and area distribution of numeri-cal data concerning land physinumeri-cal properties can be ob-tained;
- from microscopic analysis of rock-forming minerals, geometrical not-mappable data
A so-complex multi-disciplinary research has to comply the interpreting requests of different variables overcoming the difficulties of their different formulations.
2 Multidisciplinary and multiscale data management
An effective way for the acquisition and the treatment of multidisciplinary data on large slope instabilities and their mutual relationships in the mountain features consists in us-ing standardized research procedures and computer methods in order to organize the data in a special structure (“geo-database”).
As in the case of landslides, starting from the first stages of field activities, it is possible to collect data in a formalized way (WP/WLI–UNESCO, 1990, 1991, 1993, 1994, 1995);
if this procedure is appropriately applied, it allows to ob-tain many modular information, with clear mutual conceptual links, and easy to be managed (Amanti et al., 1996; Baggio and Giardino, 1998). For every geological, geomorphologi-cal, geotechnical element or object (“entity”), the identifica-tion criteria and the geometric and alphanumeric properties that characterize it (“attributes”) must be specified. In fact, a geodatabase organization foresees a careful geological anal-ysis in order to understand useful information (informative content definition) and their different relationships, for the elaboration of a conceptual scheme.
Nevertheless, in the study of wide and complex phenom-ena such as large slope instabilities, the usage of a sophis-ticated geodatabase is often insufficient if it is not inserted in a Geographic Information System (G.I.S.). A G.I.S. is a system “designed to support the capture, management, ma-nipulation, analysis, and display of spatially referenced data for solving complex planning and management problems” (Federal Interagency Coordinating Commettee, 1988: in An-tenucci et al., 1991). Among their properties, G.I.S. tech-nologies make easier multiscale analysis of spatial and tem-poral distribution. This property is of great benefit in the case of studies concerning large slope instabilities; in fact, to ob-tain valid interpretative models of this type of gravitational phenomena it is necessary to manage different dimensional scales, both in time and space. First of all, at a regional scale of analysis, large slope instabilities show unequal distribu-tion in the mountain features due to their different geomor-phological, litho-structural and tectonic settings (Varnes et al., 1989). Moreover single large slope instabilities do act on vast areas, but in a heterogeneous way as deformation entity and activation time. The slow and progressive movements that characterize most parts of these phenomena are followed in some cases by sudden accelerations, sometimes with local paroxysmal episodes. As an example it is possible to recall the disastrous San Giovanni’s landslide occurred in Ossola Valley, NW-Alps (Regione Piemonte et al., 2002).
Modern G.I.S.s allow easy loading structures and complex data management. Nevertheless, in a complex geodatabase realization, this important potential capabilities can lead to self-defeating because of the difficulty in the operational data insertion. Therefore, an easy and rapid access structure must be offered to the geodatabase users, for data loading and con-sulting: it has to contain an adjusted number of fields for the specific study on large slope instabilities.
Based on the level of detailed investigations regarding landslides and large slope instability phenomena, it is pos-sible to separate specific geodatabases in two macro-classes: A – Local, single phenomenon geodatabases.
B – Regional, or national scale geodatabases.
Their differences essentially consist in the scale of analysis, which has repercussions on the geodatabase structure and on the total number and type of available fields.
In Case A, the local geodatabase has to achieve the largest possible amount of data from field observations (geologi-cal and geomorphologi(geologi-cal mappings, hazard and risk anal-ysis, geomechanical measure stations) and from the
monitor-ing systems installed in the instability zone (extensometers, fissuremeters, GPS monitoring networks, etc.). It also re-quires other fields for geotechnical properties of the involved bedrock units and surficial deposits obtained from laboratory testing. The main purpose of a research involving a local geodatabase consists in the search and storage of all those possible data capable to define the most univocal model of the studied large slope instability, as well as realizing a pos-sible zoning of the phenomenon, either from a geomorpho-logical/structural reconstruction or from a hazard assessment point of view.
Case B foresees a lower detail of the data collection, mak-ing greater attention to all the useful sources for a general description and individualization of the large slope instabil-ity with respect to several other similar phenomena in the region. This type of geodatabase loads data from historical files, newspaper information, technical reports compiled dur-ing the first surveys, subsequent remote sensdur-ing studies, and later on-the-spot investigations. So, regional geodatabases consist of extremely heterogeneous data, from very different sources, often compiled by not experienced employees. For these reasons, their complicated operation deals with a great number of problems (Brunsden and Isben, 1996).
Recent G.I.S. developments, in natural hazards and risks assessment and management, introduced new possibilities for the interaction of local and regional data sets. The use of multi-scale Land Information Systems (G.I.S. devoted to territorial data management) for the development of Decision Support Systems suggested the opportunity to activate links between informative levels for regional-scale files manage-ment (geodatabase B) and detail analysis (geodatabase A). Still, the separate storage of these information has to be maintained if a homogeneous nature of each informative layer is needed. Some zones of the merged A and B in-formative levels with notable massive information might be surrounded by areas with poor nature and density of infor-mation.
For each case study the main characterization of geo-database (on large slope instabilities present a local and a regional geodatabases developed in the perspective of a fu-ture integration. For each main characteristics of the geo-database (definition of data type, hierarchical organization and data management model) will be described. Then, prob-lems found out during geodatabase operation and solutions offered by G.I.S. technologies will be discussed.
3 Single phenomenon geodatabase (local)
3.1 Introduction
A detailed characterization and interpretation of large slope instability phenomena is possible through analysis and syn-thesis of a complete series of field data integrated with re-mote sensing information. As an example of the working procedure, the G.I.S. project for the Clot Brun large slope instability (Susa Valley, Western Italian Alps) is presented
Fig. 1. Digital elevation model of the Clot Brun sector, left side of
Susa Valley, northwestern part of the Italian Alps.
below, where singles geomorphic, geo-structural and surface deformational elements have been individualized and col-lected in a geodatabase and interpreted for their geometry and kinematics.
3.2 The Clot Brun case study
The multidisciplinary study of the gravitational instability phenomenon of the Clot Brun slope has been drawn up as an experimental investigation methodology finalized to forecast and to prevent the hydrogeological hazard in a mountainous region. In particular, the methodology has been developed for the optimal organization of selected data on large slope instabilities.
From a geological point of view, the Clot Brun large slope instability covers an inner area of the Western alpine structure (Penninic Domain). Here, lithotypes (micaschists, metabasites) of the crystalline basement of the Ambin Mas-sif outcrop together with a metamorphic cover (dolomite and calcite marbles) aged perm-mesozoic (Callegari et al., 1980). Calcschists belonging to the Piemontese Zone outcrop in the eastern sector of the studied area (Polino et al., 2003).
The Clot Brun large slope instability occupies a wide sec-tor (total area: 18 km2) of the left side of the Middle Susa Valley, which is characterized by evidences of deep seated slope gravitational deformations and several landslide ac-cumulations (Fig. 1). The largest landslide covers about 2.8 km2and is defined by many morpho-structural elements. The upper part of the large slope instability is character-ized by a double-crest ridge, several elongated depressions, two sub-parallel major scarps. The western part of the up-per scarp (elevation: 2400 m a.s.l.; Fig. 4d) is formed by a fault surface inclined 50–60◦ towards S and SE, settled in dolomite marbles. It’s characterized by strips of breccias with sharp angled heterometric clasts cemented by a carbon-ate matrix, probably due to dissolution and re-precipitation of carbonate by seepage water. The apparent dislocation is about 25 m.
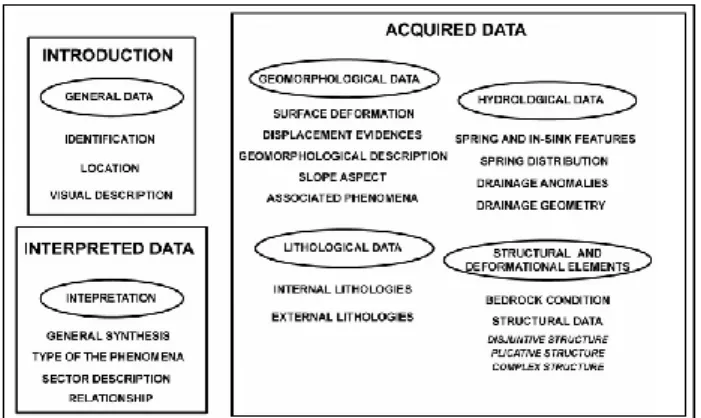
Fig. 2. Database structure. The thematic sections can be divided
into three categories: general representation of the large slope in-stability phenomenon (“introduction”); in detail surveyed data (“ac-quired data”); data interpretation and description of the gravitational phenomenon based on its activity state, as well as individualization of the different kinematics behaviour zones (“interpreted data”).
Between elevations 2150 and 1850 m a.s.l., the slope is mainly formed by shifted and loosen rock masses alternated to debris cover. This part of the slope is also characterized by scarps and trenches, by recent cuts of the turf and by small rock falls, in particular along the left flank of the large slope instability. As well, in correspondence with the edges of the area involved in the gravitational phenomenon, there are N–S and NNW–SSE stretched depressions with longitu-dinal directions compared to the border of the deformed area. These depressions represent zones of differential strike-slip displacement; their directions correspond to those of the prin-cipal joint systems through the rock mass in this sector.
It is no more possible to see evident large rock masses pre-served and shifted downwards below elevation 1850 m a.s.l.. The slope turns out to be mainly formed by large size de-bris. In the lower part of the large slope instability, the major landslide deposits lay on moraines or roches mouton´ees (Gi-ardino and Fioraso, 1997).
3.3 Geodatabase structure
The major working stages of Clot Brun local geodatabase have been:
1) Relational database structure, for a standardized field and remote sensing data collection and for storage; 2) Geothematic mapping and data implementation through
G.I.S. technologies (example displacement map); The relational geodatabase structure, developed through Microsoft Access application, is constituted by a series of data files connected by primary keys (“ID landslide”: identification of single instability phenomenon; “ID loc”: survey location of features or measures site) in which the alphanumeric data are inserted and organized (attributes)
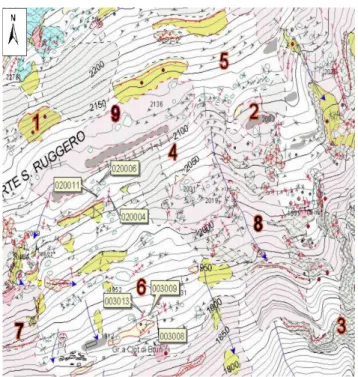
Fig. 3. Geomorphological Map (original scale 1:5000). Example
of connection between local identification code (“ID loc”: 020006) and surveyed geographical entity dealing with geological and geo-morphological elements: 1) talus sheet; 2) level; 3) fractured rock; 4) elongated ridge; 5) counterslope; 6) trench; 7) scarp; 8) drainage line; 9) closed depression.
related to the selected geological-geomorphological ele-ments (entity). The charts are subdivided into sections and visualized throughout masks for a simple and functional use of the database (data entry, query). In addition, a Geographic Information System (G.I.S.) has been associated to the database for a territorial restitution of the geomorphological, geological and deformational elements and for the elabora-tion and synthesis of the data (Fig. 2).
Introduction – General data
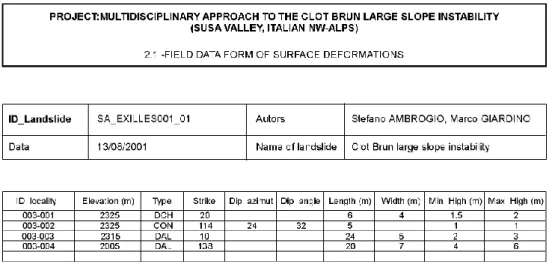
In this section, the geodatabase foresees the compila-tion of a first group of informacompila-tion about the gravitacompila-tional phenomenon, including its territorial context (distribution by elevation, total area, cartographic and hydrographic location), the author of the compiled form and the sur-vey period, a brief description and an image (picture, drawing or cartographic sketch map). The alphanumeric identifying code (“ID landslide”) of the gravitational phe-nomenon is of primary importance in this phase (example “SA EXILLES001 01”). It will allow creating a relation structure of the database, through the univocal identification of each phenomenon.
Acquired data
The whole geomorphological, hydrological, lithologi-cal, structural and deformational data make clear references to the locations (observation points) where they have been recorded during field surveys on the gravitational phe-nomenon. Such points have been encoded (“ID loc”) with a progressive reference number of 6 figures (es. “010003”), whose first three figures are referred to the location and the last three indicate the progressive number of the single geological/geomorphological elements surveyed inside the same location. This code allows inserting a large number of geomorphological or structural elements for the same site. The identification code “ID landslide” has been used (Fig. 3) for the geomorphological, hydrological, lithological, structural and deformational data related to the entire gravitational phenomenon.
Geomorphological data
The typical deformational elements connected to the large slope instability have been reported, such as: “geomor-phological anomalies” (for example: counterslope “CON”, elongated ridge “DOL”, closed depression “DCH”, level “LVL”, elongated depression “DAL”, scarp “SCA”; Fig. 4), and present-day “slope movement markers” (for example: manufacture damages, tree rotations). They are described through a series of fields containing data about their geome-try and kinematics. A general geomorphological description of the whole gravitational phenomenon and its possible subdivision into parts (sectors) has been furnished with their special characteristics (surface conditions, remodelling degree). All the associated minor gravitational phenomena and other geomorphological processes induced by the large slope instability have also been described (ex.: shallow landslide, debris flow, gully erosion, accelerated torrent erosion).
Hydrogeological data
This section collects descriptions of springs, absorption points and their distribution within the instable slope. Also, it reports on drainage anomalies and other characteristics and evolution variations of the original hydrographic system. Data separate hydrogeological conditions and phenomena inside the instability area from those that are external. Data collection also points out the hierarchization level and the drainage density of the local hydrographic network.
Lithological data
In this section, information about nature of rock out-crops and/or surficial deposits are collected, either from the slope portion affected by the gravitational phenomenon, either from the surrounding zones. Data comparison offers useful input for pre-instability slopesetting reconstruction.
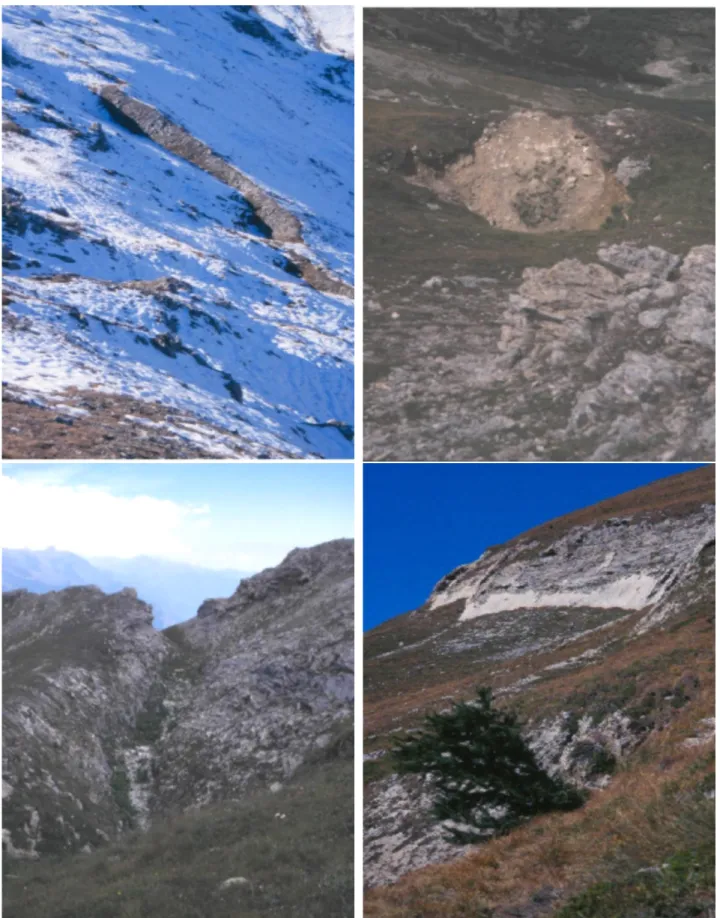
Fig. 4. Surficial deformations and structural elements of the Clot Brun large slope instability: (a) counterslope (b) closed depression (c)
Structural and deformational data
Here, it is possible to find descriptions of faults (FGL), fractures (FRT), trench (TRE) and other structures and surficial deformations (see Fig. 4): their geometrical char-acteristics, kinematics indicators and state of activity are indicated. Description takes place on two levels: firstly, general description and identification of the structure, and secondly, detailed analysis. General interpretation divides structures by types of deformation: disjunctive, plicative and complex. A fracturing degree of bedrock is also indicated through a quick qualitative classification of structural discontinuities frequency and characteristics.
RSN = intact rock (a few minor structural discontinuities) RFR = fractured rock (several closed structural discontinu-ities)
RRL = loosen rock (open fractures)
RDS = disjointed rock (very open fractures with rotated rock blocks)
ACC = rock block accumulation (no more rock mass integrity).
Interpreted data
The last thematic section represents the results of data analysis. Through the interpretation of the geomorpholog-ical, hydrologgeomorpholog-ical, lithological and structural elements, it is possible to realize a “zoning” of the studied area and to individualize evolution history and instability trends of each sector. In the case of Clot Brun large slope instability, several minor zones and two main sectors interested by different deformational styles and state of activity have been individualized (Fig. 5).
3.4 Standard model for data collection
During the surveys this database foresees the usage of fill-ing forms to allow an effective analysis of all the structures, elements and necessary forms in order to individualize and determine the gravitational phenomenon (Fig. 6).
3.5 G.I.S. technologies
A G.I.S. system has been used regarding the surveyed ele-ment insertion in their territorial context. Every single geo-logical and geomorphogeo-logical entity has been individualized by the map geometry that best represents it. Two primary keys of identification (“ID loc” and “ID landslide”) have been used for reporting G.I.S. geographical entity records with its associated attributes in the database. This way a 1 to 1 relationship has been created.
The external local geodatabase associated to G.I.S. al-lowed an easy management and organization of the great number of geological-geomorphological data.
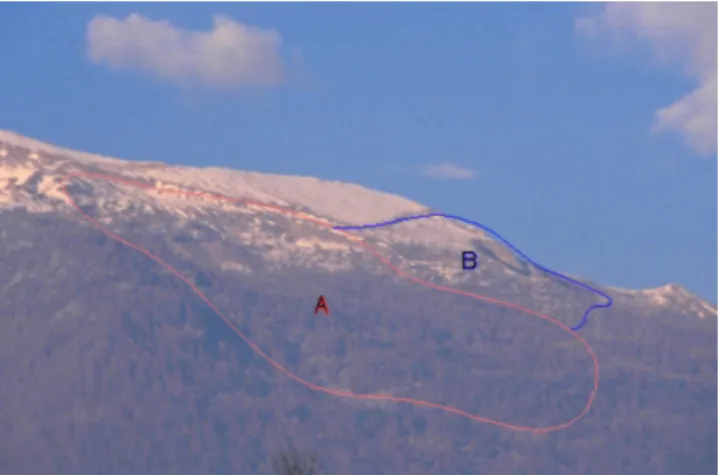
Fig. 5. Overview of the Clot Brun large slope instability and main
“sectors” with different deformation style and state of activity. (A) Western sector characterized by geomorphological and structural el-ements that might represent a quiescent state of activity. (B) Eastern sector characterized by a higher activity degree but a minor dis-placement entity.
3.6 Thematic mapping
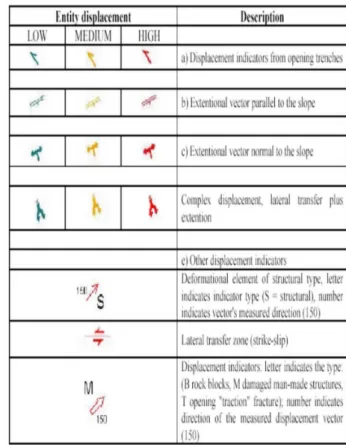
A “displacement evidences map” has been created through the selection of special deformational markers (trenches, opening fractures, damaged man-made structures, shifted bedrock outcrops), the extrapolation of dimensional (geome-try of the structure, kinematics vectors and displacement en-tity) and non-dimensional attributes (state of activity). A fi-nal classification of the kinematics meaning of different de-formational elements has been suggested (Fig. 7).
The procedure for displacement evidences map processing has been structured in the following steps:
1 Individualizing and cataloguing of displacement fea-tures;
2 G.I.S. extrapolation of geometry, kinematics and state of activity;
3 Reclassification of displacement features based on kine-matics meaning, (extensional, compressional, lateral transfer and complex structures);
4 Calculation of “d” parameter (displacement en-tity = (W/L) × p) W = width; L = length; p = activity grade (3 active, 2.5 quiescent, 2 inactive);
5 Homogeneous classification of displacement evidences based on “d” parameter and geothematic mapping (class 1: low entity displacement; class 2: medium en-tity displacement; class 3: high enen-tity displacement; see Fig. 8).
Fig. 6. Example of field data form for surficial deformations survey.
Fig. 7. Examples of displacement evidences: (a) opening fracture, (b) sliding.
4 Regional geodatabase
4.1 Introduction
To illustrate the characteristics of a regional or national scale geodatabase, the application has been made to the inventory of landslides and deep seated gravitational deformations in the Aosta Valley Region. The geodatabase has been
struc-tured using the existing Italian National Inventory of Land-slides (“IFFI” Project – “Inventario dei Fenomeni Franosi in Italia”; Amanti et al., 2000a), promoted by the National Geologic Survey of Italy (SGN). The data insertion within the “IFFI” inventory has been delegated by SGN to the ge-ological surveys of the different Italian Regions. Regional geodatabase improvements and landslide data management in the Aosta Valley Autonomous Region has been realized
Fig. 8. (a) Map of displacement evidences; (b) legend.
through the joint efforts of regional officers (Servizio Car-tografico - Regione Autonoma Valle d’Aosta) and university researchers (Dipartimento di Scienze della Terra – Universit`a di Torino).
4.2 Overview of the Aosta Valley
The Aosta Valley, the smallest Italian region with an area of 3.262 km2, is one of the major alpine valley systems, sur-rounded by the highest peaks of the Pennine and Graie Alps. It covers the whole mountain zone of the Dora Baltea hydro-graphic basin.
From the geological point of view, Aosta Valley belongs to the Western Alps, the axial zone of the alpine chain, where an imbricated stack of continental crust and oceanic units take place (Dal Piaz, 1992). They are the result of the convergence phenomena between the European and In-subric (“Adria”) paleocontinents (Polino et al., 1990). Aosta Valley crosses through the greatest structural systems of the Europe-verging inner part of the Alpine chain: Austroalpine (correlated to the Insubric margin), Penninic systems (mul-tilayer system with preserved oceanic and continental crust sheets); and the Helvetic-Dauphinois system (European fore-land involved in the alpine orogenesis). The alpine tectonic-metamorphic units show evidences of a long-term tectonic activity (“ductile” to “brittle” alpine deformations) and the neotectonic activation of regional shear structures (example
Aosta-Ranzola’s fault; Ballevre et al., 1986). All these geo-structural characteristics influence the alpine relief evolution and uplift (Hunziker et al., 1992) and the mountain slope dy-namics (Giardino and Polino, 1997).
Among the morphodynamic factors influencing the geo-morphology of the Aosta region, the glaciers have been the most important, especially during the Pleistocene. The val-ley conformation preserves, at different scales, direct traces of the glacial modelling (Carraro and Giardino, 2004), both as erosional and depositional landforms. Glaciers also influ-enced indirectly the past and present-day slope dynamics be-cause of the pressure released by the retreat of glacial masses (Panizza, 1974).
The watercourses activity affects the Aosta Valley’s ter-ritory through the progressive deepening into valley sides and valley bottoms mainly by erosion of glacial landforms and deposits. Important fluvial and torrent depositional land-forms are also visible along the valley bottoms and the al-luvial and “mixed” fans, mainly created by debris-flow phe-nomena, as shown during recent heavy meteorological events (example 13–16 October 2000; Ratto and Bonetto, 2003).
A fundamental role in the profiling of the Aosta Valley is also played by gravitational phenomena, which vary in size and typology: from simple, shallow landslide (mainly soil slips, in terms of spatial distribution and frequency; and planar and rotational sliding), to large slope instability
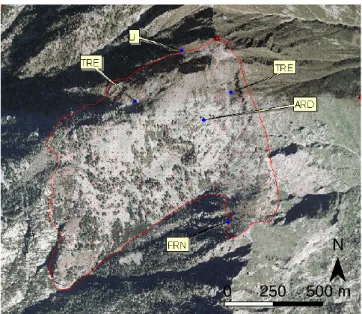
Fig. 9. Example elements used as “anchor points/elements” for
large slope instability recognition. LI = uncertain limit caused by recognition difficulty; TRE = deep seated deformational trench; ARD = disjointed rock heap; FRN = fracture.
phenomena, mainly deep seated slope gravitational defor-mations. The latter are widespread in Aosta Valley Region. They cover at least 12% of the total area.
In the application of the IFFI Project to Aosta Valley, the study of regional distribution of landslides and deep seated slope gravitational deformations have been coupled with local detailed geological and geomorphological surveys of single phenomena, in order to detect their triggering and controlling factors, deformational processes and evolution stages.
4.3 The IFFI Project and the Aosta Valley regional geodatabase
The forewords of the Aosta Valley regional geodatabase are the SGN’s management and the insertion data structures for the IFFI Project, which foresees the realization of a G.I.S. on landslides with shape files and a connected database (Amanti et al., 2000b, 2001a, b).
As previously mentioned, a geodatabase for re-gional/national information management is usually projected for collecting data of different nature and sources. In the Aosta Valley, the first phase has been dedicated to a system-atic analysis of national and regional data banks on slope instabilities:
- AVI (Italian affected sites by mass-movements and floods);
- River Basin Authority database;
- CNR – IRPI (National Research Council – Research In-stitute for hydrogeological protection
- Turin Section) database;
Correlated geomorphologic Rock glacier RCG elements
Limits Uncertain limits LI
- Aosta Valley’s Region Forestry Survey;
- Aosta Valley’s Regional Information System and City planning of the investigated area.
At the same time, slope stability analysis has been performed by photo-interpretations for the regional territory, with par-ticular detailed analysis to the regional zones uncovered by the “CARG” project (Cartographic and Geological project for the new Geological Map of Italy, 1:50 000 in scale). During the photo-interpretation study, a series of “anchor points/elements” (Table 1; Fig. 9) have been recognized and mapped on a specific information level. These are geo-morphological and geological elements possibly connected to slope instabilities: for their mapping representation, a dedicated applied geomorphological legend has been used (GNGFG, 1994).
Instability phenomena described in various consulted his-torical archives have been represented in a punctual way. Such decision was taken because of the heterogeneous data detail. One of the most productive sources, in term of num-ber and geographical distribution of events, has been the Re-gional Forest Survey archive. Unfortunately, despite the de-tailed reports on temporal occurrence of natural instability phenomena, this archive did not showed maps to clearly iden-tify the instability areas. It was often only possible to locate the involved slope without delimiting single instability phe-nomena and gravitational features (punctual information).
One of the greater risks when improving data files with already existing information (imported records from other archives) is the events duplication. During the data analysis it is likely that the same operator in different times, or ferent operators might insert, from different sources, two dif-ferent records reporting to the same instability phenomenon without recognizing their coincidence both in time and space. Often, even experienced and careful operators are not able to recognize the events duplication, due to the large number of
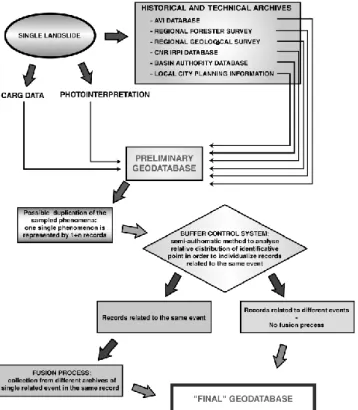
Fig. 10. Conceptual scheme of the “buffer control” process in the
general IFFI Project geodatabase structure. In case of record dupli-cation of the same event, fusion process will be realized.
records. Working at a regional scale it is therefore necessary to study a procedure able to minimize duplicated records.
A first solution consists in a cross data comparison inside the geodatabase (for example to identify all the records hav-ing the same date, typology and administrative territory). But this analysis doesn’t seem to be competitive if compared to the time involved for each control.
Another solution is to exploit the G.I.S.’ capabilities, by using a semi-automatical control procedure based on the spa-tial position of the informative content (Fig. 10). The pro-cedure elaborated and applied to the IFFI Project of Aosta Valley can be schematized in 4 steps:
- Creation of a 150 m-wide “pre-arranged buffer” of all the record’s geometries derived from different data source (example photointerpretation and historical archives analysis). Buffer width has been chosen after testing best fits of data correlation.
- Individualization of the cases in which overlap exists among the created buffers.
- Evaluation of the “correlation degree” of the two records through the database analysis and, eventually, also through the control of original documents.
- Possible “data fusion” by finishing one of the two records with the other’s information and the consequent elimination of this last one.
Fig. 11. Example of the buffer application: red area - landslide
ge-ometry; green area - buffer geometry of landslides (width: 150 m). Blue triangle is the identifying point of the landslide; green points correspond to historical data associated with photo-interpretative geometry; violet points are historical data not associated with photo-interpretative geometry; red points are historical data not considered in buffer control
Such procedure has given good results both regarding the data file analysis and the “correlation degree” between pho-tointerpretation and historical data. In this last case, the en-couraging results allowed to couple the photointerpretation geometry to the archival data, obtaining the complete phe-nomenon description (Fig. 11).
The “correlation degree” control through the analyzed records requires relatively long time. In some cases, with information at disposal, it has been impossible to confirm neither to deny the correlation degree. Some of these cases have been later resolved thanks to the acquisition of further information. For this reason, it seemed better to define four correlation degrees:
- Surely correlated data.
- Potentially correlated data: data with a certain degree of correlation but for which it is not correct to proceed to the fusion process without further information.
- Not correlated data.
- Not examined data because not selected throughout a buffer.
Among the total data processed in the Aosta Valley IFFI Project, about 30% was derived from the buffer control pro-cess. Among these latter, 25% corresponds with clearly
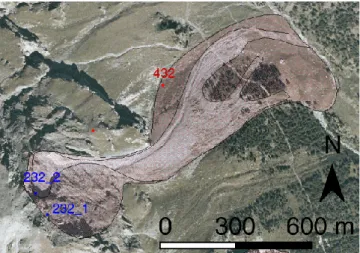
Fig. 12. Two landslide events are recognized by the cross
anal-ysis of historical data and photointerpretation. ID 232 2 and ID 232 2 are the photointerpretative geometries, ID 432 is the histori-cal record related to a 1996 event. Through complete buffer control, ID 232 2 geometry has been correlated to ID 432 data.
correlated data (with the fusion and suppression of the du-plicated record), 55% concerns the non-correlated, while the remainder 20% is constituted by doubtful cases.
The comparison of different data sources allows enrich-ing the IFFI cartographic (mappenrich-ing?) database and precisely confining a certain landslide phenomenon verified in the past. In some particular cases, inside a landslide area derived from photointerpretation, it’s possible to identify different events by cross analysis of historical data (Fig. 12).
In other cases, archival searches have been fundamental for identifying some historical phenomena hardly noticeable through aerial photointerpretation. For example, in high Val d’Ayas, a series of gravitational phenomena in glacial and periglacial environments are known, among which the Fe-lik Landslide occurred near the Quintino Sella shelter, 4 Au-gust 1936. The Felik landslide involved around 200 000 m3 of gneissic rocks that fell on the underlying Perazzi Glacier, propagating as a rock-ice avalanche. In this case, the contem-porary use of historical documents (see Bottino et al., 2002 for references) and the photointerpretation analysis allowed reconstructing the affected area (Fig. 13) with higher preci-sion than in other cases.
A long-term multitemporal geometry analysis by histori-cal data is very useful, but available in very rare cases, in particular those where very detailed data files are available. Multiscale and multitemporal analysis can be enhanced by using different aerial surveys. Through the sharpening of the proposed approach, the following phases of the Aosta Val-ley’s regional geodatabases should allow close examinations on slope dynamics and more precise control and individual-ization of historical phenomena. Some tests have been con-ducted, with particular regard to deglaciated areas and sec-tors of present-day active landsliding (Champlong landslide, Lillaz; DSGD of Cervinia, Hone-Bard, Villeneuve, Quart).
Fig. 13. Felik Landslide (AD 1936). The phenomenon area has
been drawn through the integrated usage of the historical data (ID of file 514) and the photo-interpretation.
5 Discussion and conclusions
Geodatabase structuring into different levels of information allows easier management of large amount of multiscale data collected from multitemporal studies on large slope instabil-ity phenomena. To optimize the functionalinstabil-ity of the local and regional geodatabases, and to allow an easier integra-tion of the two, some changes were necessary in the single geodatabases original structures. These modifications up-graded the results and solved information management prob-lems verified during the case studies.
A list of main problems still affecting local and regional geodatabases, and some suggestion for possible modifica-tions and future improvements in the perspectives of their better integration in a complete information system are de-scribed below.
5.1 Local, single phenomenon geodatabase
The Clot Brun Local geodatabase has been structured to per-form a complete collection of measurements and observa-tions on deformational features (example trench, counters-lope, fault). This collection has to be repeated in time to be effective in term of analysis of state of activity. The storage of large amount of collected data was not easy, be-cause of the measurements/observations repetition. There-fore “duplications” were necessary for the consecutive mea-surements/observations: however, they have been referred to an already known territorial/informative context.
A simplification landslide code is therefore recommended (example SA EXILLES 001), so that it only exists one identification code both for every single gravitational phe-nomenon and for all associated entities; a “data” field has to be added for every single database entity. This way, the relationship will no longer be one-to-one but one-to-many
between the database and the G.I.S. project. Besides re-solving the gravitational phenomenon repetition problem, the systems potentialities will be enhanced for practical data in-sertions and multitemporal surveys.
An insufficiency of the geodatabase is the lack of special sections dedicated to consequential measurements by exten-someters, fissuremeters, GPS monitoring. This type of data is extremely effective for state of activity identification in the large slope instabilities and their internal sectors. Therefore the creation of an activity field (“active”, “not active”, “qui-escent”, “indeterminate”) would be advisable to add to the form for data collection and management. Best definition on activity of surface deformations, displacement evidences (ge-omorphological data), structural and deformational elements (structural data) makes easier to elaborate and extrapolate the data for the thematic mapping (e.g. displacement evidence map).
The good results reached by the Clot Brun local geo-database elaboration and application, (data research com-pleteness, different activity degree instability sectors subdivi-sion, simple and accurate data elaboration) makes it possible to apply the same methodology to other large slope insta-bility cases. It will help in better geomorphological hazards evaluations, for instance by localizing the potential zones to install new monitoring systems for slope instability control. 5.2 Regional, or national scale geodatabases
Regional geodatabase also receives data from very different sources. The principal problem when acquiring these data is related to their different reliability degree. Often the lack of technical-scientific preparation on large slope instability phenomena by operators that first surveyed the zone does not always allow the same information detail and accuracy.
So, careful preventive evaluation phase of the reliability degree will be necessary when planning and loading the geo-database.
According to the reliability degree, the data will be treated with a different detail level in the information system: throughout a punctual-type geometry, for the less reliable sources (some historical archives), and with a more articu-lated geometry, for higher reliability sources (example origi-nal photointerpretation).
Regional geodatabase are usually applied to regional data files inserted in a medium to long-term projects where a large number of operators are involved. The risk of the duplication phenomenon is always present and it must be treated imme-diately. The proposed individualization process of the dupli-cated data and their fusion can solve the problem.
5.3 Final remarks
The geological and geomorphological field researches con-nected to local and regional analysis on large slope instabil-ities showed how the use of the G.I.S. technologies is desir-able for a correct management of a geodatabase. This calls for different informative levels with different detail degrees
for the two geodatabases. The information coming from the elaboration of two separate archives with single informative levels would produce in fact a strong heterogeneity both in the information, and in their spatial distribution. Neverthe-less, an independent management of one geodatabase from the other must be avoided because their informations are complementary.
Therefore the best solution consists in the use of the same phenomenon identification system (use the same “ID landslide” in the two databases) or to conceive a more complex system able to allow an information interchange among the two geodatabases.
The presented G.I.S. methodology applied to local studies of single slope instability phenomena allows locating homo-geneous sectors internal to the same landslide, differentiating deformational behaviour and state of activity of single parts. Data collection and organization from several historical and technical archives, connected to original field and remote sensing studies at a regional scale, allows statistical analysis for large areas landslide characterization. Through local and regional geodatabases information interchange, easier hazard assessment studies are therefore possible, offering better data for land use and planning.
Acknowledgements. The research on the “local” geodatabase of Clot Brun large slope instability has been financed by the INMR -Italian National Research Institute on Mountain Environment. The researches on the “regional” geodatabase of large slope instabilities in Aosta Valley have been jointly supported by the Aosta Valley Autonomous Region and the University of Turin (“IFFI” Project fund) and by the Italian Ministry for the University and Researches (MIUR- Cofin 2002 fund).
Edited by: R. Couture
Reviewed by: P. Deline and another referee
References
Amanti, M., Casagli, N., Catani, F., D’Orefice, M., and Mot-teran, G.: Guida al censimento dei fenomeni franosi ed alla loro archiviazione, Istituto Poligrafico e Zecca dello Stato, 109, 1996. Amanti, M., Bertolini, G., Cara, P., Chiessi, V., De Nardo, M. T., Martini, M. G., Damasco, M., and Ventura, R.: Progetto Inven-tario Fenomeni Franosi (in Italian), Allegato tecnico per la real-izzazione del progetto IFFI, 5, 2000a.
Amanti, M., Bertolini, G., Cara, P., Chiessi, V., De Nardo, M. T., Martini, M. G., Damasco, M., and Ventura, R.: Progetto Inven-tario Fenomeni Franosi (in Italian), Allegato 1: Guida alla com-pilazione della scheda frane IFFI, 46, 2000b.
Amanti, M., Bertolini, G., Cara, P., Chiessi, V., De Nardo, M. T., Martini, M. G., Damasco, M., and Ventura, R.: Progetto Inven-tario Fenomeni Franosi (in Italian), Allegato 2: il database car-tografico finale, 5, 2001a.
Amanti, M., Bertolini, G., Cara, P., Chiessi, V., De Nardo, M. T., Martini, M. G., Damasco, M., and Ventura, R.: Progetto Inven-tario Fenomeni Franosi (in Italian), Allegato 3: il database al-fanumerico finale, 63, 2001b.
Antenucci, J. C., Brown, K., Croswell, P. L., and Kevany, M.: Ge-ographic Information Systems: a guide to technology, Van Nos-trand Reinhold, New York, 301, 1991.
ment, New Zealand Jour. Geol. Geoph., 11 (1), 191–199, 1968. Bottino, G., Chiarle, M., Joly, A., and Mortara, G.: Modelling Rock
Avalanches and their relation to permafrost degradation in glacial environments, Permafrost Periglacial Processes, 13, 283–288, 2002.
Brunsden, D. and Isben, M. L.: The nature, use and problem of historical archives for the temporal occurrence of landslides, with specific reference to the south coast of Britain, Ventnor, Isle of Wight, Geomorphology, 15, 241–258, 1996.
Callegari, E., Sacchi, R., Bovo, S., and Torassa, G.: Osservazioni strutturali sul versante italiano del massiccio di Ambin (Alpi Graie), Boll. Soc. Geol. It., 99, 395–404, 1980.
Carraro, F., Dramis, F., and Pieruccini, U.: Large-scale landslides connected with neotectonic activity in the Alpine and Apennine ranges, Proc. 15th Plen. Meet. “Geomorphological Survey and Mapping”, Modena (Italy), September 1979, 213–230, 1979. Carraro, F. and Giardino, M.: Quaternary glaciations in the
West-ern Italian Alps – a review, INQUA Commission on QuatWest-ernary Glaciations in the Western Hemisphere, Elsevier, in press, 2004. Chighira, M.: Long-term gravitational deformation of rock by mass
rock creep, Eng. Geol., 32(3), 157–184, 1992.
Crosta, G.: Landslide, spreading, deep seated gravitational defor-mation: analysis, examples, problems and proposal, Geogr. Fis. Dinam. Quat., 19, 297 – 313, 1996.
Crosta, G. and Zanchi, A.: Deep seated slope deformation: huge, extraordinary, enigmatic phenomena, Atti del convegno: “Land-slides in research, theory and practice, Cardiff, 351–358, 2000. Dal Piaz, G. V.: Le Alpi dal M. Bianco al Lago Maggiore, Societ`a
Geologica Italiana, Guide Geologiche Regionali, Bema ed. (Mi-lano), 3, 311, 1992.
Dikau, R., Cavallin, A., and J¨ager, S.: Databases and GIS for land-slide research in Europe, Geomorphology, 15, 227–239, 1996. Dramis, F., Govi, M., Guglielmin, M., and Mortara, G.: Mountain
permafrost and slope instability in the Italian Alps, Permafrost and Periglacial Processes, 6, 73–81, 1995.
Ferguson, H. F.: Valley stress release in the Alleghen Plateau, Eng. Geol., 4, 63–71, 1967.
Giardino, M. and Polino, R.: Le deformazioni di versante dell’alta Valle di Susa: risposta pellicolare dell’evoluzione tettonica re-cente, Il Quaternario, 10(2), 293–298, 1997.
Giardino, M. and Fioraso, G. : Cartografia geologica delle for-mazioni superficiali in aree di catena montuosa: il rilevamento del Foglio “Bardonecchia” nell’ ambito del Progetto CARG, Mem. Sci. Geol., 50, 133–153, 1997.
GNGFG – Gruppo Nazionale Geografia Fisica e Geomorfologia: Proposta di legenda geomorfologica ad indirizzo applicativo, Ge-ogr. Fis. Dinam. Quat., 16 (2), 129–152, 1994.
Hs¨u, J.: Catastrophic debris stream (sturzstroms) generated by rock
phologie, N. F. Suppl., 5, 59–72, 1964.
Mahr, T. : Deep-reaching gravitational deformation of high moun-tain slopes, IAEG Bull., 16, 121–127, 1977.
Mortara, G. and Sorzana, P. F.: Fenomeni di deformazione grav-itativa profonda nell’arco alpino occidentale italiano, Consider-azioni litostrutturali e morfologiche, Boll. Soc. Geol. It., 106, 303–314, 1987.
Nemcok, A.: Gravitational slope deformation in high mountains, Proc. 24th Inter, Geol. Congr. Monreal, Sec. 13, 132–141, 1972. Nemcok, A. and Rybar, J.: Landslide investigation in
Czechoslo-vakia, Proc. 1st Sessio IAEG, Prague, 183–198, 1968.
Panizza, M.: Fenomeni franosi connessi ad azioni di glaciopres-sione, Boll. Com. Glac. It., 22, 45–48, 1974.
Polino, R., Dal Piaz, G. V., and Gosso, G.: Tectonic erosion at the Adria margin and accretionary processes for the Cretaceous orogeny in the Alps Mem. Soc. Geol. France, 156, 345–367, 1990.
Polino, R., Dela Pierre, F., Fioraso, G., Giardino, M., and Gat-tiglio, M. : Note illustrative della Carta Geologica d’Italia alla scala 1:50 000: Foglio 132–152–153 Bardonecchia, Servizio Ge-ologico d’Italia, 118, 2003.
Ratto, S. and Bonetto, F.: The October 2000 flood in Valle d’Aosta (Italy): event description and land planning measures for the risk mitigation, JRBM, 2, 105–116, 2003.
Regione Piemonte, CNR IRPI, Politecnico di Torino and Scuola Universitaria della Svizzera Italiana: Proposta di una metodolo-gia inerente la mappatura e caratterizzazione dei processi di in-stabilit`a dei versanti da sperimentarsi nei bacini dell’alto Toce e della Maggia, INTERREG II Italia-Svizzera 1994–1999, Final Report (A. 5), CSI Piemonte, 105–135, 2002.
Stini, J.: Neutre Ansichten ¨uber “Bondenbewegungen” ¨uber ihre Beherrschung durch den Ingenieur, Geol. Bauwesen, 19 (1), 31– 54, 1952.
Ter-Stephanian, G.: Type of depth creep of slopes in rock masses, Probl. Geomech., 3, 49–69, 1966.
Varnes, D. J., Radbruch-Hall, D., and Savage, W. Z.: Topographic and structural conditions in area of gravitational spreading of ridges in the western united states, U.S. Geol. Surv. Prof. Paper 1496, Washington, 1–28, 1989.
von Engelen, G. B.: Gravity tectonics in the north-Western Dolomites (N. Italy), Geol. Ultraiec., 13, 1–92, 1963.
WP/WLI – UNESCO Working Party on World Landslide Inventory – A suggested method for reporting a landslide, IAEG Bull., 41, 5–12, 1990.
WP/WLI – UNESCO Working Party on World Landslide Inventory: A suggested method for a landslide summary, IAEG Bull., 43, 101–110, 1991.
A suggested method for describing the activity of a landslide, IAEG Bull., 47, 53–57, 1993.
WP/WLI – UNESCO Working Party on World Landslide Inventory: A suggested method for reporting landslides causes, IAEG Bull., 50, 71–74, 1994.
WP/WLI – UNESCO Working Party on World Landslide Inventory: A suggested method for describing the rate of movement of a landslide, IAEG Bull., 52, 75–78, 1995.
Zaruba, Q. and Mencl, V.: Landslides and their control, Elsevier, Amsterdam, Academia-Praha, 1969.
Zischinsky, U.: ¨Uber Bergzerreißung und Talzuschub, Geol. Rund-schau, 58(3), 974–983, 1969.