HAL Id: hal-00922928
https://hal.archives-ouvertes.fr/hal-00922928
Submitted on 8 Oct 2014
HAL is a multi-disciplinary open access
archive for the deposit and dissemination of
sci-entific research documents, whether they are
pub-lished or not. The documents may come from
teaching and research institutions in France or
abroad, or from public or private research centers.
L’archive ouverte pluridisciplinaire HAL, est
destinée au dépôt et à la diffusion de documents
scientifiques de niveau recherche, publiés ou non,
émanant des établissements d’enseignement et de
recherche français ou étrangers, des laboratoires
publics ou privés.
Thermal anomaly in Enceladus’ South Pole subsurface
Alice Le Gall, C. Leyrat, M. A. Janssen, Aurélien Stolzenbach, R. West, R. D.
Lorenz, K. Mitchell, P. Ries
To cite this version:
Alice Le Gall, C. Leyrat, M. A. Janssen, Aurélien Stolzenbach, R. West, et al.. Thermal anomaly
in Enceladus’ South Pole subsurface. European Planetary Science Congress 2013, Sep 2013, London,
United Kingdom. pp.EPSC2013-808. �hal-00922928�
Thermal anomaly in Enceladus’ South Pole subsurface
A. Le Gall (1), C. Leyrat (2), M.A. Janssen (3), A. Stolzenbach (1), R. West (3), R.D Lorenz (4), K. Mitchell (3), P. Ries (3)
and the Cassini Radar Team
(1) Laboratoire Atmosphères, Milieux, Observations Spatiales (LATMOS), Université de Versailles Saint-Quentin (UVSQ) Paris, France ([email protected]), (2) Laboratoire d'Etudes Spatiales et d'Instrumentation en Astrophysique (LESIA), Observatoire de Paris-Meudon, Meudon, (3) Jet Propulsion Laboratory (JPL), California Institute of Technology, CA, USA, (4) Space Department, Johns Hopkins University Applied Physics Lab, Laurel, MD 20723, USA.
Abstract
On November 6, 2011, during the E16 flyby, the Cassini Radar had a unique opportunity to closely observe Enceladus in both its active and passive modes of operation. The E16 swath aimed at about 66°S, close to the active South polar rifted area. In this paper, we show that the radiometry data collected during this flyby revealed brightness temperatures much higher than expected, pointing to a geothermal anomaly in the subsurface. This anomaly could be indicative of a buried heat source, unless it is due to exotic thermal processes such as the solid-state greenhouse effect.
1. Introduction
At the beginning of the Cassini mission, the ISS (Imaging Science Subsystem) and CIRS (Composite Infra-Red Spectrometer) instruments discovered a geologically active region at the south pole of Saturn's icy moon Enceladus [1],previously famous for being one of the brightest bodies in the Solar System. Plumes venting material emanate from this region. Six years later, on November 6, 2011, the first-ever Synthetic Aperture Radar (SAR) image of Enceladus was acquired during the E16 flyby of the moon at the wavelength of 2-cm [2]. The SAR swath is located within the seemingly young South Pole Terrains, not far from the active sulci also known as the “tiger stripes” identified as the sources of the plumes.
Concurrently to the SAR image, radiometry data were collected in the passive mode of the instrument. The Cassini radiometer records the thermal emission from the surface in the microwave domain, at the same wavelength of 2-cm. Here, we compare the radiometry measurements to the expected microwave thermal emission from Enceladus’ surface when assuming, in particular, no heat source in the subsurface.
2. Cassini radiometry observation
of Enceladus’ South Pole
The E16 radiometry data were collected with a ground footprint of 25-40 km across the track and ~5 km along. In its passive mode, the Cassini Radar/radiometer measures the 2-cm brightness temperature Tb of the surface that varies both with the
emissivity e and the vertical temperature profile below the surface down to a depth which depends on the electrical properties of the subsurface (Tb=eTeff
where Teff is the physical temperature integrated over
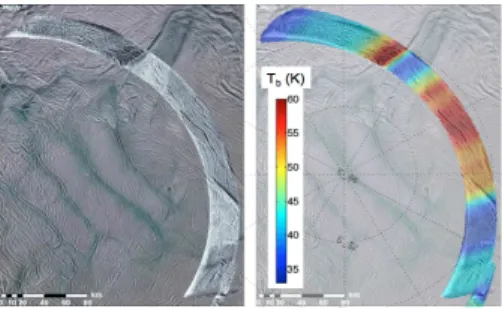
some depth). Typically, radio instruments sense 10 to 100 wavelengths into an icy crust and can thus provide unique insight into the compositional, thermal and physical (porosity, roughness) state of planetary regoliths at depths much greater than the ones sampled by thermal IR spectrometers. In particular, the microwave radiometer can be used to detect possible endogenic activity beneath the surface. The measured calibrated brightness temperatures during E16 cover a range from 33 to 60 K (see Fig. 1). As expected (Kirchhoff’s law), they are anti-correlated with the concurrent radar data.
Figure 1: (Left) E16 SAR swath overlaid on an ISS
mosaic of Enceladus’ South Pole. (Right) Brightness temperature (in K) measured by the radiometer (passive mode) along the swath.
EPSC Abstracts
Vol. 8, EPSC2013-808, 2013
European Planetary Science Congress 2013
c
! Author(s) 2013
EPSC
European Planetary Science Congress3. Thermal emission modelling
In absence of endogenic emission, the temperature structure of any airless satellite results from a balance between solar insolation, heat transport within the subsurface by grain-to-grain conduction and re-radiation outward. We have developed a thermal model that accounts not only for the diurnal but also for the seasonal variations of the temperature that cannot be ignored at the depths sensed by the radiometer. It is run for a range of specified thermal inertias and volumetric heat capacities, through enough heliocentric orbits to achieve periodic steady state. Solar eclipses are included while Saturnshine is negligible.
Outputs are then coupled with a radiative transfer model in order to infer the blackbody brightness temperature sensed by the instrument. The surface emissivity is estimated from active (SAR) measurements using Kirchhoff’s law of thermal radiation [3],and is found to lie between 0.2 and 0.8 along the scan, consistent with published distant radiometry observations of Enceladus [4].
4. Subsurface thermal anomaly
Comparison between the E16 radiometry observations and the model outputs obtained for the same epoch, local hours, locations and observational geometry reveal that the measured brightness temperatures are much higher than expected when assuming no endogenic emission. Even for thermal inertias as high as 2000 Jm-2K-1s-1/2 (the CIRS-derived value is <30, [5]), the model predicts temperatures that are 5 to 25 K lower than the ones recorded (see Fig. 2). Even a locally much lower bolometric Bond albedo than assumed (0.8 based on [5]) could not explain such results, which strongly point to a geothermal anomaly in the subsurface.
A warmer near-surface could easily be masked to CIRS by a thermally insulating layer. Given the geological context, it is tempting to raise the possibility of an endogenic buried heat source. Though maximum at the center of the scan i.e. closer to the South pole, the discrepancy seems to be present everywhere, which would argue in favor of a laterally extensive buried heat source and provide crucial new constrains for the moon heating mechanisms. Furthermore, the thermal anomaly is especially strong over a linear fracture that looks like the “tiger stripes” and runs parallel to them. This could be a sulcus, sleeping at the surface but still vivid below. The anomaly is also strong over two
faults that bound the radar-brightest areas suggesting that these faults may also hide heat sources.
Alternatively, this thermal anomaly could be indicative of exotic thermal processes that are not taken into account in the model such as thermal rectification, where heat is also transferred through the pores by radiation (already observed in the very porous lunar regolith [6]) or, more likely, the solid-state greenhouse effect. This latter phenomenon, first advanced by [7], applies well to very bright surfaces, such as Enceladus', where the sunlight is not absorbed right at the surface but penetrates some distance into it, leading to subsurface energy deposition. However, while of importance in theory, large temperature enhancement has so far not been demonstrated in practice.
Figure 2: Map of the thermal anomaly (i.e.
difference between the measured and modeled brightness temperatures).
Acknowledgements
The Cassini/Huygens mission is a joint endeavor of NASA, ESA, and ASI and is managed by JPL/Caltech under a contract with NASA.
References
[1] West et al. (2012), 43rd LPSC, abstract #2602. [2] Porco et al. (2005), Science 311, 1393-1401. [3] Janssen et al. (2011), Icarus 212, 321-328. [4] Ostro et al. (2006), Icarus 183, 479-490. [5] Howett et al. (2010), Icarus 206, 573–593. [6] Langsteth et al. (1976), Proc. Lunar Sci. Conf. 7th. [7] Matson and Brown (1989), Icarus 77, 67-81.