HAL Id: hal-02859983
https://hal.archives-ouvertes.fr/hal-02859983
Submitted on 8 Jun 2020
HAL is a multi-disciplinary open access
archive for the deposit and dissemination of
sci-entific research documents, whether they are
pub-lished or not. The documents may come from
teaching and research institutions in France or
abroad, or from public or private research centers.
L’archive ouverte pluridisciplinaire HAL, est
destinée au dépôt et à la diffusion de documents
scientifiques de niveau recherche, publiés ou non,
émanant des établissements d’enseignement et de
recherche français ou étrangers, des laboratoires
publics ou privés.
The impact of carbon dioxide aviation emissions on
future climate change
Etienne Terrenoire, Didier Hauglustaine, Thomas Gasser, Olivier Penanhoat
To cite this version:
Etienne Terrenoire, Didier Hauglustaine, Thomas Gasser, Olivier Penanhoat. The impact of carbon
dioxide aviation emissions on future climate change. 1st Edition of the Aerospace Europe Conference
– AEC2020, Feb 2020, Bordeaux, France. �hal-02859983�
THE IMPACT OF CARBON DIOXIDE AVIATION EMISSIONS ON FUTURE CLIMATE
CHANGE
Etienne Terrenoire (1), Didier Hauglustaine (2), Thomas Gasser (3), Olivier Penanhoat(4) (1) ONERA – DMPE - Université Paris Saclay, Email:[email protected] (2) LSCE, Université Paris Saclay, Gif-sur-Yvette, France, Email:[email protected]
(3) IIASA, Laxenburg, Austria, Email: [email protected]
(4) SAFRAN Aircraft Engines, Villaroche Center, Moissy Cramayel, France, Email: [email protected]
KEYWORDS: aviation, CO2, climate impact, future
emission scenario, compact climate model, OSCAR
ABSTRACT:
Aviation emissions are estimated to contribute to 5 % (2–14 %, 90 % likelihood range) of the anthropogenic radiative forcing of climate with an uncertainty dominated by non-CO2 effects (Lee et
al., 2010). Even if the level of scientific understanding is considered to be high by the IPCC for present-day aviation CO2 impact compared to
other non-CO2 forcers (e.g. ozone, aerosols and
contrails), the future (2050) aviation CO2 climate
impact remains highly uncertain. One major reason of these varying estimates is linked to the inherent assumptions made in the development of future global emission scenarios such as the one from international aviation (Boucher et al., 2016). Hence, using the compact Earth System Model (ESM) OSCARv2.2 we quantify the climate impact of present and future (up to 2100) civil aviation carbon dioxide (CO2) emissions using eight aviation
scenarios ranging from 386 Mt CO2/year (Factor 2
scenario) to 2338 Mt CO2/year (ICAO/CAEP
scenario) in 2050. This approach will allow quantifying the uncertainty due to the difficulty to estimate the future mitigation effort. Another originality of the paper is that the influence of other emission sectors is evaluated using two background Representative Concentrations Pathways (RCP2.6 and RCP6.0).
Results show that in 2050, on a climate trajectory in line with the Paris Agreement limiting the global warming below 2 °C (RCP2.6), the impact of the aviation CO2 emissions ranges from 26 ± 2 mK (1.4
% of the total global warming associated with all fossil fuel emissions) for an ambitious mitigation strategy scenario (Factor 2) to 39 ± 4 mK (2.0 % of the total global warming) for the least ambitious mitigation scenario of the study (ICAO-CAEP). On the longer term, if no significant emission mitigation is implemented for the aviation sector, the associated warming could further increase and reach a value of 100
mK in 2100 (ICAO/CAEP), which corresponds to 5.2 % of the total global temperature increase from total fossil fuel CO2 emissions under RCP2.6.
1. INTRODUCTION
In 2017, worldwide flights carried nearly 4.1 billion passengers and produced 859 million tonnes of CO2
(ATAG, 2019). In 2016, the International Civil Aviation Organization (ICAO) recalled that the aviation sector “accounts for under 2 % of the world’s annual CO2 emissions” (ICAO, 2016). The
growing aviation sector is expected to experience a three-fold increase between 2000 and 2050 in terms of passengers (Berghof et al., 2005; Horton, 2006). Airbus plans a 4.6 %/year increase in the average annual global air traffic rate over the next 20 years (2015–2034) (Airbus, 2016), while Boeing forecasts a 4.9 %/year increase over the same period (Boeing, 2015). Between 1995 and 2010, the aviation sector recorded an average yearly growth rate of 4.6 %/year in terms of revenue-passenger-kilometres, despite the drop linked to the world economic recession in 2008. The mean annual growth rate is projected to remain constant (4.1 %/year) over the 2015–2025 period (ICAO, 2019a), which could make the aviation sector a significant fossil fuel CO2 emitting sector in the future (2050). It
has previously been shown that aircraft emissions perturb the radiative budget of the Earth atmosphere (Intergovernmental Panel on Climate Change (IPCC), 1999; IPCC, 2007; Sausen et al., 2005; Lee et al., 2009; Brasseur et al., 1998; 2016). Aviation emissions are estimated to contribute to 5 % (2–14 %, 90 % likelihood range) of the anthropogenic radiative forcing of climate with an uncertainty dominated by non-CO2 effects (Lee et
al., 2010). The climate impact of CO2 emissions
from aviation has been previously assessed by different studies for the past, present and future (Lee et al., 2010; Gauss et al., 2006). Even if the level of scientific understanding is considered to be high by the IPCC for present-day aviation CO2
impact (Lee et al., 2010) compared to other non-CO2 forcers (e.g. ozone, aerosols and contrails), the
future (2050) aviation CO2 climate impact remains
highly uncertain. The main cause of these varying estimates is not linked to the understanding of the physical and biogeochemical properties of CO2 but
rather to the inherent assumptions made in the development of future global emission scenarios such as the one from international aviation (Boucher et al., 2016). In 2018, 158 Parties ratified the Paris agreement which aims to “[hold] the increase in the
global average temperature to well below 2 °C above pre-industrial levels and pursuing efforts to limit the temperature increase to 1.5 °C above pre-industrial levels.” The framework of the present
study is the 2 °C objective decided during the twenty-first session of the Conference of the Parties (COP 21) which was held in Paris in 2015. Hence, among the four Representative Concentration Pathways assessed in the fifth assessment report of the Intergovernmental Panel on Climate Change, the scenario RCP2.6 constitutes a good background scenario for global climate forcers representative of this goal of limiting global warming in 2100 to less than 2 °C above preindustrial levels (Collins et al., 2013; Van Vuuren., 2011). Achieving this objective is very ambitious and requires a rapid and significant reduction in greenhouse gas emissions (Raftery et al., 2017; IPCC, 2018). Moreover, Boucher et al. (2016) showed that the Intended Nationally Determined Contributions (INDCs) remain insufficient to bring global greenhouse gas emissions onto a path to limit global warming below 2 °C. The RCP6.0 scenario which implies, for example, that the global temperature in 2050 is warmer by 1.5 °C than under RCP2.6 is therefore seen as a plausible alternative scenario. The impact of aircraft CO2 emissions on
climate has been assessed for instance by Sausen and Schumann (2000), Lee et. al. (2010) and Khodayari et al. (2013). In this paper, a compact Earth System Model including a detailed carbon cycle representation is used to quantify the global climate impact of the aviation sector and its uncertainties in the framework of the Paris agreement using updated aviation emissions scenarios.
2. METHOD
In this study, we use the OSCAR compact Earth System Climate Change Model (ESCCM) to investigate the impact of CO2 emissions from the
aviation sector on climate. Carbon dioxide is a long-lived greenhouse gas with an apparent atmospheric lifetime of several hundreds of years. Therefore, because its lifetime is much longer than the typical mixing time of the atmosphere (about 2 to 3 years), the location of emission matters very little when it comes to estimating its climate impact and the use of an integrated model such as OSCAR is well justified for this long-lived greenhouse gas. The OSCAR v2.2 model is a compact coupled biogeochemical cycles and climate change model that calculates the global concentration of CO2,
CH4, N2O, halogenated compounds, tropospheric
ozone and aerosols by balancing their historical anthropogenic emissions (production) against their removal from the atmosphere. The representation
of these processes including the model climate sensitivity are all calibrated against more complex models, most of them corresponding to deterministic three-dimensional global circulation models such as those used and described in the Coupled Model Intercomparison Project (CMIP) phase 5 exercise. In that sense, OSCAR is a meta-model whose modules are designed to emulate the behaviour of a more specialized model.
In most of the modules, different parameterizations are available (e.g. 12 for the oceanic carbon cycle, 13 for the land carbon cycle, 7 for land use and 28 for the climate model). It allows 3x10⁴ different
possible setups that can be used to calculate the “physical uncertainty” linked to the parametrization formulations using a Monte-Carlo approach. Based on some pre-tests performed with the model, an ensemble of 1000 members is considered appropriate to assess the uncertainty of a numerical experiment. The results presented in the next sections correspond to the median of the ensemble with the uncertainty (shaded area in the figures) corresponding to the 68 % data uncertainty range based on the percentiles of the distribution, meaning that ± 34 % of the ensemble values around the median are included in this uncertainty range. The evaluation of the model is beyond the scope of this paper, which rather focuses on the quantification of future aviation climate impact. Please note that OSCAR has already been used as a carbon-cycle and climate emulator many times, and its performance has been demonstrated by comparison to observations (Gasser et al., 2017a) or to comprehensive models (Gasser et al., 2018; Quilcaille et al., 2018; Gasser et al., 2017; Arneth et al., 2017).
A total of eight emission scenarios have been used to describe the future evolution
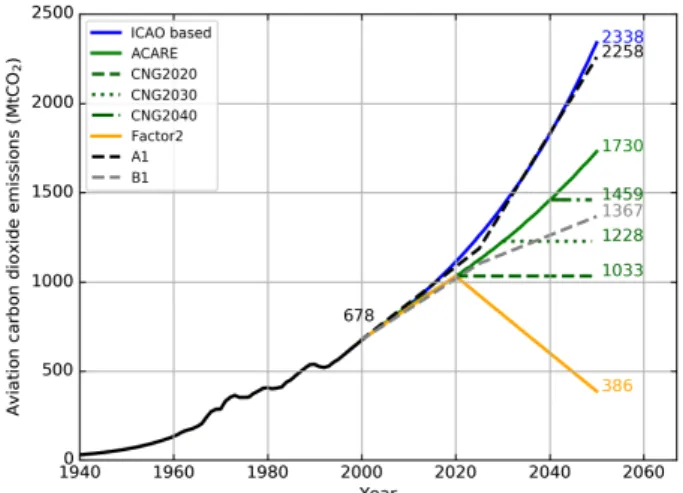
Figure 1 shows the various scenarios used in this study for future CO2 emissions by the aviation
sector. In 1940, the emissions are estimated to be equal to 28 Mt CO2 (Sausen and Schumann, 2000)
when aviation was emerging. Then, the emissions are projected to reach in 2050 as much as 2338 Mt CO2/year according to the ICAO based projection.
The ACARE scenario (1730 Mt CO2/year in 2050)
is less ambitious and fits between the A1 (2258 Mt CO2/year in 2050) and B1 (1367 MtCO2/year in
2050) QUANTIFY scenarios. The CNG2020, CNG2030 and CNG2040, scenarios follow the ACARE scenario before their pathway stabilizes at 1033, 1228, and 1459 Mt CO2/year from 2020,
2030 and 2040, respectively. The Factor 2 scenario drops down from 1033 Mt CO2/year in
2020 to 386 Mt CO2 in 2050.
Two different scenarios are used for non-aviation emissions. The use of two different scenarios allows the evaluation of the influence of two different background carbon dioxide concentrations and climate change on the future
aviation climate impact. The RCP2.6 was developed using the Integrated Model to Assess the Greenhouse Effect (IMAGE 2.4) integrated assessment modelling framework of the PBL Netherlands Environmental Assessment Agency (Van Vuuren., 2011). It is a “peak and decline” scenario, meaning that its radiative forcing (RF) level first reaches 3 W/m2 around 2020 before
returning to 2.6 W/m2 by 2100, and was used in the
fifth assessment report of the Intergovernmental Panel on Climate Change (AR5 from IPCC) report published in 2013 (Meinshausen et al., 2011a). The RCP6.0 scenario is also used and is less optimistic than RCP2.6 as the total anthropogenic radiative forcing (6 W/m2) reaches more than twice
that of RCP2.6 (2.6 W/m2) in 2100. This implies
that the global temperature in 2050 is 1.5 °C warmer than under RCP2.6.
Figure 1. CO
2aviation emissions (Mt
CO
2/year) for the different aircraft
emission scenarios over the 1940
‒
2050
period. The black line refers to the
historical data (Sausen and Schumann,
2001) and the coloured lines to the
corresponding scenarios (see labels).
Total emissions in 2000 (reference year)
and in 2050 are also provided right to the
corresponding curve
3.
RESULTSWe first investigate the climate response associated with carbon dioxide emissions from the aviation sector over the 1940-2050 period. Figure 2 shows the temperature increase (ΔT in mK) due to the CO2 aviation emissions for the ICAO based,
ACARE, CNG2020 and Factor 2 scenarios. Note that for all variables (ΔCO2, RF and ΔT), the given
value correspond to the increase due to CO2
aviation emissions only. Those scenarios are representative of the full range of the future carbon dioxide aviation emission scenarios considered in
this study. Note that these figures illustrate the perturbations adopting the RCP2.6 storyline for other anthropogenic emissions. The aviation contribution to climate change under the RCP6.0 storyline has also been simulated. On Figure 2, the red curves represent the median of the absolute differences of two distinct ensembles: one without aviation emissions and the other including aircraft CO2 emissions. The green curves show the
relative contribution of the aviation emissions with respect to the total fossil fuel emissions. The shaded areas on the sides of the red and green curves correspond to the 68 % data range uncertainty (± one standard deviation of the ensemble). As illustrated in Figures 2, the same type of evolution is calculated for ΔT over the 1940-2050 period. For the different aviation emission scenarios the highest ΔT are calculated under the RCP2.6 storyline. In 2050, the modelled ΔT range from 26 mK for the Factor 2 scenario to 39 mK for the ICAO based scenario. The aviation CO2 contribution to the total anthropogenic
radiative forcing ranges from 1.6 % to 2.5%. The temperature increase due to aviation emissions from the ICAO based and Factor 2 scenarios correspond to 1.4 % to 2.0 % of the global warming, respectively. It should be noted that the uncertainty represented by the shades area on Figure 2 is higher for the ΔT than for the two others variables (ΔCO2 and RF) and is mainly related to
the large range of climate sensitivity parameters that is used for the production of the ensemble. The relative contribution of aviation to the total anthropogenic forcing is of course very dependent on the scenario used for the emissions by other sectors (e.g. baseline). Under the RCP2.6 scenario, the relative contribution of aviation CO2
emissions to the total anthropogenic RF and ΔT shows a strong increase for all scenarios throughout the whole period (1940‒2050), especially towards the last 20 years of the period (2030‒2050) when emissions from other sectors start to strongly decrease. For example, for the ICAO based scenario, aviation contributes to 2.5 % to the total anthropogenic RF in 2050, while under RCP6.0 this contribution decreases to 1.8 %. Using the mitigation ACARE scenario, the aviation contribution decreases from 2.2 % for RCP2.6 and to 1.6 % for RCP6.0. Although the original Carbon Neutral Growth (CNG) scenario aims at stabilizing emissions starting in 2020, two other starting years (2030 and 2040) of neutral growth have been used to assess the influence of the starting year for the long-lived CO2 greenhouse
gas. The results show that the CNG 2020 under the RCP2.6 storyline produces the lowest ΔT (32 mK) in 2050 of the three tested CNG scenarios. In fact, the 2050 climate impact of the CNG 2040 scenario lies between the mitigation QUANTIFY B1 scenario and the ACARE scenario in terms of ΔT. If CNG is delayed until 2040, the climate impact is higher than the QUANTIFY B1 scenario
and is likely to reach the one of the less ambitious ACARE scenario by 2050, showing therefore the importance of starting the CNG as soon as possible in order to reduce the climate impact of aviation. The Factor 2 scenario is the most ambitious mitigation case of the assessed aircraft CO2 emission scenarios. The ultimate 2050 goal
for this scenario is similar to a return to the 1978 aviation emissions, which seems very challenging under the traffic growth rate and calls for a strong offset of future CO2 emissions. Different tools such
as an improvement in fuel efficiency driven by the renewal of the aircraft fleet with new aircrafts, and improvements in operational practices as well as carbon compensation mechanisms explain why this objective is put forward. It is really this Factor 2 scenario, however, that can significantly reduce the climate impact of the aviation, reducing the aircraft RF relative contribution to 1.6 % of the total anthropogenic forcing and 1.4 % of the total anthropogenic warming in 2050, under RCP2.6.
Figure 2. Temporal evolution (1940
‒
2050) of the global temperature increase
(mK) due to aircraft emissions (in red, left
axis) for the ICAO based, ACARE,
CNG2020 and Factor 2 scenarios
(RCP2.6 scenario for the non-aviation
emissions). In green (right axis), the
corresponding relative aircraft contribution
to temperature increase due to total
anthropogenic emissions (%). The 2050
values are reported next to each curve.
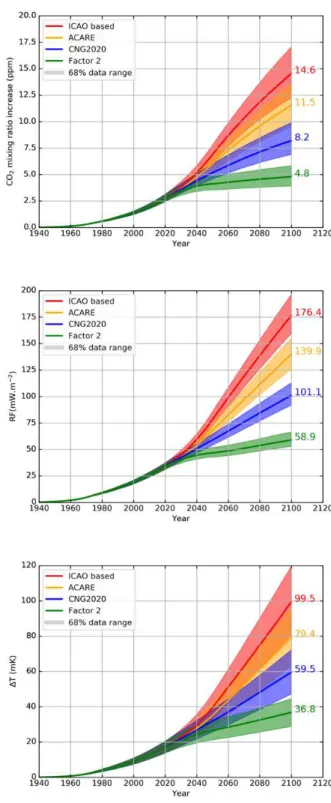
Figure 3. Temporal evolution (1940
of the aviation induced CO
‒
2100)
2
mixing ratio
increase (ppm), radiative forcing (mW/m
2),
and temperature increase (mK) for the
ICAO based, ACARE, CNG2020 and
Factor 2 scenarios (RCP2.6 storyline for
non-aviation emissions).
Since CO2 is a long-lived greenhouse gas
remaining in the atmosphere for more than 100 years, the benefit of the aviation emission mitigation will be more visible during the second half of the 21st century. In order to illustrate this
feature, OSCAR is used to extend the simulations to 2100. However, after 2050, the aviation emissions are highly uncertain and we simply assume that they remain constant at their 2050 value over the 2050-2100 period. Figure 3 shows the long-term temporal evolution (1940-2100) of ΔCO2 (top), RF (middle) and ΔT (bottom) for the
ICAO based, ACARE, CNG2020 and Factor 2 scenarios combined with the RCP2.6 storyline for non-aviation emissions. Even if aircraft fossil fuel CO2 emissions stay constant after 2050, ΔT
continues to increase to 99.5 mK for the ICAO based scenario and to 79.4 mK for the ACARE scenario, which corresponds respectively to 5.2 % and 4.1 % of the total anthropogenic warming in 2100. Even in the case of the CNG2020 scenario, the temperature continues to increase to a value of 59.5 mK (3.1 %) in 2100. This highlights the long lifetime of CO2 in the atmosphere and the inertia of
the coupled climate system (Friedlingstein et al., 2011). It is only in the case of the Factor 2 scenario, that the temperature increase tends to flatten after 2060 reaching 36.8 mK (1.9 %) in 2100.
As shown in Figures 3, the 68 % uncertainty range (shaded areas) grows rapidly as the simulation goes forward in time. On top of this “physical uncertainty” related to the selected parametrisation options and quantified using the Monte-Carlo methodology, numerous challenging predictable factors come into play making the extension towards 2100 very uncertain. Those highly uncertain factors refer to events that control the future emissions from the aviation sector such as the penetration rate of alternative fuels into the global current fuel market or the change in aviation technology. Those uncertainties are usually taken into account by the emissions scenarios such as the ones used in this study. In addition, the carbon uptake from the atmosphere by land and ocean are also very dependent on the future atmospheric composition and climate. Considering this uncertainty, the present work suggests that the temperature increase associated with aircraft emissions could reach, by the end of the century, as much as 99.5 mK ± 20 mK, which represents 5.2 % of the global warming from anthropogenic origin. The temperature increase resulting from the alternative aviation scenarios (ACARE, CNG and Factor 2) are significantly mitigated and could decrease to 37mK, which correspond to 1.9 % of the global anthropogenic warming in 2100 in the case of the ambitious Factor 2 scenario. The CNG scenarios indicate that the sooner the start of the CNG will be, the lower the future impact of aviation on the global temperature will be. Hence, to be efficient in terms of climate change mitigation, the CNG needs to start as soon as possible, as the positive impact of this scenario on future climate decreases rapidly with time.
4. DISCUSSION AND CONCLUSION
In this study, a compact Earth System Model (ESM) has been used to assess the climate impact of present and future civil aviation carbon dioxide (CO2) emissions. The impact of aviation CO2
emissions on future climate has been quantified over the 1940–2050 period, extending some simulations to 2100 and using different aviation CO2 emission scenarios and two background
Representative Concentrations Pathways (RCP2.6 and RCP6.0) for other emission sectors. Several aviation scenarios including weak to strong mitigation options have been considered, ranging from 386 Mt CO2/year (Factor 2 scenario)
to 2338 Mt CO2/year (ICAO based scenario) in
2050.
In 2050, on a climate trajectory in line with the Paris Agreement limiting the global warming below 2 °C (RCP2.6), we found that the impact of the aviation CO2 emissions ranges from 26 ± 2 mK
(1.4 % of the total anthropogenic warming) for an ambitious mitigation strategy scenario (Factor 2) to 39 ± 4 mK (2.0 % of the total anthropogenic warming) for the least ambitious mitigation scenario of the study (ICAO based). On the longer term, if no significant emission mitigation is implemented for the aviation sector, the associated warming further increases to 99.5 mK ± 20 mK in 2100 (ICAO based), which corresponds to 5.2% of the total anthropogenic warming under RCP2.6. The climate impact of aviation CO2
emissions depends on the greenhouse gas emission scenario adopted for other activity sectors as illustrated here in the context of two different RCP scenarios (i.e., RCP2.6 and RCP6.0 scenarios). This arises mostly because the aviation carbon uptake from the atmosphere by the land and ocean sinks depends on the future atmospheric background CO2 concentration and
on the future climate.
Please report on the Terrenoire et al. (2019) paper for full details about this work.
Terrenoire, E., Hauglustaine, D. A., Gasser, T., and Penanhoat, O.: The contribution of carbon dioxide emissions from the aviation sector to future climate change, Environ. Res. Lett., 14, 084019,
https://doi.org/10.1088/1748-9326/ab3086, 2019
5. REFERENCES
Airbus, Airbus Global Market Forecast 2015-2034. http://www.airbus.com/company/market/forecast (last access: March 2016), 2016.
Arneth A., Stephen Sitch, Julia Pongratz, B. D. Stocker, Philippe Ciais, et al. Historical carbon dioxide emissions caused by land-use changes are
possibly larger than assumed. Nature Geoscience, Nature Publishing Group, 10 (2), pp.79-84, 2017. ATAG, Air Transport Acton Group. http://www.atag.org/facts-and-figures.html (last access: June 2019), 2019.
Brasseur G. P., R. A. Cox, D. A. Hauglustaine, I. Isaksen, J. Lelieveld, D. H. Lister, R. Sausen, U. Schumann, A. Wahner et P. Wiesen, European scientific assessment of the atmospheric effects of aircraft emissions, Atmos. Environ., 32, 2329-2418, 1998.
Brasseur, G. P., et al., Impact of aviation on climate,
Bull. Amer. Meteor. Soc., 97(4), 561-583, 2016.
Berghof, R., Schmitt, A., Eyers, C., Haag, K., Middel, J., Hepting, M., Grübler, A., Hancox, R., CONSAVE 2050 — constrained scenarios on aviation and emissions. Project funded by the European Commission, Germany, 2005.
Boden, T. A., Marland, G. and Andres, R. J. Global, Regional, and National Fossil-Fuel CO2 Emissions.
Carbon Dioxide Information Analysis Center, Oak Ridge National Laboratory, U.S. Department of Energy, Oak Ridge, Tenn., U.S.A. doi:10.3334/CDIAC/00001_V2013, 2013.
Boeing, Current Market Outlook 2015-2034, http://www.boeing.com/commercial/market/, (last access: March 2016), 2015.
Boucher, O., H. Benveniste, and C. Guivarch, Nations’ pledges to reduce emissions and the 2°C objective, Eos, 97,
doi:10.1029/2016EO052397, 2016.
Collins, M. et al, in Climate Change 2013: The Physical Science Basis. (eds Stocker, T. F. et al) (Cambridge Univ. Press, 2013), 2013.
Friedlingstein, P., S. Solomon, G.-K. Plattner, R. Knutti, P. Ciais, and M. Raupach, Long-term climate implications of twenty-first century options for carbon dioxide emission mitigation, Nature Clim.
Change, DOI: 10.1038/NCLIMATE1302, 2011.
Gasser, T., Ciais, P., Boucher, O., Quilcaille, Y., Tortora, M., Bopp, L., and Hauglustaine, D.: The compact Earth system model OSCAR v2.2: description and first results, Geosci. Model Dev., 10, 271-319, https://doi.org/10.5194/gmd-10-271-2017, 2017.
Gasser, T., Kechiar M, Ciais P, Burke EJ, Kleinen T, Zhu D, Huang Y, Ekici A, Obersteiner. : Path-dependent reductions in CO2 emission budgets caused by permafrost carbon release. Nature
Geoscience 11: 830-835.
DOI:10.1038/s41561-018-0227-0, 2018.
Gauss, M., Isaksen, I.S.A., Lee, D.S., Søvde, O.A., Impact of aircraft NOx emissions on the atmosphere and tradeoffs to reduce the impact, Atmos. Chem.
Phys. 6, 1529–1548., 2006.
Horton, G., 2006. Forecasts of CO2 emissions from civil aircraft for IPCC, QINETIQ, November, United Kingdom.
ICAO. http://www.icao.int/Newsroom/Pages/New- ICAO-Aircraft-CO2-Standard-One-Step-Closer-To-Final-Adoption.aspx (last access: March 2016), 2016.
Intergovernmental Panel on Climate Change (IPCC), Aviation and the Global Atmosphere. A Special Report of IPCC Working Groups I and III, edited by J. E. Penner et al., Cambridge Univ. Press, Cambridge, 1999.
IPCC, Climate Change 2007: Synthesis Report. Contribution of Working Groups I, II and III to the Fourth Assessment Report of the Intergovernmental Panel on Climate Change [Core Writing Team, Pachauri, R.K and Reisinger, A. (eds.)]. IPCC, Geneva, Switzerland, 104 pp., 2007.
IPCC, Summary for Policymakers. In: Global
Warming of 1.5°C. An IPCC Special Report on the impacts of global warming of 1.5°C above pre-industrial levels and related global greenhouse gas emission pathways, in the context of strengthening the global response to the threat of climate change, sustainable development, and efforts to eradicate poverty [Masson-Delmotte, V., P. Zhai, H.-O.
Pörtner, D. Roberts, J. Skea, P.R. Shukla, A. Pirani, W. Moufouma-Okia, C. Péan, R. Pidcock, S. Connors, J.B.R. Matthews, Y. Chen, X. Zhou, M.I. Gomis, E. Lonnoy, Maycock, M. Tignor, and T. Waterfield (eds.)]. World Meteorological Organization, Geneva, Switzerland, 32 pp, 2018.
Khodayari, A., Donald J. Wuebbles, Seth C. Olsen, Jan S. Fuglestvedt, Terje Berntsen, Marianne T. Lund, Ian Waitz, Philip Wolfe, Piers M. Forster, Malte Meinshausen, David S. Lee, Ling L. Lim, Intercomparison of the capabilities of simplified climate models to project the effects of aviation CO2 on climate, Atmospheric Environment, Volume 75, August 2013, Pages 321-328, ISSN 1352-2310, 2013.
Lee, D. S., Pitari, G., Grewe, V., Gierens, K., Penner, J. E., Petzold, A., Prather, M. J., Schumann, U., Bais, A., Berntsen, T., Iachetti, D., Lim, L. L., and Sausen, R.: Transport impacts on atmosphere and climate: aviation, Atmos. Environ., 44, 4678– 4734, 2010.
Meinshausen, M. et al. The RCP greenhouse gas concentrations and their extension from 1765 to
2300. Clim. Change 109, 213–241, 2011a.
QUANTIFY, https://www.pa.op.dlr.de/quantify/ last access 31/05/2018.
Quilcaille Y, Gasser T, Ciais P, Lecocq F, Janssens-Maenhout G, & Mohr S. Uncertainty in projected climate change arising from uncertain fossil-fuel emission factors. Environmental Research Letters 13 (4): e044017. DOI:10.1088/1748-9326/aab304, 2018.
Raftery, A.E., Zimmer, A., Frierson, Dargan M. W., Startz, R., Liu, P., Less than 2°C warming by 2100 unlikely, Nature, 2017/07/31/online., advance online publication, Nature Publishing Group, 1758-6798, 2017.
Sausen, R., Schumann, U., Estimates of the climate response to aircraft CO2 and NOx emissions scenarios. Clim. Change 44, 27–58, 2000.
Sausen, R., Isaksen, I., Grewe, V., Hauglustaine, D., Lee, D.S., Myhre, G., Ko ̈ hler, M.O., Pitari, G., Schumann, U., Stordal, F., Zerefos, C., Aviation radiative forcing in 2000: an update of IPCC (1999). Meteorol. Zeit 114, 555–561, 2005.
van Vuuren DP, Stehfest E, Den Elzen MGJ, Deetman S, Hof A, Isaac M, Klein Goldewijk K, Kram T, Mendoza Beltran A, Oostenrijk R et al.
RCP2.6: Exploring the possibility to keep global mean temperature change below 2°C. Climatic
Change. doi: 10.1007/s10584-011-0152-3, 2011. Wilkerson, J. T., Jacobson, M. Z., Malwitz, A., Balasubramanian, S., Wayson, R., Fleming, G., Naiman, A. D., and Lele, S. K.: Analysis of emission data from global commercial aviation: 2004 and 2006, Atmos. Chem. Phys., 10, 6391-6408, doi:10.5194/acp-10-6391-2010, 2010.