HAL Id: hal-02076649
https://hal-amu.archives-ouvertes.fr/hal-02076649
Submitted on 22 Mar 2019
HAL is a multi-disciplinary open access
archive for the deposit and dissemination of
sci-entific research documents, whether they are
pub-lished or not. The documents may come from
teaching and research institutions in France or
abroad, or from public or private research centers.
L’archive ouverte pluridisciplinaire HAL, est
destinée au dépôt et à la diffusion de documents
scientifiques de niveau recherche, publiés ou non,
émanant des établissements d’enseignement et de
recherche français ou étrangers, des laboratoires
publics ou privés.
Distributed under a Creative Commons Attribution| 4.0 International License
Intraspecific and interspecific trait variability in tadpole
meta-communities from the Brazilian Atlantic rainforest
Mainara Jordani, Nicolas Mouquet, Lilian Casatti, Marcelo Menin, Denise de
Cerqueira Rossa-Feres, Cécile H. Albert
To cite this version:
Mainara Jordani, Nicolas Mouquet, Lilian Casatti, Marcelo Menin, Denise de Cerqueira Rossa-Feres,
et al.. Intraspecific and interspecific trait variability in tadpole meta-communities from the
Brazil-ian Atlantic rainforest.
Ecology and Evolution, Wiley Open Access, 2019, 9 (7), pp.4025-4037.
DOI: 10.1002/ece3.5031
Intraspecific and interspecific trait variability in tadpole meta‐
communities from the Brazilian Atlantic rainforest
Mainara Xavier Jordani
1, Nicolas Mouquet
2, Lilian Casatti
3, Marcelo Menin
4, Denise
de Cerqueira Rossa‐Feres
5, Cécile Hélène Albert
61Programa de Pós‐graduação em Biologia Animal, Universidade Estadual Paulista (UNESP), São José do Rio Preto, Brazil 2Univ Montpellier, CNRS, Ifremer, IRD, MARBEC, Montpellier, France 3Departamento de Zoologia e Botânica, Universidade Estadual Paulista (UNESP), São José do Rio Preto, Brazil 4Departamento de Biologia, Universidade Federal do Amazonas (UFAM), Manaus, Brazil 5Laboratório de Ecologia Teórica, Departamento de Zoologia e Botânica, Universidade Estadual Paulista (UNESP), São José do Rio Preto, Brazil 6Aix Marseille Univ, Univ Avignon, CNRS, IRD, IMBE, Marseille, France Correspondence Mainara Xavier Jordani, Programa de Pós‐ graduação em Biologia Animal, Universidade Estadual Paulista (UNESP), São José do Rio Preto, Brazil. Email: mainaraxj@yahoo.com.br Funding information Agence Nationale de la Recherche, Grant/ Award Number: ANR‐11‐IDEX‐0001‐02 and ANR‐11‐LABX‐0061; Conselho Nacional de Desenvolvimento Científico e Tecnológico, Grant/Award Number: 301755/2013‐2, 302328/2017‐3, 303522/2013‐5 and 563075/2010‐4; Fundação de Amparo à Pesquisa do Estado de São Paulo, Grant/ Award Number: 13/26406‐3, 15/14859‐9 and 2010/52321‐7
Abstract
1. A better understanding of species coexistence and community dynamics may benefit from more insights on trait variability at the individual and species levels. 2. Tadpole assemblages offer an excellent system to understand the relative influ‐ ence of intraspecific and interspecific variability on community assembly, due to their high phenotypic plasticity, and the strong influence that environmental vari‐ ables have on their spatial distribution and individual performance. 3. Here, we quantified the intraspecific and interspecific components of tadpoles’ trait variability in order to investigate their relative role in shaping tadpole communities. 4. We selected eight functional traits related to microhabitat use, foraging strate‐ gies, and swimming ability. We measured these traits on 678 individuals from 22 species captured in 43 ponds in the Atlantic Forest. We used single‐ and multitrait analyses to decompose trait variability. To explore the action of external and inter‐ nal filtering on community assembly, we used a variance decomposition approach that compares phenotypic variability at the individual, population, community and regional levels. 5. On average, 33% of trait variability was due to within‐species variation. This de‐ composition varied widely among traits. We found only a reduced effect of exter‐ nal filtering (low variation in the height of the ventral fin within ponds in comparison to the total variation), whereas the internal filtering was stronger than expected. Traits related to the use of different microhabitats through the water column were generally less variable than traits related to swimming ability to escape of preda‐ tors, with tail traits being highly variable within species. 6. Our study highlights the importance of incorporating both intraspecific and inter‐ specific, trait differences and of focusing on a diversity of traits related to both stabilizing niche and fitness differences in order to better understand how trait variation relates to species coexistence.
1 | INTRODUCTION
For decades, ecologists have been interested in understanding how species trait differences drive the assembly of communities. Though intraspecific trait variation (hereafter, ITV) is at the origin of the theory of evolution, it has for a while been overlooked in trait‐based ecology, that was searching for big patterns among spe‐ cies (Hart, Schreiber, & Levine, 2016; Layman, Newsome, & Gancos, 2015; McGill, Enquist, Weiher, & Westboy, 2006). ITV combines genetic diversity and phenotypic plasticity, and is assumed to play a major role in community assembly processes (Violle et al., 2012). For instance, ITV can mediate species coexistence (Turcotte & Levine, 2016), determine the ability of natural systems to cope with environmental changes (González‐Suárez & Revilla, 2013; Jung et al., 2014; Laurila, Karttunen, & Merilä, 2002), and control compet‐ itive or trophic interactions (Hughes, Hanley, Orozco, & Zerebecki, 2015; Le Bagousse‐Pinguet et al., 2015; Zhao, Villéger, Lek, & Cucherousset, 2014).
These recent findings have led to general ecological theo‐ ries being revisited in the light of ITV (Hart et al., 2016; Turcotte & Levine, 2016). After environmental filtering has excluded poorly adapted species, species coexistence is thought to be determined by a balance between two major opposing mechanisms: species fitness differences that drive competitive exclusion, and stabilizing niche differences that favor coexistence (Chesson, 2000). Traits related to fitness differences are those that favor one competitor over the other regardless of their relative abundance, while traits related to stabilizing niche differences are those that cause intraspecific inter‐ actions to be more limiting than interspecific interactions (Chesson, 2000; Kraft et al., 2015). By altering traits related to both mecha‐ nisms, ITV could enhance or impede species coexistence (Turcotte & Levine, 2016). However, it remains unclear what the general out‐ come might be. Turcotte and Levine (2016) found some evidence that ITV impact on stabilizing niche differences may either enhance coexistence by reducing interspecific competition (e.g., shift in re‐ source acquisition traits) or impede coexistence by leading to trait convergence and increased niche overlap. ITV impact on average fitness differences may also enhance species coexistence by mini‐ mizing the competitive disadvantages of subordinate species in com‐ petitive asymmetries (Le Bagousse‐Pinguet, Bello, Vandewalle, Leps, & Sykes, 2014), but this still has little empirical support (Turcotte & Levine, 2016).
Some tools have now been developed to better encompass ITV in community ecology (Carmona et al., 2012; Lepš, Bello, Šmilauer, & Doležal, 2011; Violle et al., 2012). The new T‐statistics variance ratios framework is one of these tools developed to ana‐ lyze trait patterns in order to infer hypotheses about community assembly processes while accounting for ITV (Taudière & Violle., 2016; Violle et al., 2012). By comparing the variance of trait val‐ ues at different scales (population, community, regional pool), this framework allows detection of the signature of external (sorting of species from a regional pool due to broad‐scale gradients) and in‐ ternal (microenvironmental heterogeneity and biotic interactions) filters on local trait value distributions, while accounting or not for ITV (Violle et al., 2012). Recent studies have suggested that dis‐ entangling multiple functional diversity components may provide a better understanding of the processes involved in the structure of plant communities (Le Bagousse‐Pinguet et al., 2014). To date, research on ITV and community assembly has mainly focused on plants (but see Zhao et al., 2014; Griffiths, Louzada, Bardgett, & Barlow, 2016). For example, the T‐statistics variance ratios frame‐ work has already been applied to detect the effects of external and internal filters on the assembly of plant communities across soil (Le Bagousse‐Pinguet et al., 2014) and elevation gradients (Neyret et al., 2016).
Anuran tadpole meta‐communities have been broadly used as a model system to study competition (Richter‐Boix, Llorente, & Montori, 2007), and offer an excellent system to explore the role of ITV in trait‐based community assembly processes. Firstly, tadpoles have been found to exhibit extensive trait phenotypic variability (e.g., morphology, physiology and behavior), in response to both physical environment (Eterovick & Barata, 2006; Eterovick, Lazarotti, Franco, & Dias, 2010), and density of predators and competitors (Michel, 2012; Relyea, 2005). Secondly, tadpoles represent the major part of the biomass in freshwater habitats (Altig, Whiles, & Taylor, 2007), being important primary and secondary consumers, and therefore are known to play a major role in ecosystem functioning (Strauβ, Reeve, Randrianiaina, Vences, & Glos, 2010). However, we still know little regarding the assembly of natural communities of amphibians at larval stage (Grözinger, Thein, Feldhaar, & Rödel, 2014; Strauβ et al., 2010; Zhao, Li, Wang, Xie, & Jiang, 2017). Here, we use a trait‐based approach on tadpole communities to quantify the intraspecific and interspecific components of tadpole trait variation, and infer hypotheses regarding the role of ITV in the assembly of these communities on the basis of the T‐statistics vari‐ ance ratios framework (Violle et al., 2012). By analyzing a set of eight traits measured on individual tadpoles in 43 ponds in the Atlantic Forest, we address two main questions:
1. How is trait variation structured within and among species? 2. What is the importance of external and internal filters in shaping
the assembly of tadpole communities, and what is the contribu‐ tion of ITV to these processes? Several studies have indicated that biotic interactions have less influence in shaping tadpole
K E Y W O R D S
community assembly, ecological niche, fitness differences, phenotypic variability, stabilizing niche differences
communities than environmental or stochastic factors (Kopp & Eterovick, 2006; Strauβ et al., 2010). Tadpoles can also use a great diversity of microhabitats and exhibit high levels of functional re‐ dundancy (Eterovick, 2003; Grözinger et al., 2014; Richter‐Boix et al., 2007; Strauβ et al., 2010). We thus expect external filters to play a major role in the communities’ structure and internal filters to be less strong, with high trait overlap among populations within a community.
From our results, we infer hypotheses on how the different levels of ITV found for the different traits we measured may pro‐ mote coexistence within tadpole communities. We assume traits related to stabilizing niche differences—that is, traits related to the use of microhabitats, such as those determining the individual's position in the water column—to be less variable within species than those related to fitness differences—that is, the traits related to foraging strategies and swimming capacity (Turcotte & Levine, 2016).
2 | MATERIALS AND METHODS
2.1 | Study area
The Atlantic Rain Forest is a biodiversity hotspot (Myers, Mittermeier, Mittermeier, Fonseca, & Kent, 2000) and a Biosphere Reserve (UNESCO). Its lowlands are distributed from 5 to 50 m above sea level, between 16° to 24° latitude south (IBGE, 2012), across the coastal plains of Brazil. The vegetation is character‐ ized by macro‐ and meso‐phanerophytes, lianas and epiphytes (IBGE, 2012). We sampled communities in four different localities (Ubatuba, Bertioga, Itanhaém, and Iguape municipalities) in São Paulo state, southeastern Brazil (Supporting information Figure S1). Bertioga, Iguape and Itanhaém have a tropical climate, with no dry season (Af in Köppen‐Geiger classification, Alvares, Stape, Sentelhas, Gonçalves, & Sparovek, 2013). The climate in Ubatuba is humid subtropical, with influence of the oceanic climate and hot summers (Cfa in Köppen‐Geiger classification, Alvares et al., 2013). Both climates are characterized by high temperatures (mean annual temperature: Af = 21.5°C; Cfa = 20.8; Alvares et al., 2013) and high rainfall evenly distributed throughout the year (cu‐ mulative annual rainfall: Af = 2,309 mm; Cfa = 2,243 mm; Alvares et al., 2013).
2.2 | Database description
A standardized protocol was used to sample tadpole communities and characterize 43 ponds in the Atlantic Forest in 2011–2013. Tadpoleswere sampled using a hand dip‐net (32 cm diameter) with a 3 mm2
mesh. Dip‐net surveys were carried out throughout the total area of aquatic habitats, to ensure a good representation of all the microhabi‐ tats (Rossa‐Feres & Jim, 1996; Skelly & Richardson, 2010). The ponds sampled represent the wide variety of environmental conditions in the study area, presenting contrasting size, water depth, amount of aquatic vegetation, substrate types on the bottom, and percentage of canopy cover (Supporting information Table S1). All collected tad‐ poles were conserved in a solution of alcohol 70% and formaldehyde 15% (1:1) and deposited in a scientific collection (DZSJRP Amphibia‐ Tadpoles collection. Department of Zoology and Botany, Universidade Estadual Paulista, São José do Rio Preto, São Paulo, Brazil).
We measured traits on 1 to 20 individuals for each species occurring in each pond. For logistical reasons, and due to the ag‐ gregative behavior of some species that results in very disparate abundances (very high or very low, Hoff, Blaustein, McDiarmid, & Altig, 1999), we picked 20 as a manageable maximum number of individuals per species per pond. Individuals were all at the de‐ velopmental stages from 27 to 37 (Gosner, 1960). This phase is considered to be a developmental “climax” period, when changes in body parts of the tadpoles are isometric, and when they are best suited to morphological intraspecific and interspecific compari‐ sons, with a lesser impact of ontogeny (Gosner, 1960; Grosjean, 2005; Wassersug, 1973). We thus measured traits on 678 tadpoles from 22 anuran spe‐ cies (Supporting information Table S2). This full dataset was used to investigate the structuration of trait variation within and among spe‐ cies (question 1). To assess the generality of our results with regard to question 1, we also used a supplementary dataset from the Amazon Forest, that is, a different biome (see Supplementary Material). This dataset contains 60 tadpoles from 13 species (Supporting informa‐ tion Table S3), collected (similar protocols as for the Atlantic for‐ est, except that the development stages are from 33 to 37) in 31 ponds in three different localities (Iranduba, Manaus, and Presidente Figueredo cities) in Amazonas state (Northern Brazil). To investigate the importance of external and internal filters in the assembly of tadpole communities (question 2), we included only the tadpole communities with more than one species and more than one individual per species, which are the minimum requirements for calculation of the T‐statistics. Thus, for this second question, we reduced the dataset to a subset of 240 tadpoles from 18 species collected in 11 ponds.
2.3 | Functional traits
Eight functional traits were obtained from the 10 morphological features we measured on each tadpole (Table 1, Figure 1), following Altig and McDiarmid (1999) and Provete et al. (2013). All morpholog‐ ical features were measured in millimeters under a stereoscopic mi‐ croscope with ocular micrometer (Leica MZ75), and were conducted by the same person to ensure consistency. For all traits, we used relative measures to control as much as possible for the ontogenetic variability (Supporting information Figure S2). The traits considered here are known to be related to essential elements of the ecology of tadpoles, namely resource use, position in the water column (Alford, 1999; Altig & Johnston, 1989; Van Buskirk, 2009; Hoff et al., 1999), body hydrodynamics, swimming ability (Altig & McDiarmid, 1999), feeding behavior (Altig & Johnston, 1989; Harris, 1999), and chemi‐ cal perception (Altig & McDiarmid, 1999).
2.4 | Data analysis
2.4.1 | Decomposition of trait variation within and
among species
In order to decompose the variation of traits within and among spe‐ cies, we followed Albert et al. (2010). As different numbers of in‐ dividuals and populations have been sampled for each species, we used a resampling procedure to balance the data sets (equal number of individuals) to perform both single and multitrait analyses. Initially, we determined the smallest number of individuals measured within species (n = 6). The five species with less than six individuals were removed from the analyses (Supporting information Table S2). Then, we subsampled the original dataset by drawing randomly 1,000 bal‐ anced data subsets containing the smallest number of individuals per species (Albert et al., 2010).For the single‐trait approach, we used linear mixed models with restricted maximum likelihood estimation (Albert et al., 2010; Messier, McGill, & Lechowicz, 2010). For each trait we constructed the models trait ~ (1|species) that included no fixed effect and spe‐ cies as random intercept. We also tested the spatial structure of ITV with models including both species and populations nested within localities as random intercepts [i.e., trait ~ (1|species) + (1|locali‐ ties/ponds)]. The model structure corresponds to the incompletely nested structure of the sampling design; species are not nested within ponds, nor ponds within species, because the same species could be found in different ponds (Auger & Shipley, 2013). Results were expressed as relative proportions of variance at each level.
To decompose the variance for the eight traits simultaneously (multitraits approach), we used between‐groups and within‐groups principal components analyses (PCA; Albert et al., 2010). Species were used as the grouping factor in these analyses. Between‐groups
TA B L E 1 Functional traits measured on individual tadpoles from Atlantic Forest
Abbreviations Trait index description Biological interpretation Ecological function
BCI Body compression index = body maximum height (BMH)/body maximum width (BMW) Higher values indicate globular body, and lower values, depressed body Variations in tadpoles body linked with variations in the height of fins determine the water column position used by tadpoles (Altig & Johnston, 1989; Altig & McDiarmid, 1999; Van Buskirk, 2009) RDE Relative diameter of the eyes = eye diameter (ED)/body maximum length (BML) Higher values indicate bigger eyes, and lower, smaller eyes Relates to tadpoles’ ability to perceive predators (mainly fish) in water bodies with different turbidity levels (Altig & Johnston, 1989; Altig & McDiarmid, 1999) HDF Height of the dorsal fin = height maximum of dorsal fin (HDF)/ body maximum height (BMH) Higher values indicate higher fin, and lower
values lower fin Relates to tadpoles’ ability to move through the water column and keep nektonic tadpoles in equilibrium (Altig & Johnston, 1989; Altig & McDiarmid, 1999; Hoff & Wassersug, 2000) HVF Height of the ventral fin = height maximum of ventral fin (HVF)/ body maximum height (BMH) Higher values indicate higher fin, and lower
values lower fin Relates to tadpoles’ ability to move through the water column and keep nektonic tadpoles in equilibrium (Altig & Johnston, 1989; Altig & McDiarmid, 1999) RWT Relative width of the tail = tail muscle width (TMW)/body maximum width (BMW) Higher values indicate broad tail muscle, and
lower values, narrow tail muscle Relates to tadpoles’ use of different microhabi‐tats (position in the water column), swimming mechanisms and styles. It is also related to ability (burst speed) to escape from active predators (Altig & McDiarmid, 1999; Van Buskirk, 2009; Van Buskirk & Relyea, 1998) TCI Tail compression index = tail muscle height (TMH)/tail muscle width (TMW) Higher values indicate compressed and
thinner tail, and lower values, thicker tail Relates to tadpoles’ use of different microhabi‐tats (position in the water column), swimming mechanisms and styles (Altig & McDiarmid, 1999) DNS Distance from nares to snout (DNS) Higher values indicate nares closer to eyes and lower values anterior nares (closer to snout) Position of nares relates to chemical perception. Anterior nares facilitate the search for food resources and detection of chemicals cues of predators (Altig & McDiarmid, 1999) RDN Relative diameter of the nares = nares diameter (ND)/body maximum length (BML) Higher values indicate bigger nares, and lower, smaller nares Variations in nares diameter relates to chemical perception of smells due to, in bigger nares, circulates larger volume of water (Altig & McDiarmid, 1999)
(respectively within‐) PCA uses the correlation matrix based on group means (respectively centered on group means), and finds linear combinations of variable maximizing variance among groups (respectively within groups) instead of the overall variance (Dodélec & Chessel, 1991). The inertia calculated in a between‐groups PCA represents the part of the total variance due to the differences be‐ tween groups (Dodélec & Chessel, 1991). Both analyses lead to an identification of the traits that are responsible for trait variability among and within species.
2.4.2 | Importance of external and internal filters in
shaping tadpole communities
In order to assess the influence of external and internal filtering in shaping tadpole communities, and the importance of ITV in these processes, we calculated T‐statistics (Violle et al., 2012). Trait vari‐ ation (from individual trait measurements) can be decomposed into six components: (a) variance of trait values among individuals within
populations (σIP2); (b) variance of trait values among individuals
within communities (σIC2); (c) variance of trait values among individ‐
uals within the regional pool (σIR2); (d) variance of population mean
trait values within communities (σPC2); (e) variance of population
mean trait values within the regional pool (σPR2); and (f) variance of
community mean trait values within the regional pool (σCR2). T‐sta‐
tistics are ratios of these components that depict how some subsets of the trait variance are organized across spatial scales and biological levels.
TIP.IC is the ratio between the variance of trait values among
individuals within populations (σIP2), and the variance of trait val‐
ues among individuals within communities (σIC2). It quantifies the
overlap among species trait distributions within communities while
accounting for individual trait variation. High values of TIP.IC (close
to 1) indicate high trait overlap among coexisting species, and mean that processes that lead to trait differentiation within species (e.g., asymmetric competition) are stronger than processes that lead to trait differentiation among species (e.g., specialization in microhabi‐ tat); competition and specialization operate at the individual and not at the species level. TIC.IR is the ratio between the variance of trait values among in‐ dividuals within communities (σIC2), and the variance of trait values among individuals within the regional pool (σIR2). It quantifies the overlap among community trait distributions within the region, while
accounting for individual trait variation. High values of TIC.IR (close to
1) indicate strong trait overlap among communities, and can be in‐ terpreted as low levels of external filtering (e.g., operated by climate, water depth, predation pressure) at the individual level.
TPC.PR is the same ratio as TIC.IR, but with population‐level means. It quantifies the overlap among community trait distributions within the region without accounting for individual trait variation. High val‐
ues of TPC.PR (close to 1) can be interpreted as low levels of external
filtering at the species level.
To test the significance of T‐statistics, observed values (Iobs)
were compared with values obtained with randomized data (Isim).
Standardized effect sizes (SES) were calculated:
where Isim and Ssim are respectively the mean value and the stand‐
ard deviation of the randomized values (n = 1,000 randomizations). SES measure the number of standard deviations that differentiate the observed index from the mean index of the simulated communi‐ ties (Gotelli & McCabe, 2002). Negative (respectively positive) SES
SES =(Iobs− Isim) ∕Ssim,
F I G U R E 1 Visual representation of the 10 external morphological features of tadpoles used to determine the 8 tadpole traits (BML: body
maximum length; BMH: body maximum height; BMW: body maximum width; DNS: distance from nares to snout; ED: eye diameter; HDF: maximum height of dorsal fin; HVF: maximum height of ventral fin; ND: nares diameter; TMW: tail muscle width; TMH: tail muscle height). Species: Crossodactylus caramaschii. Scale: 10mm
values reflect T‐statistic values that are lower (respectively higher) than random expectations, thus indicating trait distribution overlap that is lower (respectively higher) than random expectations.
In the cati package, randomizations are adapted to each met‐
ric (Taudière & Violle, 2016): (a) for TIP.IC, individual trait values are
permuted within communities, keeping species composition un‐ changed, but breaking the link between species and trait values (null
model = “local”), (b) for TIC.IR, trait values are permuted for all indi‐
viduals in all communities in the regional pool, keeping the number of individuals in each community unchanged, but breaking the link between species and trait values at regional scale (null model = “re‐ gional.ind”), (c) for TPC.PR, population‐level trait values are permuted within the region, keeping the number of populations in each com‐ munity unchanged (null model = “regional.pop.”). Significance of the effect, that is, departure from random values, is assessed for each trait and each metric with a bilateral test. We chose a 5% significance level, meaning significant observed values are below the 0.025 quantile of random values or above their 0.975 quantile. To test the potential effect of pond species richness on the ob‐ served internal filtering, linear regression models were performed
for each trait between TIP.IC and species richness.
All statistics analysis we performed in R 3.3.1 (R Core Team, 2016), using different packages: lme4 (Bates, Maechler, Bolker, & Walker, 2015) for mixed models, ade4 (Dray & Dufour, 2007) for multivariate analyses, and cati for the T‐statistics (Taudière & Violle, 2016).
3 | RESULTS
3.1 | Decomposition of trait variation within and
among species
On average, single‐ and multitraits analyses led to similar results re‐ garding the relative contribution of intraspecific (33% and 30%) and interspecific (66% and 70%) components to the total trait variation (Table 2). We found relatively similar results with the dataset from the Amazon (see Supporting information Appendix S1), in which the relative contributions were: 19% for intraspecific and 80% for inter‐ specific trait variability.For single‐trait analysis, the contribution of ITV to the total variability differed considerably among traits (16%–69%). While traits related to body shape were mostly variable among species, the height of dorsal fin (HDF) and the tail compression index (TCI) were more variable within than between species, with ITV reach‐ ing up to 69% of the total variance (Table 2). We also detected high ITV (>85%) in the tail compression index (TCI) for tadpoles from the Amazon (Supporting information Appendix S1). Regarding the spatial structure, we did not detect any variation among localities (Bertioga, Iguape, Itanhaém, Ubatuba). We found only a small contribution (0%–15%) of differences among ponds within localities, mainly for the height of dorsal fin (HDF) and the tail compression index (TCI; Table 2). T A B LE 2 D ec om po si tio n of ta dp ol e tr ai t v ar ia tio n in in tr as pe ci fic a nd in te rs pe ci fic c om po ne nt s an d in cl ud in g th e ef fe ct o f d iff er en t s pa tia l s ca le s (w ith in s pe ci es , b et w ee n sp ec ie s, be tw ee n po pu la tio ns , a nd b et w ee n re gi on s) Func tio na l t ra it s In tr as pe ci fic v ar ia bi lit y In ter sp ec ifi c v ar ia bi lit y Sp ati al d ec om po si tio n W ith in spec ies Be tw ee n spec ies B et w ee n p on ds n es te d i n loc al iti es B et w een loc al iti es B od y co m pr es si on in de x 0.1 82 [0 .1 82 –0 .1 85 ] 0. 81 6 [ 0. 81 4– 0. 81 8] 0. 20 0 0.7 90 0.0 09 0 Re la tiv e di am et er o f e ye s 0.1 63 [0 .1 60 –0 .1 65 ] 0. 83 6 [ 0. 83 4– 0. 83 9] 0.1 53 0. 83 0 0.0 16 0 H ei gh t o f t he d or sa l f in 0. 62 4 [ 0. 62 0– 0. 62 9] 0. 37 6 [0. 37 1– 0. 38 0] 0.4 43 0. 397 0. 155 0.0 04 H ei gh t o f t he v en tr al fi n 0. 34 3 [0. 34 0– 0. 34 5] 0. 65 7 [ 0. 65 5– 0. 65 9] 0. 24 5 0. 67 9 0.0 62 0.0 12 Re la tiv e w id th o f t he ta il 0. 25 5 [0 .25 4– 0. 25 7] 0. 74 4 [ 0. 74 3– 0. 74 6] 0. 19 4 0. 73 0 0.0 66 0.0 09 Ta il co m pr es si on in de x 0. 69 3 [ 0. 68 7– 0. 69 9] 0. 30 6 [0 .3 00 ‐ 0. 31 3] 0.63 6 0. 275 0.0 87 0.0 02 D is ta nc e fr om n ar es to s no ut 0.1 53 [0 .1 52 –0 .1 55 ] 0. 84 6 [ 0. 84 5– 0. 84 8] 0.1 37 0. 823 0.0 38 0 Re la tiv e di am et er o f n ar es 0. 26 0 [0. 25 9– 0. 26 3] 0. 73 9 [ 0. 73 7– 0. 73 4] 0. 247 0. 687 0.0 63 0.0 02 A ve ra ge o f s in gl e‐ tr ai t a na ly se s 0. 33 4 [0 .33 2– 0. 33 7] 0. 66 5 [ 0. 66 2– 0. 66 7] M ult itr ai ts a na ly se s 0. 29 5 [0 .29 4– 0. 29 6] 0. 70 5 [ 0. 70 4– 07 06] Re la tiv e pr op or tio ns o f v ar ia nc e ar e gi ve n fo r e ac h of e ig ht t ad po le t ra its s ep ar at el y (a ft er a r es am pl in g pr oc ed ur e) , a s an a ve ra ge a cr os s tr ai ts (s in gl e‐ tr ai t a na ly si s) , a nd fo r a ll tr ai ts to ge th er (m ul tit ra its an al ys is ). Sq ua re b ra ck et s re pr es en t t he 9 5% c on fid en ce in te rv al s fr om th e re sa m pl in g pr oc ed ur e. T he la rg es t ( in tr as pe ci fic o r i nt er sp ec ifi c) c om po ne nt is in b ol d.
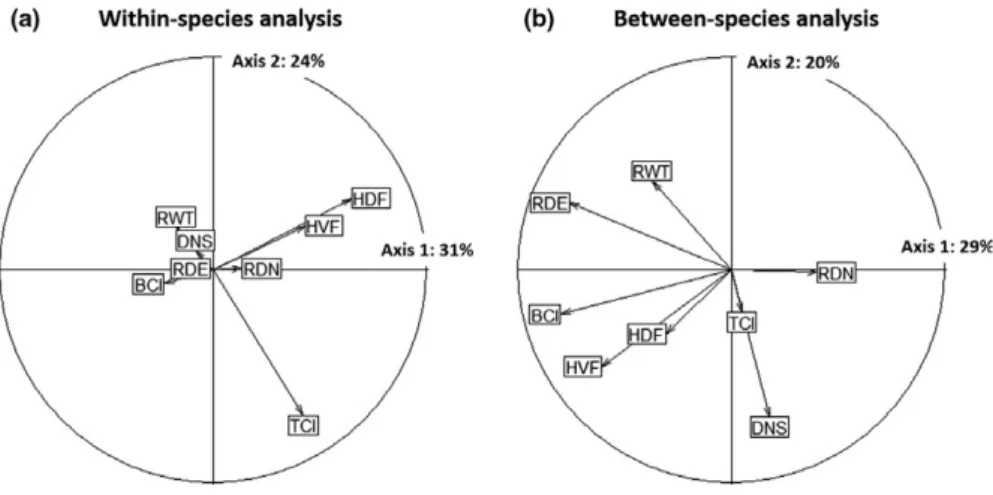
For multitrait analysis, the within‐species trait variability was mainly structured by a first axis (31% of variance) driven by the height of dorsal fin (HDF), and by a second axis (24% of variance) driven by the tail compression index (TCI; Figure 2a). Within species, individual tadpoles thus go from narrow dorsal fins and slightly compressed tails (top left quadrant, Figure 2a), to broad dorsal fins and highly compressed tails (bottom right quadrant), these representing different swimming abilities and position in the water column. Between‐species, trait variability was mainly structured by a first axis (29% of variance) driven by the body compression index (BCI), the relative diameter of eyes (RDE), and the height of the ventral fin (HVF), and by a second axis (20% of variance) driven by the distance from nares to snout (DNS) and the relative width of the tail (RWT; Figure 2b). Species thus go from highly to slightly globular bodies (first axis), and from nares close to the eye and narrow tail muscle, to nares distant from the eyes and large tail muscle (second axis; Figure 2b).
3.2 | Importance of external and internal filters in
shaping tadpole communities
Figure 3 gives the departure of observed T‐statistics values from randomized values for each trait. The results were mainly consistent
among traits. The mean values of TIP.IC were lower than expected
by chance for all traits, except one, the tail compression index (TCI), which is the trait with the largest ITV (Table 2). Thus, for most ponds (except the ones within or to the right to the boxes), species have nonoverlapping trait distributions, that is, two individuals belonging to a particular population display more similar trait values than two individuals drawn randomly from the pond.
Contrastingly, the values of TIC.IR did not differ from random
expectations on average and for most of the ponds (Figure 3). Communities have trait distributions that are overlapping no more and no less than random ones when considering individual trait val‐ ues. Two individuals drawn randomly from a given pond are not nec‐ essarily more similar or more different than two individuals drawn randomly from the regional pool. Similarly, for all the traits (and for most of the ponds), mean values of TPC.PR did not differ from random expectations, meaning that communities have partially overlapping trait distributions when considering population‐level trait values (Figure 3).
Values of TIP.IC tend to be negatively related to species richness
for most of the traits except tail compression index, diameter from nares to snout, and relative diameter of the nares (Supporting infor‐ mation Figure S3).
4 | DISCUSSION
Here, we proposed one of the first studies to investigate the effect of ITV on animal assemblages. While we observed that intraspe‐ cific variability (ITV) is generally lower than interspecific variability (about 30% of total trait variation); we also observed that ITV can be particularly high for some traits such as the tail compression index (>60% in both datasets).
Our results also point to strong effects of internal filtering in shaping tadpole communities. Below, we discuss these results and the discrepancies among traits in the light of species coexistence.
4.1 | Tadpole traits variability within species
We found about a third of trait variation in tadpole communi‐ ties from the Atlantic Forest to occur within species, with two traits being more variable within than among species (height of the dorsal fin‐HDF and tail compression index‐TCI). Interestingly, results were similar with a second dataset from Amazonia, an‐ other tropical forest in Brazil (Supporting information Appendix S1). This variability was not simply driven by ontogeny, because all the stages presented similar variability in the different traits (Supporting information Figure S2). This is in agreement with the literature on tadpoles, which suggests that morphological charac‐ ters are highly variable within species because anuran larvae are highly adaptive to their environment (Grosjean, 2005). Grosjean (2005) also found tail traits to be more variable than body traits, as we did. Here, the tail compression index (TCI) presented high levels (69%) of intraspecific variability in both datasets (Atlantic
F I G U R E 2 Correlation circles regarding the first two axes of the (a) within‐species and (b) between‐species PCA on functional traits for tadpole communities from Atlantic Forest. BCI: Body compression index; DNS: Distance from nares to snout; HDF: Relative height of the dorsal fin; HVF: Relative height of the ventral fin; RDE: Relative diameter of the eyes; RWT: Relative width of the tail; RDN: Relative diameter of the nares; TCI: Tail compression index
forest and Amazonia). Several studies have also shown that wide morphological variations can be found within a single genus (Melanophryiniscus, Baldo et al., 2014), and even single species (Zhao et al., 2017). Interestingly, our results are overall in agree‐ ment with decompositions of trait variation performed in plants, as most studies have found between 25% and 33% of trait vari‐ ation to occur within species (Albert et al., 2010; Messier et al., 2010; Siefert et al., 2015). Recent studies on animal communities have also shown that ITV can be pretty wide for certain organisms such as fishes (Zhao et al., 2014), and less wide for others such as insects (dung beetles, Griffiths et al., 2016). If a third of ITV means that ITV is smaller than variation among species, previous studies have shown that such a nonnegligible amount of ITV may already play a strong role in community assembly and diversity (Albert et al., 2012; Griffiths et al., 2016; Jung, Violle, Mondy, Hoffmann, & Muller, 2010).
4.2 | Internal filtering more than external filtering
shapes tadpole communities
For all traits, we found trait variation in tadpoles to be largely due to local differences, and little to differences among populations or species in different localities or ponds. These results are in agree‐ ment with previous studies concluding that morphological variations occur over short distances, and are poorly explained by broad‐scale environmental gradients (Grözinger et al., 2014). Tadpoles from a
single species can adapt to the availability of microhabitats or to local conditions (e.g., canopy cover, predation pressure, density‐de‐ pendence, Strauβ et al., 2010), which means ITV could be locally high for traits related to their position in the water column (body shape) or to the use of different resource types (Eterovick & Fernandes, 2001; Kopp & Eterovick, 2006). However, this contrasts with the findings of Zhao et al. (2017), who found traits to be also widely vari‐ able among populations for a given species.
Contrary to our expectations, we found little support for a
contribution of external filters (TIC.IR and TPC.PR not significantly dif‐
ferent from randomizations) to the structuration of tadpole com‐ munities. For most ponds, the height of the ventral (HVF) fin and relative diameter of the eyes (RDE) showed some signs of external
filtering at the individual level (TIC_IR below random expectations).
For the other traits, some of the ponds did too. These signs of ex‐ ternal filtering were not visible at the population level (TPC_PR). This means that the population mean trait values do not differ from the regional mean trait values, but that individual trait values are less variable within populations than at the regional scale. A lower vari‐ ability in the height of the ventral fin (HVF) and relative diameter of the eyes (RDE) in comparison to the regional pool might be ex‐ plained by water depth, because shallow ponds harbor only benthic tadpoles (Queiroz, Silva, & Rossa‐Feres, 2015) that have smaller ventral fins and smaller eyes than nektonic ones (Altig & Johnston, 1989; Altig & McDiarmid, 1999). This is not clearly supported by our data (no effect of water depth of trait variability). Alternatively,
F I G U R E 3 Standardized effect size (SES) of T‐statistics for eight tadpole functional traits (BCI: Body compression index; DNS: Distance
from nares to snout; HDF: Relative height of the dorsal fin; HVF: Relative height of the ventral fin; RDE: Relative diameter of the eyes; RWT:
Relative width of the tail; RDN: Relative diameter of the nares; TCI: Tail compression index). Three T‐statistics are given: (a) TIP.IC— the within‐
population variance relative to the total variance in the community; (b) TIC.IR—community‐wide variance relative to the total variance in the
regional pool, assessed at the individual level; (c) TPC.PR—community‐wide variance relative to the total variance in the regional pool, assessed
via population‐level means. For a given trait and a given metric, dots represent the SES values for each pond, crossed circles represent the SES value averaged across ponds, and boxes give the average confidence interval (0.025–0.975) across 1,000 randomizations for each pond. For a given metric, the mean of SES (crossed circle) is significantly different from the null distribution if not embedded within the box, and dots if they have a colored background.
tadpoles tend to develop large tails and smaller bodies when they are under predation pressure (Van Buskirk & McCollum, 2000; Relyea, 2002), which may also lead to an external filtering for those ponds in which predators occur. We do not have any information on the occurrence of predators, such as fishes, to test this potential explanation.
Contrary to our expectations, we also found strong signs of in‐
ternal filtering in tadpole communities. TIP.IC were for the most part
lower than expected by chance for all traits except the tail compres‐ sion index (TCI), thus indicating little overlap of trait distributions among populations within communities. Local processes including biotic interactions and the use of microhabitats is thus key to ex‐ plaining tadpole assemblages (but see, Kopp & Eterovick, 2006; Strauβ et al., 2010). We acknowledge, however, that the results pre‐ sented here rely on trait‐based and pattern‐based correlative meth‐ ods from which processes can only cautiously be inferred (Enquist et al., 2015). The degree of trait variability and the detection of trait
overlap within communities also largely depend on the trait under investigation. We discuss these discrepancies in the light of the framework proposed by Turcotte and Levine (2016) to relate ITV with species coexistence.
4.3 | Implications for tadpoles’ coexistence
Turcotte and Levine (2016) proposed that coexistence is enhanced when traits related to stabilizing niche differences are less variable within species than those related to fitness differences (Figure 4).
Coexistence would be promoted when traits related to fit‐
ness differences present weak internal filtering (high TIP.IC values),
which means individuals from different species may have similar trait values, and competitive outcome depends on the individuals (e.g., asymmetric competition, Le Bagousse‐Pinguet et al., 2014). We found for instance, high intraspecific variation and reduced internal filtering for tail compression index (TCI), which relates
F I G U R E 4 Graphical representation of how coexistence is mediated by intraspecific variability regarding both stabilizing niche
differences (x‐axis) and average fitness differences (y‐axis). After Turcotte and Levine (2016). According to theses authors, stable coexistence (gray area) is predicted when niche differences exceed fitness differences. If not, competitive exclusion (white area) is predicted. (a–d) Give
the hypothetical link between trait differences and the corresponding TIP‐IC values. Examples show two competing tadpoles with different
trait values. Case 1 (bottom left): if both tadpoles have similar swimming capacity due to similar relative width of the tail‐RWT (fitness differences b), and use the same microhabitats due to similar body compression index‐ BCI (niche differences c), one may outcompete the other due to resource limitation. Case 2 (top right): if both tadpoles use different microhabitats due to different body compression index‐ BCI (niche differences d), but they have strong differences in swimming capacity due to different relative width of the tail‐RWT (fitness differences a), one may outcompete the other because niche difference does not compensate for fitness advantage of a higher ability to escape. Case 3 (bottom right): if both tadpoles have similar swimming capacity due to similar relative width of the tail‐RWT (fitness differences b), but they use different microhabitats due to different body compression index‐BCI (niche differences d), they can coexist
to swimming ability, a key component of fitness differences (es‐ cape from predator). This is less clear, however, for other traits that may relate to fitness differences such as the relative width of the tail (RWT) (swimming ability and escape from predator) and distance from nares to snout (DNS) and relative diameter of the nares (RDN) (foraging efficiency and food acquisition), that present stronger internal filtering (Figure 3). Coexistence would also be favored when traits related to niche differences present
strong internal filtering (low TIP.IC values), which means individ‐
uals from a given species can specialize in a type of resource/ microhabitat, which helps in avoidance of interspecific competi‐ tion. This is what we found for the body compression index (BCI) and the relative diameter of the eyes (RDE) (strong internal filter‐ ing and medium intraspecific trait variation), and is less true for height of the dorsal and ventral fin (HDF and HVF, respectively) that present intermediate levels of filtering; these four traits re‐ late to the use of different food and microhabitats (position in the water column), and could thus be associated with stabilizing niche differences.
Examining the relationship between TIP.IC and species richness
mainly confirms these trends (Supporting information Figure S3). In species‐rich ponds, overlaps in trait distributions are slighter, which corresponds to increased “niche packing” (increased inter‐
nal filtering, i.e., lower TIP.IC values), for traits related to stabilizing
niche differences (relative diameter of the eyes ‐ RDE, body com‐ pression index—BCI, height of the dorsal fin‐HDF and height of the ventral fin‐HVF), and higher for traits related to fitness differ‐ ences (tail compression index—TCI). For the distance from nares to snout (DNS) and the relative diameter of nares (RDN), there is no
relationship between TIP.IC and species richness, and for relative
width of the tail (RWT) the relationship is negative (smaller over‐ laps in richer ponds).
Discrepancies among traits suggest that more attention should be paid to the different traits and their potential contribution to different assembly processes (Spasojevic & Suding, 2012). Though the ecological function attributed to each trait represents the best of our knowledge regarding the biology of neotropical tadpoles (Queiroz et al., 2015; Rossa‐Feres et al., 2015; Sousa et al., 2015, 2014), attributing one trait to one axis or the other is not straight‐ forward (Kraft et al., 2015). For instance, traits reflecting foraging efficiency via detection of chemicals or swimming ability may con‐ tribute to both predator escape and the use of various microhab‐ itats, therefore contributing to both fitness differences and niche differences. This may also explain the conflicting results obtained in recent studies. While some studies support equalizing mechanisms as drivers of community assembly (more trait overlap in species‐rich communities, for example, Le Bagousse‐Pinguet et al., 2014; Li et al., 2018), others better support niche theory (less trait overlap in species‐rich communities, for example, Siefert et al., 2015; Kumordzi et al., 2015) or neutral theory (no change, Bastias et al., 2017). These studies are, however, all focused on plant communities, communities that are typically richer than the ones presented here (3‐12 species per pond; e.g., Bastias et al., 2017).
4.4 | Sampling issues regarding ITV in tadpoles
Sampling design can strongly influence a study's results. Plot size, number of plots, number of measured individuals may strongly influence trait variation and its decomposition into intraspecific and interspecific (and intraspecific and interpopulation) com‐ ponents (Albert, 2015; Albert, Grassein, Schurr, Viellendent, & Violle, 2011; Siefert et al., 2015). The selection of species and individuals to be measured may also strongly influence our ability to detect assembly processes (Bentley et al. submitted). Violle, Borgy, and Choler (2015) advocated relaxing standardized pro‐ tocols when applying a trait‐based approach to plant community ecology. Rather than aiming to minimize intraspecific variability, the goal is to accurately quantify intraspecific variation within communities, which requires a random selection of individuals (de Bello et al., 2011).
Tadpoles are not plants, and protocols have to be adjusted to their specificities if we are to disentangle the role of ITV in assembly processes in natural tadpole assemblages. Firstly, due to the typi‐ cal anuran life history (large egg clutches and high juvenile mortal‐ ity rates, Duellman & Trueb, 1994), species abundances are very disparate, with up to several thousands of coexisting individuals— potentially siblings—in a single pond (Hoff et al., 1999). Accurate estimations of ITV thus probably require a minimum number of individuals to be measured. To make accurate estimates of species mean trait values, Hulshof and Swenson (2010) recommend mea‐ suring traits on 10–20 individuals per community for tropical trees. Griffiths et al. (2016) encourage the measurement of 30–60 individ‐ uals for dung beetles. Here, we picked 20 individuals mainly for lo‐ gistical reasons. Secondly, by definition tadpoles are larvae and their morphology is constantly changing (Grosjean, 2005). Here, we re‐ duced the ontogenetic variation by focusing on some developmental stages (27–37), considered to be a developmental “climax” period, when changes in body parts of the tadpoles are isometric and when they are best suited for morphological intraspecific and interspecific comparisons, with less impact of ontogeny (Gosner, 1960; Grosjean, 2005; Wassersug, 1973). In our case, traits were as variable within as among stages (see Figure S2). This means, however, that we only studied a portion of the ponds' filter‐feeding and grazing assem‐ blages; the stages we did not measure, along with other taxa, may also influence trait variability, and we may have underestimated the degree of overlap between species (Violle et al., 2012). Another option could have been to control for developmental stages in the statistical analyses, but this would require balancing the sampling design among stages (Zhao et al., 2017). Overall, our results emphasize the importance of incorporating both intraspecific and interspecific trait differences, and of focus‐ ing on traits related to both stabilizing niche and fitness differences in order to better understand how trait variation relates to species coexistence. Detecting trait overlap and niche packing may largely depend on the trait under investigation, and on whether or not ITV is accounted for. Future studies are needed to explore the differ‐ ent sources of variability in tadpole traits, and how they relate to
community assembly. If T‐statistics offer a new avenue to account for ITV, while investigating patterns associated with assembly pro‐ cesses, there is also a need for studies of animals and plants to move beyond pattern‐based and correlative assessments (Enquist et al., 2015).
ACKNOWLEDGEMENTS
M. X. Jordani was supported by Fundação de Amparo à Pesquisa do Estado de São Paulo (FAPESP, grants 13/26406‐3 and 15/14859‐9). L. Casatti, M. Menin, and D. C. Rossa‐Feres were supported by Conselho Nacional de Desenvolvimento Científico e Tecnológico (CNPq, 301755/2013‐2, 306314/2014‐2, and 302328/2017‐3, re‐ spectively). This work is part of the SISBIOTA project “Tadpoles from Atlantic Forest, Amazon, Pantanal, Cerrado, and transition zones: morphological description, spatial distribution and diversity patterns” (grants CNPq 563075/2010‐4 and FAPESP 2010/52321‐7, 2011‐2013). We also thank M. Raniero for helping with maps, K.O.R. Picheli for tadpole photos, and F. de Bello and Y. Pinguet who commented on earlier versions of the manuscript. This work contributes to the Labex OT‐Med (no. ANR‐11‐LABX‐0061) funded by the French government through the A*MIDEX project (no. ANR‐11‐IDEX‐0001‐02).
CONFLIC T OF INTEREST
None declared.
AUTHOR CONTRIBUTIONS
MXJ compiled the data. MXJ and CHA analyzed the data. MXJ, CHA, NM and DRF interpreted results. MXJ and CHA wrote the paper with contribution from all co‐authors.
ORCID
Mainara Xavier Jordani https://orcid. org/0000‐0002‐6056‐6044
REFERENCES
Albert, C. H. (2015). Intraspecific trait variability matters. Journal of
Vegetation Science, 26(1), 7–8.
Albert, C. H., de Bello, F., Boulangeat, I., Pellet, G., Lavorel, S., & Thuilller, W. (2012). On the importance of intraspecific variability for the quantification of functional diversity. Oikos, 121, 116–126. https:// doi.org/10.1111/j.1600‐0706.2011.19672.x
Albert, C. H., Grassein, F., Schurr, F. M., Viellendent, G., & Violle, C. (2011). When and how should intraspecific trait variability be con‐ sidered in plant ecology? Perspectives in Plant Ecology and Evolution,
13, 217–225. Albert, C. H., Thuiller, W., Yoccoz, N. G., Douzet, R., Aubert, S., & Lavorel, S. (2010). A multi‐trait approach reveals the structure and the rel‐ ative importance of intra‐vs. interspecific variability in plant traits. Functional Ecology, 24(6), 1192–1201. Alford, R. A.. (1999). Ecology: Resource use, competition, and predation. In R. W. McDiarmid, & R. Altig (Eds.), Tadpoles: The biology of anuran
larvae (pp. 240–278). Chicago, IL: Chicago University Press.
Altig, R., & Johnston, G. F. (1989). Guilds of anuran larvae: Relationships among developmental modes, morphologies, and habitats. Herpetological Monographs, 81–109. https://doi. org/10.2307/1466987
Altig, R., & McDiarmid, R. W. (1999). Body plan: Development and mor‐ phology. In R. W. McDiarmid, & R. Altig (Eds.), Tadpoles: The biology
of anuran larvae (pp. 24–51). Chicago, IL: Chicago University Press.
Altig, R., Whiles, M. R., & Taylor, C. L. (2007). What do tadpoles really eat? Assessing the trophic status of an understudied and imperiled group of consumers in freshwater habitats. Freshwater Biology, 52(2), 386–395. https://doi.org/10.1111/j.1365‐2427.2006.01694.x Alvares, C. A., Stape, J. L., Sentelhas, P. C., Gonçalves, J. L. M., &
Sparovek, G. (2013). Köppen’s climate classification map for Brazil. Meteorologische Zeitschrift, 22(6), 711–728. https://doi. org/10.1127/0941‐2948/2013/0507
Auger, S., & Shipley, B. (2013). Inter‐specific and intra‐specific trait varia‐ tion along short environmental gradients in an old‐growth temperate forest. Journal of Vegetation Science, 24(3), 419–428.
Baldo, D., Candioti, F. V., Haad, B., Kolenc, F., Borteiro, C., Pereyra, M. O., … Pie, M. R. (2014). Comparative morphology of pond, stream and phytotelm‐dwelling tadpoles of South American Redbelly Toads (Anura: Bufonidae: Melanophryniscus). Biological Journal of the
Linnean Society, 112(3), 417–441.
Bastias, C. C., Fortunel, C., Valladares, F., Baraloto, C., Benavides, R., Cornwell, W., … Kraft, N. J. B. (2017). Intraspecific leaf trait variability along a boreal‐to‐tropical community diversity gradi‐ ent. PLoS ONE, 12(2), e0172495. https://doi.org/10.1371/journal. pone.0172495
Bates, D., Maechler, M., Bolker, B., & Walker, S. (2015). Fitting linear mixed‐effects models using lme4. Journal of Statistical Software,
67(1), 1–48.
Bentley, P. L., Taudière, A., Messier, J., Albert, C. H., Paine, T., Malhi, Y.,… Violle, C. (submitted). Functional trait sampling strategies and the detection of community assembly processes in tropical forest trees. Carmona, C. P., Azcarate, F. M., Bello, F., Ollero, H. S., Lepš, J., &
Peco, B. (2012). Taxonomical and functional diversity turnover in Mediterranean grasslands: Interactions between grazing, hab‐ itat type and rainfall. Journal of Applied Ecology, 49(5), 1084–1093. https://doi.org/10.1111/j.1365‐2664.2012.02193.x
Chesson, P. L. (2000). Mechanisms of maintenance of species diversity.
Annual Review of Ecology and Systematics, 31, 343–366. https://doi.
org/10.1146/annurev.ecolsys.31.1.343
de Bello, F., Lavorel, S., Albert, C. H., Thuiller, W., Grigulis, K., Dolezal, J., … Lepš, J. (2011). Quantifying the relevance of intraspecific trait variability for functional diversity. Methods in Ecology and Evolution,
2(2), 163–174. https://doi.org/10.1111/j.2041‐210X.2010.00071.x
Dodélec, S., & Chessel, D. (1991). Recent developments in linear ordi‐ nation methods for environmental sciences. Advances in Ecology, 1, 133–155.
Dray, S., & Dufour, A. B. (2007). The ade4 package: Implementing the duality diagram for ecologists. Journal of Statistical Software, 22(4), 1–20.
Duellman, W. E., & Trueb, L. (1994). Biology of amphibians. Baltimore, MD: Johns Hopkins University Press.
Enquist, B. J., Norberg, J., Bonser, S. P., Violle, C., Webb, C. T., Henderson, A., … Savage, V. M. (2015). Scaling from traits to ecosystems: de‐ veloping a general trait driver theory via integrating trait‐based and metabolic scaling theories. Advanced in Ecological Research, 52, 249–318.
Eterovick, P. (2003). Distribution of anuran species among montane streams in south‐eastern Brazil. Journal of Tropical Ecology, 19, 219– 228. https://doi.org/10.1017/S0266467403003250 Eterovick, P. C., & Barata, I. M. (2006). Distribution of tadpoles within and among Brazilian streams: The influence of predators, habitat size and heterogeneity. Herpetologica, 62, 367–379. https://doi.org/10.16 55/0018‐0831(2006)62[365:DOTWAA]2.0.CO;2 Eterovick, P. C., & Fernandes, G. W. (2001). Tadpoles distribution within montane meadow streams at the Serra do Cipó, southeastern Brazil: Ecological or phylogenetic constraints? Journal of Tropical Ecology, 17, 683–693.
Eterovick, P. C., Lazarotti, I., Franco, B. P., & Dias, C. J. (2010). Seasonal variation of tadpole spatial niches in permanent streams the roles of predation risk and microhabitat availability. Austral Ecology, 35, 879–887. https://doi.org/10.1111/j.1442‐9993. 2009.02094.x González‐Suárez, M., & Revilla, E. (2013). Variability in life‐history and ecological traits is a buffer against extinction in mammals. Ecology Letters, 16(2), 242–251. https://doi.org/10.1111/ele.12035 Gosner, K. L. (1960). A simplified table or staging anuran embryos and larvae with notes on identification. Herpetologica, 16, 183–190. Gotelli, N. J., & McCabe, D. J. (2002). Species co‐occurence: A meta‐
analysis of JM Diamond’s assembly rules models. Ecology, 83(8), 2091–2096. Griffiths, H. M., Louzada, J., Bardgett, R. D., & Barlow, J. (2016). Assessing the importance of intraspecific variability in dung beetle functional traits. PLoS ONE, 11(3), e0145598. https://doi.org/10.1371/journal. pone.0145598 Grosjean, S. (2005). The choice of external morphological characters and developmental stages for tadpole‐based anuran taxonomy: A case study in Rana (Sylvirana) nigrovittata (Blyth, 1855) (Amphibia, Anura, Ranidae). Contributions to Zoology, 74(1/2), 61–76.
Grözinger, F., Thein, J., Feldhaar, H., & Rödel, M. O. (2014). Giants, dwarfs and the environment–metamorphic trait plasticity in the common frog. PLoS ONE, 9(3), e89982. https://doi.org/10.1371/journal. pone.0089982
Harris, R. N. (1999). The Anuran Tapdole: evolution and maintainance. In R. W. McDiarmid, & R. Altig (Eds.), Tadpoles: the biology of anuran
larvae (pp. 279–294). Chicago, IL: Chicago University Press.
Hart, S. P., Schreiber, S. J., & Levine, J. M. (2016). How variation between individuals affects species coexistence? Ecology Letters, 19, 825–838. Hoff, K. V., Blaustein, A. R., McDiarmid, R. W., & Altig, R. (1999). Behavior:
Interactions and their consequences. In R. W. McDiarmid, & R. Altig (Eds.), Tadpoles: The biology of anuran larvae (pp. 215–239). Chicago, IL: Chicago University Press.
Hoff, K. V., & Wassersug, R. J. (2000). Tadpole locomotion: Axial movement and tail functions in a largely vertebraeless verte‐ brate 1. American Zoologist, 40(1), 62–76. https://doi.org/10.1093/ icb/40.1.62
Hughes, A. R., Hanley, T. C., Orozco, N. P., & Zerebecki, R. A. (2015). Consumer trait variation influences tritrophic interactions in salt marsh communities. Ecology and Evolution, 5(13), 2659–2672. https:// doi.org/10.1002/ece3.1564
Hulshof, C. M., & Swenson, N. G. (2010). Variation in leaf functional trait values within and across individuals and species: An example from a Costa Rican dry forest. Functional Ecology, 24(1), 217–223. https:// doi.org/10.1111/j.1365‐2435.2009.01614.x
IBGE (2012). Manual técnico da vegetação brasileira. 2ª edição revisada e
ampliada. Rio De Janeiro, Brazil: Instituto Brasileiro De Geografica E
Estatística – IBGE.
Jung, V., Albert, C. H., Violle, C., Kunstler, G., Loucougaray, G., & Spiegelberger, T. (2014). Intraspecific trait variability mediates the response of subalpine grassland communities to extreme drought events. Journal of Ecology, 102(1), 45–53. https://doi.org/10.1111/ 1365‐2745.12177
Jung, V., Violle, C., Mondy, C., Hoffmann, L., & Muller, S. (2010). Intraspecific variability and trait‐based community as‐ sembly. Journal of Ecology, 98(5), 1134–1140. https://doi. org/10.1111/j.1365‐2745.2010.01687.x
Kopp, K., & Eterovick, P. C. (2006). Factors influencing spatial and temporal structure of frog assemblages at ponds in southeastern Brazil. Journal of Natural History, 40(29–31), 1813–1830. https://doi. org/10.1080/00222930601017403
Kraft, N. J. B., Adler, P. B., Godoy, O., James, E. C., Fuller, S., & Levine, J. M. (2015). Community assembly, coexistence, and the environmen‐ tal filtering metaphor. Functional Ecology, 29(5), 592–599. https://doi. org/10.1111/1365‐2435.12345
Kumordzi, B. B., de Bello, F., Freschet, G. T., Le Bagousse‐Pinguet, Y., Leps, J., & Wardle, D. A. (2015). Linkage of plant trait space to successional age and species richness in boreal forest understo‐ rey vegetation. Journal of Ecology, 103(6), 1610–1620. https://doi. org/10.1111/1365‐2745.12458
Laurila, A., Karttunen, S., & Merilä, J. (2002). Adaptive pheno‐ typic plasticity and genetics of larval life histories in two Rana temporaria populations. Evolution, 56(3), 617–627. https://doi. org/10.1111/j.0014‐3820.2002.tb01371.x
Layman, C. A., Newsome, S. D., & Gancos, C. T. (2015). Individual‐ level niche specialization within populations: Emerging areas of study. Oecologia, 178, 1–4. https://doi.org/10.1007/ s00442‐014‐3209‐y
Le Bagousse‐Pinguet, Y., Bello, F., Vandewalle, M., Leps, J., & Sykes, M. T. (2014). Species richness of limestone grasslands increases with trait overlap: Evidence from within‐and between‐species functional di‐ versity partitioning. Journal of Ecology, 102(2), 466–474. https://doi. org/10.1111/1365‐2745.12201
Le Bagousse‐Pinguet, Y., Böger, L., Quero, J. L., García‐Gomez, M., Soriano, S., Maestre, F. T., & Gross, N. (2015). Traits of neighbouring plants and space limitation determine intraspecific trait variability in semi‐arid shrublands. Journal of Ecology, 103(6), 1647–1657. https:// doi.org/10.1111/1365‐2745.12480
Lepš, J., de Bello, F., Šmilauer, P., & Doležal, J. (2011). Community trait response to environment: Disentangling species turnover vs intra‐ specific trait variability effects. Ecography, 34(5), 856–863. https:// doi.org/10.1111/j.1600‐0587.2010.06904.x
Li, Y., Shipley, B., Price, J. N., Dantas, V. L., Tamme, R., Westoby, M., … Batalha, M. A. (2018). Habitat filtering determines the functional niche occupancy of plant communities worldwide. Journal of Ecology,
106(3), 1001–1009. https://doi.org/10.1111/1365‐2745.12802
McGill, B. J., Enquist, B. J., Weiher, E., & Westboy, M. (2006). Rebuilding community ecology from functional traits. Trends in
Ecology & Evolution, 21(4), 178–185. https://doi.org/10.1016/j.
tree.2006.02.002
Messier, J., McGill, B. J., & Lechowicz, M. J. (2010). How do traits vary across ecological scales? A case for trait‐based ecology. Ecology Letters,
13(7), 838–848. https://doi.org/10.1111/j.1461‐0248.2010.01476.x
Michel, M. J. (2012). Phenotypic plasticity in complex environments: Effects of structural complexity on predator‐ and competitor in‐ duced phenotypes of tadpoles of wood frog, Rana sylvatica. Biological
Journal of the Linnean Society, 105(4), 863–863.
Myers, N., Mittermeier, R. A., Mittermeier, C. G., da Fonseca, G. A., & Kent, J. (2000). Biodiversity hotspots for conservation priorities.
Nature, 403(6772), 853–858.
Neyret, M., Bentley, L. P., Oliveras, I., Marimon, B. S., Marimon‐Junior, B. H., Almeida de Oliveira, E., … Malhi, Y. (2016). Examining variation in the leaf mass per area of dominant species across two contrasting